A Climate Change / Global Warming Spectrum

In politics, most people’s views can be placed on a spectrum, when it comes to climate change / global warming there is no such perspectives. The views are often polarized, particularly by those who believe in a future climate catastrophe. This is an initial attempt at a grid aimed at clarifying the issues. Your constructive advice is sought on how this might be improved.

When there are contentious or politicized issues, a spectrum of opinions emerge where there is free discussion of ideas. This is true in politics and the Christian religion. In both, there is not just a one-dimensional spectrum of ideas, but multi-dimensional perspectives. For instance, in politics it has been argued that the left-right spectrum should be split into economic and moral issues. The United States Libertarian Party has had a simple survey running since 1995. A more comprehensive (but still American-orientated) survey is the Political Spectrum Quiz.

Another idea comes from Greg Craven, who did a series of zany You-Tube videos on Climate Change, particularly such as “The Most Terrifying Video You’ll Ever See” and “How it all ends“. He claimed that for the mass of non-scientists it was best to take a risk-based approach, grading the science on the credibility of those who made the claims. One objection with his analysis was it was based on polar extremes. That is either the worst climate catastrophe imaginable, or it is all a hoax. I proposed that there was a spectrum of possible outcomes, with the apocalyptic catastrophe at one extreme and the null outcome at the other. Basically there is a spectrum of views.

For this spectrum, the possible scenarios are from the null outcome on the left, rising to a huge climate catastrophe on the right.

Craven’s argument was to consider either 0 or 1000, whereas I claimed that the UNIPCC scenarios (representing the “consensus” of climate scientists), allowed for a fair range of outcomes. I have provided a log scale, as this puts clear distance between someone who believes in a low risk of catastrophe of extreme catastrophe to someone who says there is no risk at all. For instance, if someone believes that there is a 1% chance of the worst case, a 9% chance of loss of 100 and a 90% chance of a loss of 10, then their score would be 0.01*1000 + 0.09*100 + 0.90*10 = 28. In other words, for that person, especially if they are risk averse, there is still a very significant issue that should justify serious consideration of some type of global policy action.

But this measure of the prospective level of climate catastrophe needs to be based upon something. That something is scientific evidence, not people’s intuitions or gut feelings. If we imagine that the uncertainties can be measured as risks (as neoclassical economists do) then then the worst case scenario can only be attained if there is near certain, unambiguous scientific evidence in support of that prediction. If the evidence is weak statistically, gives highly variables results depending on methodology or data sets, or only tangential to the prediction, then a lower risk weighting lower than 1 will need to be ascribed. For an overall picture, we need to ascribe a weighting to the body of evidence. I propose a traffic light system. In outline green is for an overwhelming body of evidence, red is for no proper evidence whatsoever, and amber is for some weak evidence. Something along the following lines:-
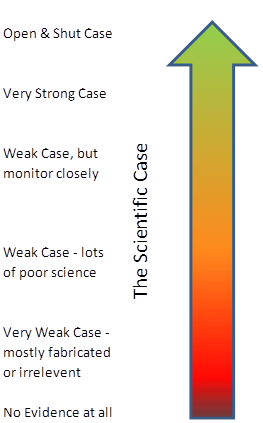
Basically, an unambiguous case for impending global catastrophe must have a substantial body of strong scientific evidence to substantiate that case, with little or no contrary evidence. I will develop on another day the analogy with evidence presented to a criminal court by the prosecution. However, for the present, an analogy that is relevant is that this conclusion is only reached once the evidence fails to fall over under independent cross-examination.

This gives us a grid with the magnitude of the climate catastrophe on the X axis, and the scientific case on the Y axis. The grid, with my first opinion of where people various groups are placed, is given below. I know it is controversial – the whole aim is to get people to start thinking constructively about their views.
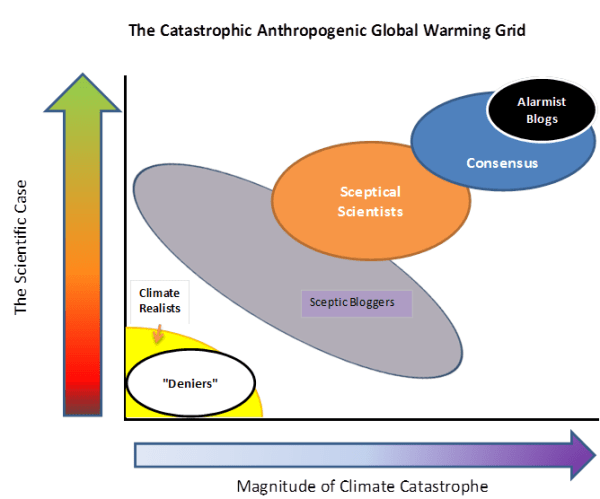
Alarmist Blogs (for instance Skeptical Science and Desmogblog) have an extreme black-and-white one world where they are always right, and anyone who disagrees is the polar opposite . “Deniers” is a bogeyman construct of their making.

If one reads the detail of UNIPCC AR4 report, the “Consensus” of climate scientists allow for some uncertainties, and for scenarios which are not so catastrophic.

The more Sceptical Scientists, such as Richard Lindzen, Roger Pielke Snr and Roy Spencer, view increasing greenhouse gases as a serious issue for study. However, they view the evidence as being both much weaker than the “consensus” and pointing to a much less alarming future.

The most popular Sceptic Blogs, such as Wattsupwiththat, Climate Audit and Bishop Hill I characterise as having a position of “The stronger the evidence, the weaker the relevance“. That is they allow for a considerable spread of views, but neither dismiss rise in CO2 as of no consequence, nor claim that the available evidence is strong.

Finally, the Climate Realists such as Joanne Nova and the British Climate Realists website. They occupy a similar position as the “deniers”, but from a much more substantial position. They can see little or no evidence of catastrophe, but huge amounts of exaggeration dressed up as science.

What are your opinions? What position do you think you lie on the grid? Is there an alternative (and more informative) way of characterizing the different positions?
Heartland Leak – The Implications

The stolen documents from the Heartland Institute have caused a lot of comment on the blogs. There are a number of things that will come out of this.

1. The consensus climate scientists and their cohorts cannot deal with numbers. Just as they have no sense of proportion with financial values (see Jo Nova on this), they likewise have no sense of proportion with sea level rise, temperature rise, or extreme weather events.

2. A better antonym of “sceptical” than “undoubting” or “believer” is “gullible”. Seems DeSmogBlog did not think to check out the authenticity of the damming 2012 strategy document, neither do they accept the Heartland rebuttal. It fitted the narrative, so they published within an hour of receiving the mail. Similarly The Guardian posted a number of one-sided reports (here, here, here), as did Roger Black of the BBC, without waiting to verify the facts. The most alarming 2012 strategy document is a fax (Judith Curry has other references)

3. A number of people, like me, will visit Heartland.org for the first time. They will find they have 7 policy areas employing 20 people, of which “Environment & Energy” employs 3. They specialise in providing cogent summaries of these issues to policy-makers. Whatever you think of their political stance, they are hardly the secretive, rabid backwoodsmen right-wingers that the alarmists project.

4. This support for spreading information in a concise, intelligible form also comes out in the sceptic-funding “exposes”. There is one-off support for Antony Watts who

“proposes to create a new Web site devoted to accessing the new temperature data from NOAA’s web site and converting them into easy-to-understand graphs that can be easily found and understood by weathermen and the general interested public.” 

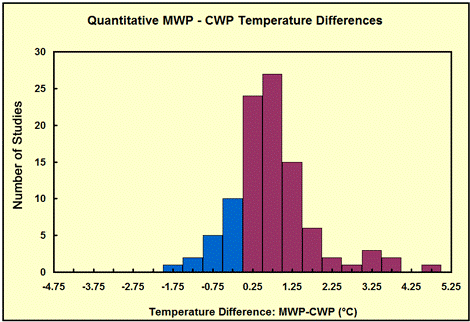
The, alleged, biggest recipient by far of monthly funding is Craig D Idso, who founded the co2science.org website. This provides summaries of climate science papers, collating their results to help give an overall picture of such as the medieval warm period, ocean acidification and the effect of CO2 on plant growth. For instance, I like this graphic summarising the proxy studies of the MWP showing that the Mannian Hockey Stick studies need to at least reconcile their claim that average global temperatures are warmer than in the last 1000 years.

5. It illustrates the upside-down nature of climatology, compared with conventional science. Conventional science is based on making bold statements and predictions that are substantiated by the evidence, with very clear and replicable methods. Over time it refines its techniques, strengthens its methods of analysis and sees its predictions confirmed. It does not need to denigrate, or attempt to silence its detractors. Like the historians of the holocaust, conventional science just points to the evidence and enlightens those who seek the truth. The real deniers of truth in history have been those who silence their opponents and fabricate distortions.

Overall, the leak exposes why the little Heartland Institute is so evil and dangerous to many. They threaten the jobs and reputations of tens of thousands of climate scientists, “policy-makers”, regulators, and powerful business interests in the alternatives to reliable energy. On the other hand, they are on the side of those made hungry by fuel crops competing with food, and of future generations globally, who will be worse-off by growth-sapping mitigation policies.

Cold water on sea level rise alarmism

The new article in Nature on “Recent contributions of glaciers and ice caps to sea level rise” (Jacob et al. 2012) is in stark contrast to what has gone before. It is far from the previous claims.

The main estimates before Jacob et al. 2012 were:-

  • The Himalayan Glaciers will disappear by 2035. (UNIPCC AR4 2007) Changed to the Himalayan Glaciers may disappear by 2350. (UNIPCC 2010)
  • The Grace Satellite data shows that the polar ice caps are not only melting, but the melt rate is accelerating. Velicogna 2009 claimed that the acceleration in Greenland was −30 ± 11 bnt/yr2 to 286 bnt/yr-1 in 2007 to 2009, and in Antarctica was −26 ± 14 bnt/yr2 to 246 bnt/yr-1 in 2007 to 2009. Concentrating on the period from 2006 to early 2009 for Antarctica only , Chen et al. 2009 estimated that the continent was losing ice at the rate of 190 ± 77 bnt/yr-1, two-thirds is of which comes from West Antarctica, covering about a quarter of the total land surface area. By 2010, the loss from both polar caps would, by Veligona’s estimate be 600 to 650 bnt/yr-1.
  • The average of these two articles was that in 2010 there would be around 600 bnt/yr-1 loss per year.
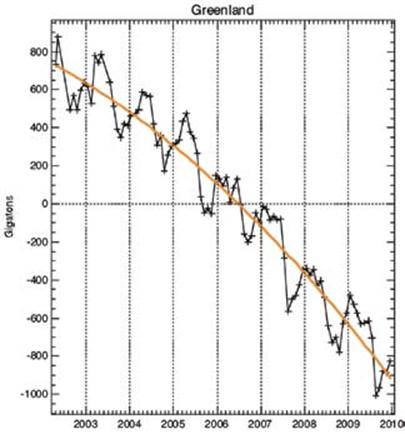
  • One of the articles’ authors, Prof John Wahr of University of Colarado, Boulder, had previously stated that the Grace measurements indicate an accelerating trend in Greenland. The current graph at Wahr’s website for Greenland shows a distinct accelerating trend through to the start of 2010.

    Mass variability summed over the entire Greenland Ice Sheet, monthly Gravity Recovery and Climate Experiment (GRACE) results (black line; the orange line is a smoothed version) April 2002 and December 2009.

    Prof John Wahl’s graph of Greenland Ice sheet loss, indicating a doubling of the rate of loss over the period to around 150 bnt/yr-1 in 2009.

  • In Zwally and Giovinetto 2011, using three separate estimation techniques, and including the pre-satellite data from 1992 to 2002, estimated the range of +27 to -40 bnt/yr-1.

The new paper in Nature:-

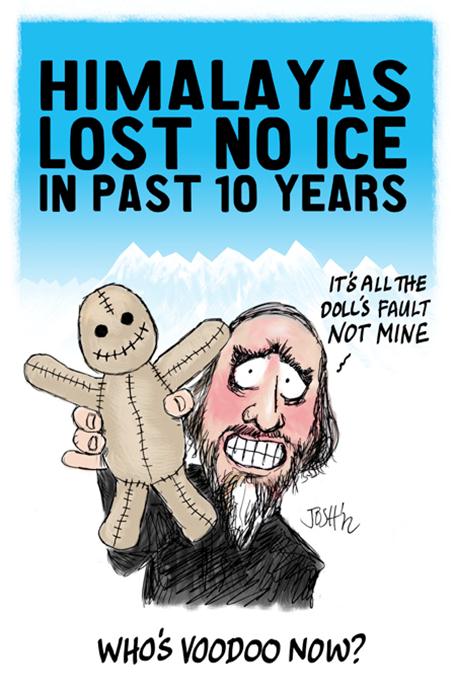
  • Estimates no net loss from the Himalayas in the period 2003 to 2010. When the claim that the Himalayas would lose their glaciers by 2035, Rajendra Pauchari, head of the UNIPCC said the doubts were “voodoo science”. Now even the more moderate claim of melting over hundreds of years looks to be in doubt. Josh has penned a cartoon to illustrate this point.

  • Velicogna 2009, seems somewhat extreme. The Nature paper would estimates a loss of 50% to 75% Velicogna estimate for 2010.
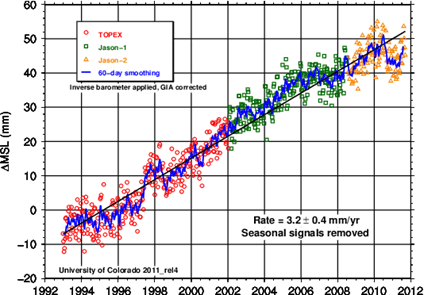
  • Most importantly, there is no mention of acceleration of ice melt from the polar ice caps. This sudden turn-around might be to a sudden change in the data. The sea level rise appears to have stalled in the last 18-24 months, so the sea ice melt (which the Nature paper estimates accounts for 40% of the sea level rise) may have stalled as well. (See Appendix 2). It is necessary to re-run the Nature paper numbers for 2011 data to confirm if this is the case.

In conclusion, it looks that the new nature paper reaches a more moderate position than previous papers using the GRACE satellite data, as it uses a longer period, and subjects the data to a more detailed breakdown. However, in terms of the polar ice melt, it still more extreme than a paper that uses a longer timeframe and three distinct methods of calculation.

Appendix 1 – Leo Hickman in the Guardian has a breakdown of the figures, that nicely puts the issue in context.

Glaciers
Ignore Region Rate (Gt yr-1)
1 Iceland -11.±.2
2 Svalbard -3.±.2
3 Franz Josef Land 0.±.2
4 Novaya Zemlya -4.±.2
5 Severnaya Zemlya -1.±.2
6 Siberia and Kamchatka 2.±.10
7 Altai 3.±.6
8 High Mountain Asia -4.±.20
8a Tianshan -5.±.6
8b Pamirs and Kunlun Shan -1.±.5
8c Himalaya and Karakoram -5.±.6
8d Tibet and Qilian Shan 7.±.7
9 Caucasus 1.±.3
10 Alps -2.±.3
11 Scandinavia 3.±.5
12 Alaska -46.±.7
13 Northwest America excl. Alaska 5.±.8
14 Baffin Island -33.±.5
15 Ellesmere, Axel Heiberg and Devon Islands -34.±.6
16 South America excl. Patagonia -6.±.12
17 Patagonia -23.±.9
18 New Zealand 2.±.3
19 Greenland ice sheet.+.PGICs -222.±.9
20 Antarctica ice sheet.+.PGICs -165.±.72
  Total -536.±.93
  GICs excl. Greenland and Antarctica PGICs -148.±.30
  Antarctica.+.Greenland ice sheet and PGICs -384.±.71
  Total contribution to SLR -1.48.±.0.26
  SLR due to GICs excl. Greenland and Antarctica PGICs -0.41.±.0.08
  SLR due to Antarctica.+.Greenland ice sheet and PGICs -1.06.±.0.19


Appendix 2 – University of Colarado Sea level Rise Estimates

A Bet Won on the Warming Standstill

Congratulations to Dr David Whitehouse of the GWPF for winning a bet with Dr James Annan.

The bet, made in 2007, was that by 2011 that HADCRUT3 temperature record of 1998 would not be beaten by 2011. The bet was made at the instigation of the BBC Radio 4 program “More or Less”. Annan then provided data analysis to show why he was odds-on favourite to win the bet here and here. Both RealClimate and Mark Lynas had earlier weighed in with articles giving the mainstream viewpoint. I post on Dr Annan’s blog the following comment

The mark of good science is not to predict the obvious, but to predict the unlikely.

Dr Whitehouse has stated that it was going beyond the obvious that enabled him to take on the bet. His full analysis can be found at both the GWPF and wattsupwiththat.

Of course there are those who will point to the biased GISSTEMP to show that the warming is continuing. See my analysis here about why that dataset looks to be a little biased. There are of course those who will still maintain the warming is continuing (such as Roger Black of the BBC), but the true measure is the predictive ability.


Adelaide – a decline in extreme heatwaves?

Joanne Nova has posted data from Ian Hill on extreme heatwaves in Adelaide, Australia. To quote

It’s another mindless record used to remind the public to “keep the faith” and recite the litancy:

“Adelaide had it’s hottest start to the year since 1900″ Sky news

Picking three particular days out of 365 and comparing them over a century is about as cherry-pickingly meaningless as it gets. But Ian Hill went back through the records to find that not only have there been 79 heatwaves in Adelaide since 1887, but there have been 51 heat-waves that were hotter since 1887.

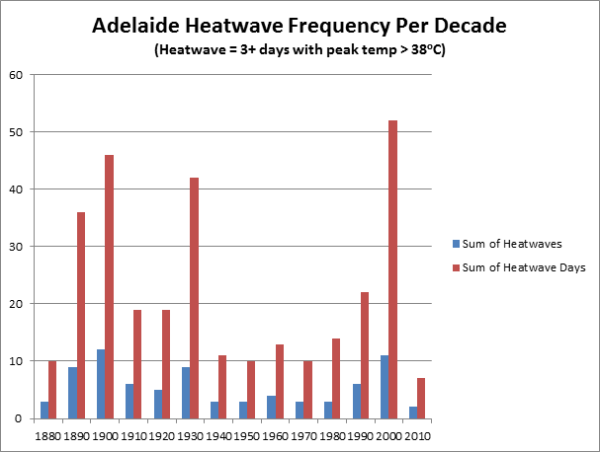
I have done a bit of number crunching of my own, that is quite revealing. Higher temperatures are meant to lead to more extreme heatwaves. Using Ian Hill’s figures Adelaide is providing an exception. Hill’s definition of a heatwave is 3 or more consecutive days where the maximum temperature exceeds 38oC. I have downloaded the figures and categorised by decade. There are two ways I have analysed this data. First is by the number of heatwaves per decade. Second is the number of days per decade.


There are a number of points.

  1. The temperature data only starts in 1887, so the 1880s are probably more significant.
  2. The current decade might be more significant.
  3. Last decade, beginning 2000 was no more significant than the decades 1890s, 1900s, or 1930s.
  4. The 1990s was no more significant than the decades 1910s and 1920s

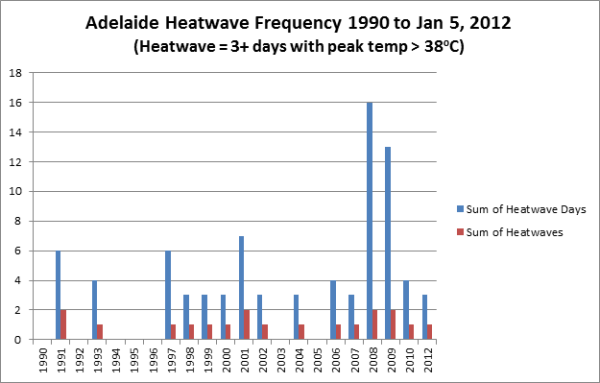
Is there, however, a revival of extreme heatwaves in the last twenty years?

Nope. Just a couple of extreme years in 2008 and 2009.


Stern’s flawed opinion of Energy Stock Valuations

There is an interesting response by Profs Richard Tol and Roger Pielke Jnr on the latter’s blog to an article in the FT by Lord Stern on energy companies being overvalued

Have Markets Misvalued Energy Companies?

Roger Pielke Jr. and Richard Tol

Writing in the Financial Times (Dec. 9) Lord Stern of Brentford suggests that the financial markets have grossly misjudged the valuation of companies that produce fossil fuels, writing, “the market has either not thought hard enough about the issue or thinks that governments will not do very much.” Stern argues that the misjudgment poses a “risk to the balance sheets of large companies – or to the planet, or both.”

Have markets misvalued energy companies? While markets are of course not perfect, for two reasons we believe that in this instance there is no evidence to suggest that the valuation of fossil fuel producers has been grossly misjudged.

First, let us assume that governments around the world decide to take swift and effective action to reduce emissions. Would this mean that fossil fuel companies would go out of business in the near term? No.

Consider the case of Apple. Apple’s revenues depend upon selling products that will be obsolete within years and historical relics in a generation. That does not stop the company from being among the most highly valued in the world. If the world transitions to carbon free energy supply, the big energy producers of today are likely to play a big role.

Under all scenarios for future energy consumption the world is going to need vastly more energy and – whether governments act to decarbonize or not – vastly different types of energy too. Energy majors are so highly valued not simply because of the fossil fuel reserves they own, but because they have the expertise to supply energy at a massive scale along with a track record of successful and rapid innovation, with the ongoing shale gas and ultradeep oil revolutions as the latest examples.

Second, what if governments fail to deeply cut emissions? Might the impacts of unmitigated climate change lead to a dramatic reduction in the valuation of fossil fuel companies?

According to the work of Nick Stern himself this seems highly unlikely. In his famous review of climate change Stern argued that unmitigated climate change might reduce global GDP by as much as 20% by 2100. Using Stern’s own numbers for the most extreme impacts would mean that instead of growing by 2.5% per year to 2100, GDP would grow by 2.24%, with the largest effects occurring at the end of the century. This hardly seems cause for a dramatic revaluation of fossil fuel companies today. 

The impacts estimated by Stern on behalf of the British government are very pessimistic compared to the estimates found in the academic literature. Furthermore, changes in the growth rate of the economy have a muted impact on the growth in energy demand.

Indeed, future demand for energy is largely insensitive to whether governments decide to act on climate change. The more than 1.5 billion people without reliable access to electricity will demand access regardless. A world with unmitigated climate change could in fact be more energy intensive, for instance if more people demand air conditioning. In either case the future for energy companies would be bright.

Humans affect the climate system and it is important for policy makers to respond. But it is unlikely that efforts to second guess the market valuation of energy companies will contribute to such responses. Of course, if Nick Stern really believes that energy companies have been grossly over-valued he could put his money where his convictions lie. Who knows, he may one day be the subject of the sequel to the Big Short.

Roger Pielke Jr. is a professor at the University of Colorado. Richard Tol is a professor at the Economic and Social Research Institute in Dublin and at the Vrije Universiteit in Amsterdam.

My own comment is

The Stern review was not only criticized for being too concerned with the more extreme scenarios, but for applying a near zero discount rate. Whatever the economist’s policy-related arguments over discount rates (and Prof. Tol uses 3% plus), the market valuations of share prices are based upon much, much higher discount rates. This is for good reason. Suppose at the end of 1911 someone could have known that there would be an oil embargo in 1973, resulting from a cartel of oil-producing nations usurping the considerable power of the oil companies. What should have been the discount factor on the 1911 price of oil stocks considering in the interim there were two world wars, between which there was a massive global depression? Even if this was the case the local market factors (such as the emergence of the car industry, global growth, the development of the internal combustion engine and the relative fall in the oil price against coal) were far more important than the historical events. I would contend that in 1911, even if were highly likely that an oil company would be rendered bankrupt 60 years later, the discount factor on the share price would be approximately zero.

Furthermore, since the Stern review the scientific evidence has consistently failed to support the more alarmist scenarios resulting from any further warming (e.g. rapid melting of the Himalayan Glaciers or increased severity of hurricanes), nor for extreme temperature rises resulting from positive feedbacks to the CO2 induced warming. To the outsider looking at the emerging evidence, the cost impact of do-nothing scenarios (weighted by risk) is many times lower than when the Stern Review or AR4 were being published.

I fully realise that your comments were moderated to increase the chance of publication. However, if a more balanced version of Stern were done on today’s evidence, I firmly believe that (like Prof. Tol has concluded) current proposed mitigation policies do not have any form of benefit-cost justification.

Lord Stern might be a distinguished climate change activist, but he falls into the same trap of the amateur armchair activist. By seeing the world from their own narrow perspective, they misread the wider opinions and the facts of the real world. It is when such people acquire positions of power, with immoderate views not softened by political experience, that they can become deniers of reality and haters of sections of the community.

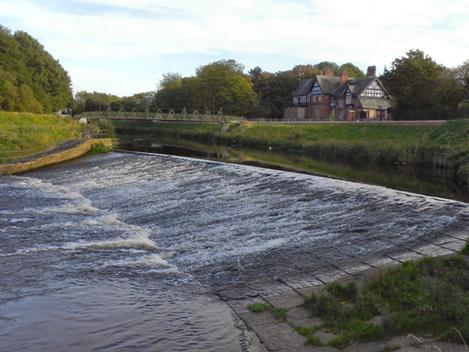
Hydro at Northenden Weir – Poor subsidising the Greens?

The South Manchester Reporter carried an article about a plan to install hydro power in South Manchester.

“The Didsbury Greening and Growing Group (DGG) is hoping to install a new water-powered turbine on the grounds of the old Northenden Mill on the River Mersey.”

For around £500,000 they group, lead by the local Rector Greg Foster, hope to install an Archimedes Screw generating up to 50kw.

Will this save the world? I commented

For half a million quid you get 50kw (67hp) – the power of a small car. For most of the year it will be less. It will only be financially viable due to the 18.7p/kwh feed-in tariff. That is a charge added to everyone’s bill. So those with money to invest in this green scheme will (in a small way) be increasing fuel poverty.

Another way of seeing how the true perspective of this scheme is to measure it against a modern nuclear power station. This can churn out over 25,000 times the power at steady levels 365 days per year. With accelerated closure of fossil-fueled power stations we need to build one such power station every year for a generation.

I received the following reponse

“Manicbeancounter”: let’s just look at your 1.2l petrol engine comparison and see if it really stands up. Your engine has to go flat out, foot to the floor all the time to get say 50kW at the shaft. It’s going to chew through about 10 litres of petrol an hour. Let’s get that to run for the 40 years or so life of a hydro plant (without major refurb). So at say £1.30/litre for petrol, that engine gets through £4.55 million pounds worth of petrol at today’s prices. So does £0.5million all in for the capital expense of an environmentally friendly scheme look so silly after all? Oh, and your little 1.2l car would have done about 35 million miles flat out at 100mph. And that one little generator would have made enough electricity for about half a billion cups of tea in its lifetime taking into account seasonal variations in rainfall. Not such small numbers after all eh?

Must admit, David Slee has done his maths. However, his calculations are out by a factor of two. A stationery generator’s consumption is measured in grams per kwh. 10 litres to produce 50 kwh works out at around 170g/kwh. (RD of petrol approx. 0.85?) This is roughly the fuel consumption of a diesel engine in a large ship. A small petrol engine optimised for flexible power output would use about twice as much.

However, I do not use the comparison of a 1.2 litre petrol engine for cost, but for power output. If anyone was daft enough to generate power from an internal combustion engine filled up from the filling station, they would do the over-taxed masses a favour. Of the £4.55m (or £9m) fuel cost, over half would be tax. So the rich investors would be subsidizing everyone else. A power station does not pay tax. (Generators use red diesel – and businesses reclaim the VAT). A quick calculation reveals is that if this hydro scheme averages 25kw over the year, over 25 years the index-linked subsidy (4% inflation) would generate £1.7m. If the wholesale price of around 8p/kwh is inflated by just 1% a year, the investors will get their money back under 8 years*. From selling electricity to the grid over 40 years investors would get a further £1.7m. Then around £300k for an overhaul to keep £80k+ a year rolling in.

So if this scheme gets off the ground, those lucky enough to have £50,000 to invest could secure a pension equivalent to the basic state pension, and will probably get a national award for their money-making wheeze. Most will be green with envy, or red with anger at their rising utility bills.

*NB If a discount rate of 8% is used, NPV = 0 in just over 11 years. Over 40 years to the projected major overhaul, NPV is £400k.

Climate Change Damage Impacts – A story embellished at every retelling

Willis Eschenbach has a posting on a recent paper on climate change damage impacts. This is my comment, with hyperlinks and tables.

My first reaction was “Oi– they have copied my idea!”

Well the damage function at least!

https://manicbeancounter.wordpress.com/2011/02/11/climate-change-policy-in-perspective-%E2%80%93-part-1-of-4/

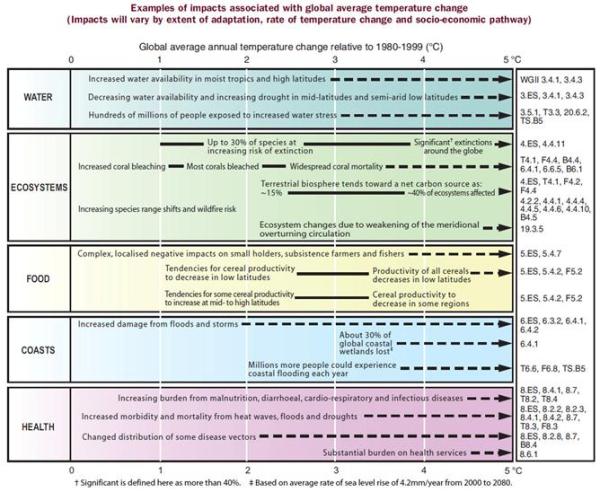
Actually, this can be found by the claims of the Stern Review or AR4. Try looking at the table in AR4 of “Examples of impacts associated with global average temperature change” and you will get the idea.

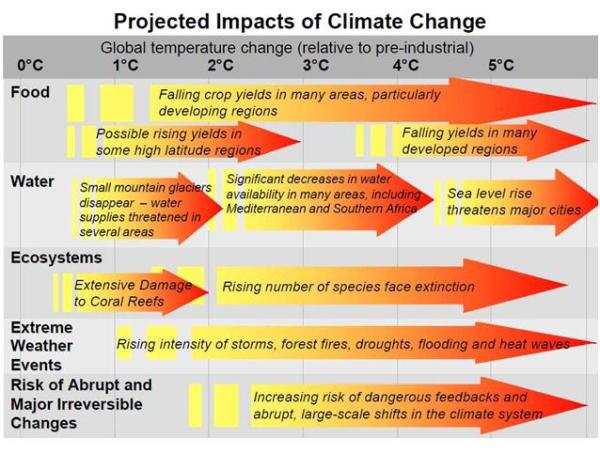
A simpler, but more visual, perspective is gained from a slide produced for the launch of the Stern Review.

More seriously Willis, this is worse than you thought. The paper makes the claim that unlikely but high impact events should be considered. The argument is that the likelihood and impacts of potential catastrophes are both higher than previous thought. The paper then states

“Various tipping points can be envisaged (Lenton et al., 2008; Kriegler et al., 2009), which would lead to severe sudden damages. Furthermore, the consequent political or community responses could be even more serious.”

Both of these papers are available online at PNAS. The Lenton paper consisted of a group of academics specialising in catastrophic tipping points getting together for a retreat in Berlin. They concluded that these tipping points needed to include “political time horizons”, “ethical time horizons”, and where a “A significant number of people care about the fate of (a)

component”. That is, there is a host of non-scientific reasons for exaggerating the extent and the likelihood of potential events.

The Krieger paper says “We have elicited subjective probability intervals for the occurrence of such major changes under global warming from 43 scientists.” Is anybody willing to assess if the subjective probability intervals might deviate from objective probability intervals, and in which direction.

So the “Climate Change damage impacts” paper takes two embellished tipping points papers and adds “…the consequent political or community responses could be even more serious.”

There is something else you need to add into the probability equation. The paper assumes the central estimate of temperature rise from a doubling of CO2 levels is 2.8 degrees centigrade. This is only as a result of strong positive feedbacks. Many will have seen the recent discussions at Climateaudit and wattsupwiththat about the Spencer & Bracewell, Lindzen and Choi and Dessler papers. Even if Dessler is given the benefit of the doubt on this, the evidence for strong positive feedbacks is very weak indeed.

In conclusion, the most charitable view is that this paper takes an exaggerated view (both magnitude and likelihood) of a couple of papers with exaggerated views (both magnitude and likelihood), all subject to the occurrence of a temperature rise for which there is no robust empirical evidence.

WWF aims for World Domination?

Donna Laframboise has a posting on the sheer scale of the World Wildlife Fund (cross- posted at wattsupwiththat). No longer a small cuddly charity it has global revenues of €524m, 5,000 staff and a presence in 30 countries.

This is Part 1. What will part 2 bring? Might I guess that it could be on future ambitions?

Might I suggest that Donna Laframboise will direct us to pages 26 & 27 of the 2010 Annual Review (Page 14 on Google Docs)? WWF is celebrating its’ 50th Anniversary, so naturally it will look ahead.

The Section is “WHAT WE WILL ACHIEVE“. There is no “might” or “by supporting others”. It is what WWF will achieve on their on.

The first is mild and a laudatory objective, well-within their remit.

By 2022 “the number of tigers in the wild has doubled from just 3,200 in 2010.”

That is great and why many support the WWF, along with saving pandas and polar bears. Although, they might need to persuade others, like the Indonesian and Indian Governments, to do most of the work. Next is a bit more ambitious.

By 2030 “the amazon’s land and freshwater ecosystems are properly conserved, so they’re no longer under threat.”

A bit more ambitious, but short of funding thousands of armed environment enforcement officers to police over a million square miles of Brasil, Peru, Columbia, Bolivia and Venezuela, along with the necessary legal powers this may not be achieved without some assistance. Sovereignty issues spring to mind.

By 2020 “Through energy efficiency, sustainable management of natural resources and emissions cuts, China’s economy is growing within the capacity of one planet.“

Now, unless this is meaningless guff, China will make actual cuts in their emissions through the actions of WWF (not the UNIPCC). Currently the Chinese government has said it will grow their emissions by less the nation’s growth rate. With 10% growth, it means the current plans are for China’s emissions will more than double from 2010 levels and still meet the targets. An actual cuts would mean closure of new coal-fired power stations, closing the airports, denying hundreds of millions the prospect of car ownership, covering the area in windmills and a drastic reduction of growth to maybe 2-3%. This could only be achieved by a coup d’etat followed by a government as brutal as Mao Zedong or Josef Stalin in their primes. But the biggest one is.

By 2050 “Global Greenhouse gas emissions have been cut by 80% compared to 1990 levels”

This is the biggest ambition by far. Since 1990 greenhouse gas emissions has increased substantially. So the level of cuts in little more than a generation is immense. There is no global agreement in place, nor is there likely to be. Even if there were an agreement, it cannot be achieved without vast human suffering (here & here). To impose a reduction not just in growth, but in living standards as well, would require a highly repressive global regime, the like of which the world has never seen. There are three possible scenarios

1. WWF has advanced plans underway for World Domination

First it will take over the UNIPCC (where it is already highly influential). Then it will organise a coup d’etat in China. It will then use this as a springboard for world domination.

2. The WWF has a vastly overblown sense of its’ own importance

The WWF has been taken over by a bunch of climate extremists who have lost a true perspective on reality.

3. The WWF does not internally check its’ major annual report

Which means that the longer reports WWF produces on climate change, (the famous grey literature on UNIPPC AR4) are probably not checked as well. WWF therefore needs to clean-up its act if it is to be taken seriously as an environmental organisation.

One might notice an ascending order of likelihood in the scenarios 🙂

Economic v Climate Models

Luboš Motl has a polemical look at the supposed refutation of a sceptics arguments. This is an extended version of my comment.

Might I offer an alternative view of item 30 – economic v climate models?

Economic models are different from climate models. They try to model empirical generalisations and (with a bit of theory & a lot of opinion) try to forecast future trends. They tend to be best over the short term when things are pretty much the same from one year to the next. The consensus of forecasts are pretty useless at predicting discontinuities in trends, such as the credit crunch. At there best their forecasts at little better than the dumb forecast that next period will be the same as last period. In general the accuracy of economic forecasts is inversely proportional to their utility.

Climate models are somewhat different according to Dr MacCracken.

“In physical systems, we do have a theory—make a change and there will be a response in largely understandable and calculatable ways. Models don’t replace theory; their very structure is based on our theoretical understanding, which is why they are called theoretical models. All that the computers do is to very rapidly make the calculations in accord with their theoretical underpinnings, doing so much, much faster than scientists could with pencil and paper.”

The good doctor omits to mention some other factors. It might be the case that climate scientists have all the major components of the climate system (though clouds are a significant problems), but he omits to include measurements. The interplay of complex factors can cause unpredictable outcomes depending on timing and extent, as well as the theory. The climate models, though they have a similarity of theory and extent, come up with widely different forecasts. Even this variation is probably limited by sense-checking the outcomes and making ad hoc adjustments. If the models are basically correct then major turning points should capable of being predicted. The post 1998 stasis in temperatures, the post 2003 stability in sea temperatures and the decline in hurricanes post Katrina are all indicators that models are overly sensitive. The novelty that the models do predict tend not to be there, but the novelties that do exist are not predicted.

If it is the case that climate models are still boldly proclaiming a divergency from trend, whilst economic models have much more modest in their claims, is this not an indicator of climate model’s superiority? It would be if one could discount the various economic incentives. Economic models are funded by competing in institutions. Some are private sector, and some are public sector. For most figures there is forecast verification monthly (e.g. inflation, jobs) or quarterly (growth). If a model were consistently an outlier if would lose standing, as the forecasts are evaluated against each other. If it was more accurate then the press would quote it, being good name placement for the organisation. In the global warming forecasts, there is not even an annual variation. The incentive is either to conform, or to provide more extreme (it is worse than we thought) prognostications. If the model projected basically said “chill-out, it ain’t that bad man”, they authors would be ostracized and called deniers. At a minimum the academics would lose status and ultimately lose out on the bigger research grants.

(A more extreme example is of a major earthquake forecast. “There will not be one today” is a very accurate prediction. In the case of Tokyo area over the last 100 years that would have been wrong only twice, an accuracy of greater than 1 in 10,000).