All climate mitigation policies will be of net harm to any country implementing them. There are three reasons for this.
First, mitigation policies will not eliminate all the projected harm of climate change. Policy replaces the unmitigated cost of climate change with a policy cost and a residual climate change cost.
Second, policy proposals are only for the rich countries to reduce emissions and emerging economies to constrain the growth. That means residual climate change costs will be greater, and the burden of cost of reductions will fall on a number of countries will a minority of, and a rapidly diminishing share of, global emissions. Even with the rich nations all succeeding in the British target of 80% reduction by 2050 will still mean global emission levels higher than currently.
Third, there is mounting evidence that actual mitigation costs per tonne of CO2 equivalent saved are considerably more than the economic models assume.
Introduction
The Stern Review Summary of Conclusions stated on page vi
Using the results from formal economic models, the Review estimates that if we don’t act, the overall costs and risks of climate change will be equivalent to losing at least 5% of global GDP each year, now and forever. If a wider range of risks and impacts is taken into account, the estimates of damage could rise to 20% of GDP or more.
In contrast, the costs of action – reducing greenhouse gas emissions to avoid the worst impacts of climate change – can be limited to around 1% of global GDP each year.
The Review further stated on pages xvi-xvii
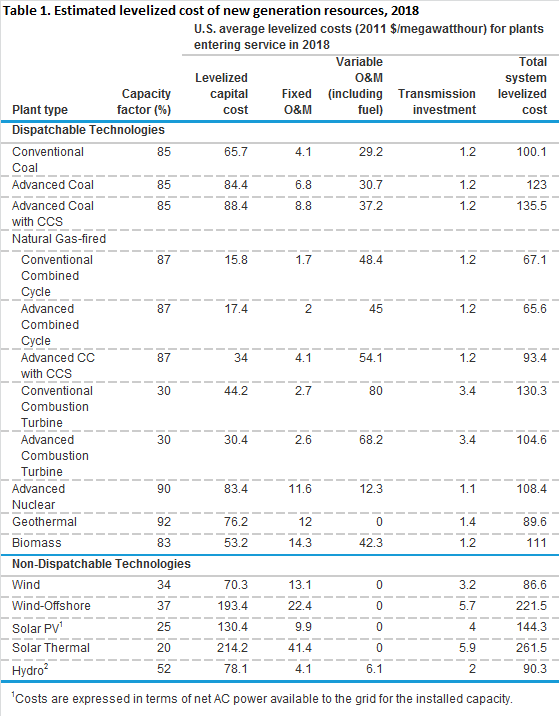
Preliminary calculations adopting the approach to valuation taken in this Review suggest that the social cost of carbon today, is of the order of $85 per tonne of CO2……. This number is well above marginal abatement costs in many sectors.
Many objections to the report look at the cost of climate change. Little discussed are the theoretical issues in implementing a successful policy. By “successful” I mean where the expected outturn of the policy is less than the projected costs of climate change.
The basic case
As the Stern review is saying that globally we should replace one set of costs – the projected costs of climate change – will the much lesser costs of climate. Graphically, we replace the climate change costs in blue with policy costs in orange. Costs are positive and benefits negative.
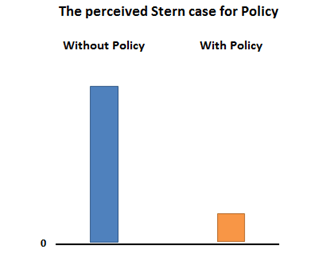
The case for policy is clear.
Climate change costs not completely eliminated
Peter Lilley, in his 2012 GWPF report “WHAT IS WRONG WITH STERN?” states on page 8
The benefit of preventing (climate change) entirely would, on his figures, be at least 5% of GDP – but to do so would require not just stopping all further carbon emissions but removing all those accumulated since the industrial revolution. The action he proposes to reduce the worst impacts of global warming by stabilising the atmospheric concentration of greenhouse gases at 550 ppm would, using Stern’s methodology, save some 3.1% of GDP – not 5%.
The mitigation policy seeks to stabilize total greenhouse gas levels are a level equivalent to about double the level of CO2 in 1780.
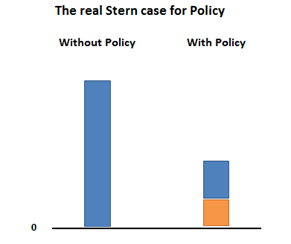
The case for policy is still clear.
Rich Countries Policy Burden
It is accepted that
- Rich countries are responsible for most of climate change.
- The adverse consequences of unmitigated climate change will be disproportionately endured by the less developed nations (LDNs).
Therefore the moral argument is that the rich countries should bear the cost of policy and they should compensate the LDNs for the future harm that they will endure. The compensation could then be used to offset the harm of climate change.
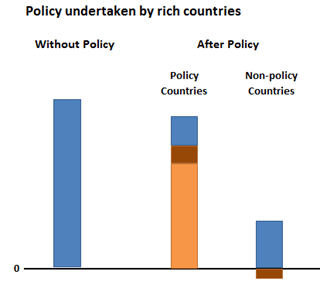
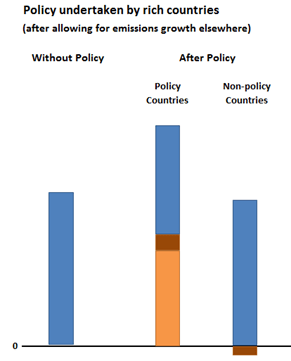
Rich countries have a smaller population than the LDNs. The policy costs (in orange) for them will more than double. Similarly, compensation (in burnt orange) will be much larger for the rich countries to pay out than for the LDNs who receive it in income. Finally the post-policy climate change costs (in blue) will be still larger for the LDNs.
The rich countries may or may not be better off after policy. Further the LDNs still suffer some harm.
Increasing Emissions amongst the emerging nations
Policy must include the emerging nations. This is why.
I have arbitrarily split the countries of the World into three groups
- ACEJU – The big industrialised carbon emitters – Australia, Canada, EU, Japan and USA.
- BICS – The large emerging nations of Brazil, India, China and South Africa.
- ROW – Rest of the World.
The World Bank has data on CO2 emissions by country for the period 1990 to 2010. From this, I compiled the following graph.
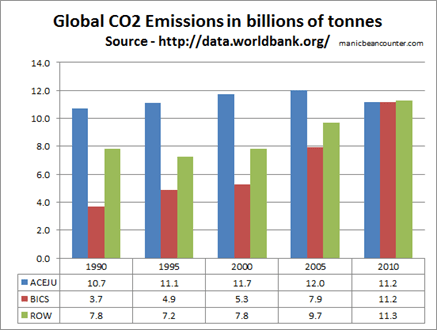
In the period 1990 to 2010, annual global CO2 emissions increased by 11.4 billion tonnes, or 51%. To return to 1990 emissions levels would require one group to cease emissions entirely and the other two groups to maintain emissions at 2010 levels. The future emissions growth path potentially makes the problem worse. Consider the comparative growth in population.
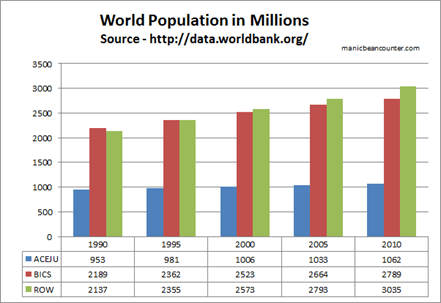
Despite the BICS countries increasing its emissions by 230%, emissions per capita are still less than 40% of those of the ACEJU block. Further, the explosive growth of the BICS has not been matched by the Rest of the World. Here the emissions have grown by 45%, but population has grown by 42%. Emissions per capita are still only 35% of those of the AJEJU block.
Any policy reductions by the rich nations will be more than offset by future emissions growth in the rest of the world. There will be little reduction in climate change costs, for either the policy countries or non-policy countries. The situation becomes like this.
The non-policy countries will still see a reduction, but that might be small, even if the policy countries are successful. The disadvantage to the policy countries is inversely related to proportion of global emissions they have at the end of the policy. That in turn is influenced by the future emissions growth in the non-policy countries, as well as the proportion of global emissions in a baseline year.
Peer-reviewed costs of Climate Change and Actual Costs of Mitigation
The Stern review should not be taken as the only source. The UNIPCC AR4 Summary for Policymakers in 2007 stated on page 22.
Peer-reviewed estimates of the social cost of carbon in 2005 average US$12 per tonne of CO2, but the range from 100 estimates is large (-$3 to $95/tCO2).
The average social cost is just a seventh of the Stern Review, which was not a study that has been peer-reviewed.
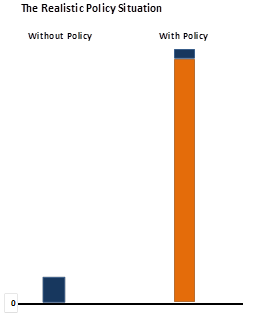
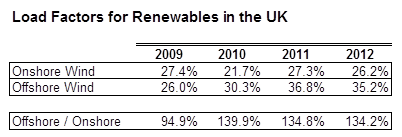
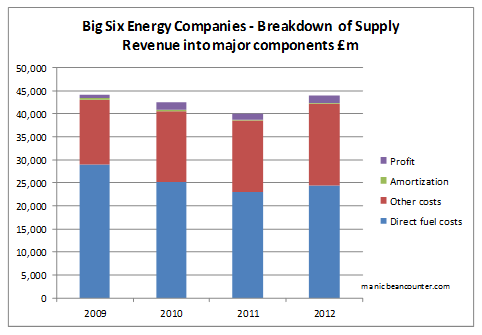
In a previous posting, I calculated that the subsidy of offshore wind farms was equivalent to 3.8 times Stern’s social cost of carbon, and 27 times that of the $12 average of peer-reviewed studies quotes by the UNIPCC. This was a low estimate, not including transmission costs. There might be cheaper ways of abating CO2, but there are lot of failed policies as well. There is also the impact on economic growth to consider, which for emerging economies. So a more realistic situation of a “successful” mitigation policy will look like the one below. That is “successful” in achieving the emission reduction targets.
Points for further investigation
There are a number of issues that are raised in my mind that need further work.
- The social cost of carbon defines the expected harm from climate change per tonne of CO2. If a country has quantitative emissions reduction targets, then an absolute upper limit in annual spend can be defined when achieving that target.
- This would enable identification of the success of policies within a national plan, along with the overall success of that plan.
-
The expected CO2 emissions growth in non-policy countries, along with including other greenhouse gas emissions within the analysis.
Conclusion
There is no combination of mitigation policies that can produce a less costly outcome than doing nothing. Any government unilaterally (or as part of group representing a minority of global emissions) pursuing such policies will be imposing net harm on its own people, no matter how large the claimed potential impacts of climate change. This conclusion can be reached even if the extreme views of the Stern Review are taken as the potential costs of climate change.
Kevin Marshall
Notes
The comparison of emissions growth between countries is derived from “The Climate Fix” by Roger Pielke Jnr. This enlarges on a comment made at Australian Climate Madness blog.
All first time comments are moderated. Please use the comments as a point of contact.
Update 25/02 17.30. Summary and “Points for further investigation” included, along with text changes
