The Climate Alarmist Reaction to a Trump Presidency

A few weeks ago cliscep had a piece Trump, climate and the future of the world that looked at the immediate reactions to the surprise victory in the US Presidential election amongst the climate community. Brad Keyes noted Jo Romm’s piece will President Trump pull the plug on a livable climate?. To support this Romm stated

Indeed, one independent firm, Lux Research, projected last week that “estimated emissions would be 16 percent higher after two terms of Trump’s policies than they would be after two terms of Clinton’s, amounting to 3.4 billion tons greater emissions over the next eight years.”

There is a little graph to sort of back this up.

Whilst Romm then states two reasons why he does not think emissions will rise so much (Trump will cause a massive recession and will not win a second term) he then states the Twitter quote:-

That said, the damage and delay that even a one-term President Trump could do will make the already difficult task of keeping total warming well below 2°C essentially impossible.

So a difference of much less than 3.4 GtCO2e over eight years will make keeping total warming well below 2°C essentially impossible.
Before looking at the evidence that contradicts this, there are even more bizarre claims made by the expert climate scientists at RealClimate. They use a different graph which is probably a couple of years old and explain:-

Here are some numbers. Carbon emissions from the United States have been dropping since the year 2000, more than on-track to meet a target for the year 2020. Perhaps with continued effort and improving technology, emissions might have dropped to below the 2020 target by 2020, let’s say to 5 gigatons of CO2 per year (5000 megatons in the plot). In actuality, now, let’s say that removing restrictions on energy inefficiency and air pollution could potentially lead to US emissions by 2020 of about 7 gigatons of CO2. This assumes that future growth in emissions followed the faster growth rates from the 1990’s.
Maybe neither of these things will happen exactly, but these scenarios give us a high-end estimate for the difference between the two, which comes to about 4 gigatons of CO2 over four years. There will also probably be extra emissions beyond 2020 due to the lost opportunity to decarbonize and streamline the energy system between now and then. Call it 4-6 gigatons of Trump CO2.
This large quantity of gas can be put into the context of what it will take to avoid the peak warming threshold agreed to in Paris. In order to avoid exceeding a very disruptive warming of 1.5 °C with 66% probability, humanity can release approximately 220 gigatons of CO2 after January, 2017 (IPCC Climate Change 2014 Synthesis report, Table 2.2, corrected for emissions since 2011). The 4-6 Gtons of Trump CO2 will not by itself put the world over this threshold. But global CO2 emission rates are now about 36 gigatons of CO2 per year, giving a time horizon of only about six years of business-as-usual (!) before we cross the line, leaving basically no time for screwing around. To reach the catastrophic 2 °C, about 1000 gigatons of CO2 remain (about 20 years of business as usual). Note that these estimates were done before global temperatures spiked since 2014 — we are currently at 1.2 °C! So these temperature boundaries may be closer than was recently thought.

RealClimate come up with nearly twice the difference made by Joe Romm / Lux Research, but at least admit in the final paragraph that whoever won would not make much difference.
There are two parts to putting these analyses into context – the US context and the global one.
In the USA emissions have indeed been falling since 2000, this despite the population growing. The rate of decline has significantly increased in the years of the Obama Presidency, but for reasons quite separate from actions to reduce emissions. First there was the credit crunch, followed by the slowest recovery in US history. Second, the high oil price encouraged emissions reductions, along with the loss of energy-intensive industries to countries with lower energy costs. Third is that the shale gas revolution has meant switching from coal to gas in electricity production.
But the global context is even more important. RealClimate does acknowledge the global figure, but only mentions CO2 emissions. The 36GtCO2 is only two-thirds of total greenhouse gas emissions of about 55GTCO2e and that figure is rising by 1-2% a year. The graph – reproduced from the USA INDC submission to the UNFCCC – clearly states that it is in million tonnes of carbon dioxide equivalent. What is more, these are vague policy proposals, that President Obama would have been unable to get through Congress. Further, most of the proposed emission reductions were through extrapolating trends that of what has been happening without any policy intervention.
If the 1.5°C limit breached from 220 GtCO2e of additional emissions, it will be breached in the run-up to Christmas 2020. The 1000 GtCO2e for the 2°C limit was from 2011. By simple arithmetic it is now below 800GtCO2e with about 15 years remaining if (a) a doubling of CO2 levels (or equivalent GHG gases) leads to 3°C of warming (b) the estimated quantity of emissions to a unit rise in atmospheric gas levels is correct and (b) the GHG gas emitted is retained for a very long period in the atmosphere.
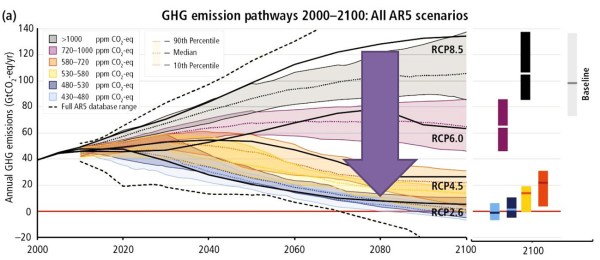
Even simple arithmetic is not required. Prior to the Paris talks the UNFCCC combined all the INDCs – including that of the USA to cut emissions as shown in the graph above – were globally aggregated and compared to the approximate emissions pathways for 1.5°C and least-cost 2°C warming. The updated version, post-Paris is below.

The difference Donald Trump will make is somewhere in the thickness of the thick yellow line. There is no prospect of the aimed-for blue emissions pathways. No amount of ranting or protests at the President-elect Trump will change the insignificant difference the United States will make with any politically-acceptable and workable set of policies, nor can make in a country with less than a twentieth of the global population and less that one seventh of global emissions.

Kevin Marshall

Update on a Global Carbon Tax

In a previous post I looked a statement made by Richard Tol in his recent paper The Structure of the Climate Debate

Only a modest carbon tax is needed to keep atmospheric concentrations below a high target but the required tax rapidly increases with the stringency of the target. If concentrations are to be kept below 450 ppm CO2eq, the global carbon tax should reach some $210/tCO2 in 2020 or so (Tol 2013).

Tol, to his credit, replied to me (and others) in the cliscep comments. In particular

Note that these climate policies consist of two components: An initial carbon tax, and its rate of increase (4-6% a year).

The $210 carbon tax in 2020 is just a starting point. With a 5% escalation, it would double every 14 years making the carbon tax $910 in 2050, $3070 in 2075 and $10,400 in 2100. The escalator is the far more important aspect in reducing demand for fossil fuels through a combination of reducing energy use and switching to more expensive (and often less convenient) renewable sources. The escalator was not clear in the original article, and Richard Tol has agreed to make a correction.

Consider again just imposing a fixed $210 carbon tax. From the British perspective the additional tax on petrol (gasoline), with 20% VAT applied, is equivalent to 47p a litre added to the retail price. The tax is already nearly 70p a litre, so unlikely to have the impact on motorists of reducing their consumption by 90% or more. Even with the tax at 200p a litre implied by a $910 t/CO2 tax (making petrol £3.13 a litre) may not achieve this objective. For a car doing 15000 miles at 39mpg, this would generate an additional cost to the owner of £3500 per year. It would still be less than the depreciation on a family car averaged over the first three years. It might also be less than the full costs of converting to electric cars, particularly if the roll-out was not subsidized on the purchase cost and provision of charging points. Within the UK, the carbon tax would also replace the current renewables policy. Here the escalator would really hit home. For coal-fired power stations producing 400kg CO2 per megawatt hour, the carbon tax would be £70Mwh in 2020 and £300Mwh in 2050. Gas-fired power stations would have a tax of about half that level. Even wind turbines, backed by massive pump-storage schemes would be much cheaper. Nuclear power would be the cheapest alternative of all. But British voters are hardly going to keep on voting for a Government that imposes real increases in taxes of five percent a year until they become unaffordable except for the very rich.

However, it is from the global perspective that the cost of the carbon tax really hits home. In another comment Tol says

The big worry for climate policy, studiously avoided by the majority of its advocates, is that you need lots of cheap energy in the early stages of economic development.

It is worth stating again that a Global Carbon Tax needs to be Global to achieve the desired objectives. From the UNIPCC AR5 Synthesis Report Summary for Policy Makers is graphic SPM11(a). This shows the non-policy or Business as Usual RCP8.5 scenario, where emissions in 2100 are projected to be over 2.5 times the level of 2010. The 2C warming target is the RCP2.6 scenario. I have inserted a big arrow to show the difference that the global carbon tax needs to make. It can be demonstrated that most of the emissions growth will come from the developing countries, following the pattern from at least 1990.


The scale of the harm of policy is by assuming that the $210 carbon tax is applied without any change in demand at all, using the estimated CO2 emissions from fossil fuels for 2013 from CDIAC and the IMF 2015 GDP figures for ballpark estimates.
Global CO2 emissions from fossil fuels were about 33.8 billion tonnes (two-thirds of total GHG emissions). A $210 carbon tax without any effect on demand would thus generate $7100 bn. This represents nearly 10% of global GBP of $73500bn. If we assume 2% emissions growth and 3% economic growth, then the carbon tax would represent 9.6% of GDP in 2020 without any drop in emissions.
Here is the same calculation for selected countries using 2013 emissions and GDP data.

30-33% Iran, Russia, South Africa
19-20% India, China
16-18% Thailand, Malaysia, Vietnam
11-14% Poland, Czech Republic, Pakistan, Egypt, Indonesia.
7% Bangladesh, Philippines
6-7% USA, Japan, Canada, Australia
4-5% Spain. Germany, Nigeria
UK 3.4% France 2.9%

The highest tax rates are a result of inefficient economic systems. Iran has subsidised petrol, effectively a negative carbon tax. South Africa’s high emissions are as a result of apartheid. Oil embargoes caused it to convert coal to liquids, a process that generates 4-5 times the CO2 of burning coal alone. Russia, in common with its neighbours, still has the legacy of the economically-inefficient communism.
The carbon tax would also be high as a proportion of GDP for the rapidly emerging economies. It highlights the Tol’s comment about needing lots of cheap energy in the early stages of economic development. With higher fossil fuel emissions per $1000 of GDP the impact on output would be relatively greater in the emerging economies than in the OECD. A globally uniform carbon tax would end up transferring back some manufacturing back to the more energy efficient economies, slowing economic growth and thus emissions growth.
More importantly, emerging countries have large parts of the population with very low energy consumption. Even those with access to gas and electricity have much lower energy consumption than is typical in the West, whether from heating, air conditioning, cooking, or private transport. Pushing up the cost of energy will massively slow down the spread of consumerism and consequent improvements in living standards.

Three years ago I looked at the takeaway policy quote from the Stern Review.

Using the results from formal economic models, the Review estimates that if we don’t act, the overall costs and risks of climate change will be equivalent to losing at least 5% of global GDP each year, now and forever. If a wider range of risks and impacts is taken into account, the estimates of damage could rise to 20% of GDP or more. In contrast, the costs of action – reducing greenhouse gas emissions to avoid the worst impacts of climate change – can be limited to around 1% of global GDP each year.

I largely agree with Richard Tol when he states that a carbon tax is the optimal policy in terms of maximum effect for minimum cost, at least with respect to fossil fuel emissions. Yet a high, and rapidly increasing, carbon tax would cost far more than 1% of global GDP each year, even if the additional tax revenue was spent efficiently and/or used to reduce other taxes. But the most pernicious effects would be felt in the effects on long-term economic growth – the very growth that is moving billions of people out of poverty towards the far better living standards we enjoy in the Western World. The  carbon tax does not present a feasible policy even in theory to achieve the objectives desired. Yet is, in theory, the best policy available.

Kevin Marshall

Results of Sea-Level Rise Extremism in Miami-Dade

A couple of years ago I posted* in response to a post on sea level rise at The Conversation

A senior geology professor in Miami, who also chairs the science committee for the Miami-Dade Climate Change Advisory Task Force, has views on future sea level rise that are way more extreme than the available evidence.

My Summary started

The claim by Professor Wanless at the Conversation that sea levels could rise by 1.25 to 2m by 2100 is way too extreme it is based on top-slicing the estimates on a NOAA 2012 report. The top-end estimates were not included by the UNIPCC in its AR5 Sept 2013 report. In fact, the UNIPCC report stated it had low-confidence in estimates of sea level rise above its top-end 0.82m.

The Task Force has now concluded. The Miami-Dade Climate Change website states

The Sea Level Rise Task Force, formed in July 2013, developed several important recommendations, which are being implemented in Miami-Dade County. The Task Force reviewed relevant data and prior studies and reports regarding the potential impact of sea level rise on public services and facilities, real estate, water and other ecological resources, and property and infrastructure.

The Introduction to the extensive report report states (with conversions into mm inserted):-

Since reliable record keeping began over 100 years ago at the tide gauge in Key West, the average sea level has risen approximately 228 millimeters (or 9 inches). This rise has been primarily due to thermal expansion (as warmer water occupies more volume) and to melting from glaciers and ice sheets. Over the next century, the rate of sea level rise is very likely to accelerate due to increased melting from land-based ice sheets, in particular Greenland. Recognizing the need for clear, consistent, and local information about future sea level rise projections, The Southeast Florida Regional Climate Change Compact developed the, “Unified Sea Level Rise Projection for Southeast Florida”. The updated projection, published in 2015, was developed by a panel of well-respected and informed scientists using the most recent and best available data. The projection (Figure 1) estimates that the region can expect to see average sea levels 6 to 10 inches (150 to 205 mm) higher by 2030 than they were in 1992, 14 to 34 inches (355 to 860 mm) higher by 2060, and 31 to 81 inches higher (790 to 2060 mm) by 2100. There is a more certain estimate for near-term changes and a greater uncertainty for estimates at the end of this century. This change in average sea levels will amplify the risks of storm surge and nuisance flooding.

This implies a massive acceleration in the rate of sea level-rise. In the last couple of years the rate of sea level rise has indeed accelerated. The NOAA data now shows a rate of 237 mm a century, by from 228 mm when the report was written. It is likely a blip and well with the margin of error.

To see how much sea level rise will have to accelerate to meet the forecasts, I will assume that from 1992 to 2015 the sea levels rose by 60 mm (2.4 inches) or 2.6 mm a year.

From 2016 to 2030 sea levels will need to rise by 6 to 10 mm a year on average, or about three or four times the current rate.

From 2016 to 2060 sea levels will need to rise by 8.5 to 23 mm a year on average, or about three or nine times the current rate.

From 2016 to 2100 sea levels will need to rise by 8.5 to 23.5 mm a year on average, or about three or nine times the current rate.

The impact of Professor Wanless on the Committee’s output should be clearly seen. A straight line forecast would be a 8 to 9 inch sea level rise by 2100. Many of the recommendations for planning will be based on a 2 foot 6 inch rise to a 6 foot 6 inch rise. Any reasonable person should take a measure to the Miami-Dade area – which is very low-lying and imagine the difference between a dyke 12 inches high and a dyke seven feet high along the Miami sea front.

Alternatively imagine the effect on property prices in Miami-Dade (2.6 million) and on neighbouring Broward and Palm Beach (3.1 million) if people really swallowed this whole. The tiny community of Fairbourne (724 people) in West Wales have had their properties made virtually value-less by a Welsh Government report and the alarmist reporting by the BBC.

*Thanks to Paul Homewood for a reminder to update my earlier post in his look at false alarmism on sea level rise in the Thames Estuary.

Kevin Marshall