There has been no statistically significant warming for at least 15 years. Yet some people, like commentator “Michael the Realist”, who is currently trolling Joanne Nova’s blog, are claiming otherwise. His full claims are as follows
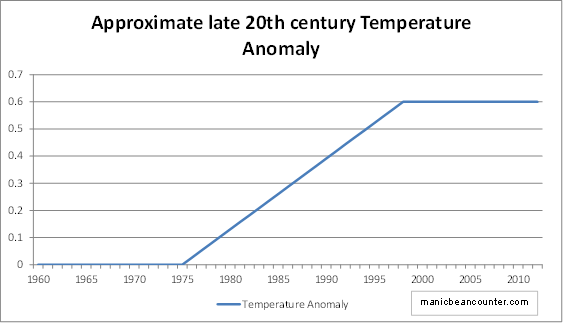
Again look at the following graph.
Now let me explain it to the nth degree.
# The long term trend over the whole period is obviously up.
# The long term trend has pauses and dips due to natural variations but the trend is unchanged.
# The current period is at the top of the trend.
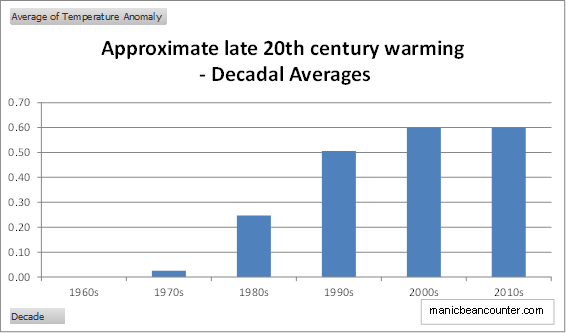
# 2001 to 2010 is the hottest decade on the record despite a preponderance of natural cooling trends. (globally, ocean, land and both hemispheres)
# Hotter than the previous decade of 1991 to 2000 with its preponderance of natural warming events.
# Every decade bar one has been hotter than the previous decade since 1901.
Please explain why the above is true if not AGW with proof.
The claims against the warming standstill I will deal with in a later posting. Here I will look at whether the argument proves, beyond reasonable doubt, that AGW exists and is significant.
There might be a temperature series, but there is no data on greenhouse gases. There is data on the outcome, but there is no presentation of data on the alleged cause. It is like a prosecution conducting a murder trial with a dead body, with the cause of death not established, and no evidence presented linking the accused to the death. I will have to fill this bit in. The alleged cause of most of the twentieth century global warming is human greenhouse gas emissions. The primary greenhouse gas emission is CO2. First I will compare estimated global CO2 emissions with the warming trend. Second, I then show evidence that the twentieth century warming is nothing exceptional.
The relationship of CO2 emissions to average temperature is weak
Some time ago I downloaded estimates of national CO2 emissions data from what is now the CDIAC website, then in filled my own estimates for all major countries where there were data gaps, using the patterns of other countries and my knowledge of economic history. This shows steady growth up to 1945 (with dips in WW1, the Great Depression and at the end of WW2) The post war economic boom, the 1973 oil crisis, the recession of 1980-81 and the credit crunch of 2008 are clearly visible. It therefore seems reasonable and not too dissimilar from the increase in atmospheric CO2 levels.
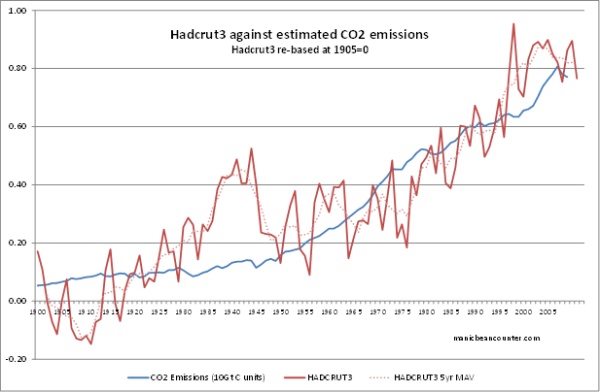
I have charted the growth in human CO2 emissions against the HADCRUT3 data, putting them on a comparative scale. The 5 year moving average temperature increased by around 0.5oC between 1910 and 1944 and 0.6oC between 1977 and 2004. In the former period, estimated CO2 emissions increased from 0.8 to 1.4 giga tonnes. In the latter period, estimated CO2 emissions increased from 4.9 to 7.4 giga tonnes. The period in between the 5 year moving average temperature decreased very slightly and CO2 emissions increased from 1.4 to 4.9 giga tonnes. 1945 and the late 1998 have two things in common – the start of a stall in average surface temperature increases and an acceleration in the CO2 emission rate of increase. On the face of it, in so far as there is a relationship between CO2 emissions and temperature, it seems to be a pretty weak one.
The longer view
The case for claiming human emissions affect temperature is even weaker if you take a longer perspective. Human CO2 emissions were negligable before the industrial revolution, yet there is plenty of evidence that temperatures have shown larger fluctuations in last couple of millennia. Four example are Law Dome, Esper et al 2012, Gergis et al 2012 and the CO2 Science website.
This Law Dome ice cores are the highest quality ice cores in Antarctica.
There seems to be no warming there at all. With 75% of the global ice packs in Antarctica it is fortunate that there is nothing exceptional about Antarctica warming. But maybe the Arctic is different.
Esper et al 2012, published in Nature, has the following Summer temperature reconstruction for Northern Scandinavia over two millennia.
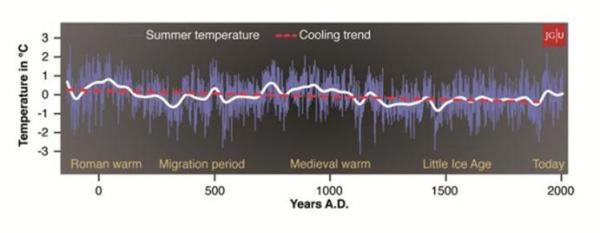
There is a twentieth century uptick, but only in the context of a long term cooling trend.
Focussing on the last 130 years shows something at odds with the global position.
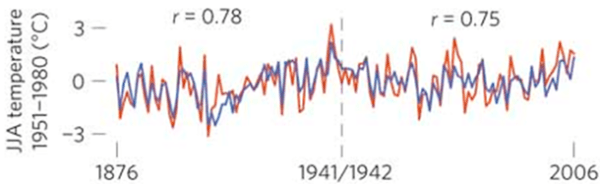
The highest temperatures were in the 1930s, just like the record temperatures in the USA. The warming trend from the mid-1970s is still far greater than the global averages, but less than the warming trends in the early twentieth century. It corroborates data that shows recent warming trends are higher in the Arctic than the global average, but also shows claims that there is nothing significant in these trends.
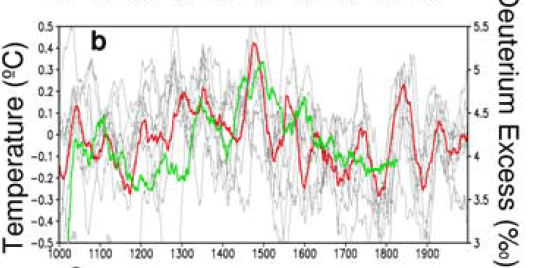
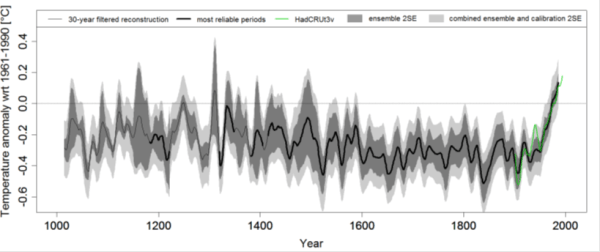
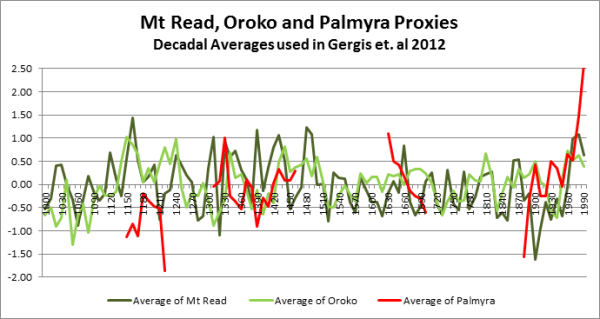
I find the most convincing evidence is from the withdrawn Gergis 2012 temperature reconstruction for the combined land and oceanic region of Australasia (0°S-50°S, 110°E-180°E). This is because it set out with the aim of showing the opposite – that the recent warming was much more significant than anything in the last millennium. Despite breaking their own selection rules for proxies, they managed to only demonstrate that the last decade of the last millennium the warmest by the narrowest of margins. See below.
There are many reasons to reject the paper (see here), but one significant point can be illustrated. There were only three reconstructions had any data prior to 1430. There were two tree ring studies from New Zealand, and coral study from Palmyra Atoll. Plotting the decadal averages shows that the erratic Palmyra data suppresses the medieval period and exaggerates the late twentieth century warming. Further, Palmyra Atoll is over 2000 km outside the study area.
Finally, CO2Science.org specialises in accumulating evidence of the impacts of CO2. It also has a database of studies on the medieval warm period. There is a graph that summarizes the quantitative studies
Figure Description: The distribution, in 0.5°C increments, of Level 1 Studies that allow one
to identify the degree by which peak Medieval Warm Period temperatures either exceeded
(positive values, red) or fell short of (negative values, blue) peak Current Warm Period
temperatures.
In conclusion, on the face of it, there is very weak support for human emissions being the cause of most of the warming in the last century by the fact that changes in human emissions do not appear to move in line with changes in temperature. The case is further weakened by evidence that at times in the last 2000 years were warmer than in the current period. It does not discount the possibility that human emissions are responsible for some of the warming. But demonstrating that empirically would mean understanding and accurately measuring the full extent of the natural processes, then demonstrating that these were not operating as strongly as in previous epochs. By definition, the evidence will be more circumstantial than if there was a direct correlation. Furthermore, the larger the actual human impact the more circumstantial will be the evidence.