President Trumps Tweet on record cold in New York and Temperature Data

As Record-breaking winter weather grips North-Eastern USA (and much of Canada as well) President Donald Trump has caused quite a stir with his latest Tweet.

There is nothing new in the current President’s tweets causing controversy. This is a hard-hitting one has highlights a point of real significance for AGW theory. After decades of human-caused global warming, record cold temperatures are more significant than record warm temperatures. Record cold can be accommodated within the AGW paradigm by claiming greater variability in climate resultant on the warming. This would be a portent of the whole climate system being thrown into chaos once some tipping point had been breached. But that would also require that warm records are
(a) far more numerous than cold records and
(b) Many new warm records outstrip the old records of a few decades ago by a greater amount than the rise in average temperatures in that area.
I will illustrate with three temperature data sets I looked at a couple of years ago – Reykjavík, Iceland and Isfjord Radio and Svalbard Airport on Svalbard.

Suppose there had been an extremely high and an extremely low temperature in 2009 in Reykjavík. For the extreme high temperature to be a record it would only have to be nominally higher than a record set in 1940 to be a new record. The unadjusted average anomaly data is the same. If the previous record had been set in say 1990, a new high record would only be confirmation of more extreme climate if it was at least 1C higher than the previous record. But a new cold record in 2009 could be up to 1C higher than a 1990 low record to count as greater climate extremes. Similarly in the case of Svalbard Airport, new warm records in 2008 or 2009 would need to be over 4C higher than records set around 1980, and new cold records would need to be up to 4C higher than records set around 1980 to count as effective new warm and cold records.
By rebasing in terms of unadjusted anomaly data (and looking at monthly data) a very large number of possible records could be generated from one temperature station. With thousands of temperature stations with long records, it is possible to generate a huge number of “records” to analyze if the temperatures are becoming more extreme. But absolute record cold records should be few and far between. However, if relative cold records outstrip relative warm records, then there are questions to be asked of the average data. Similarly, if there were a lack of absolute records or a decreasing frequency of relative records, then the beliefs in impending climate chaos would be undermined.

I would not want to jump ahead with the conclusions. The most important element is to mine the temperature data and then analyze the results in multiple ways. There are likely to be surprises that could enhance understanding of climate in quite novel ways.

Kevin Marshall

Climate Public Nuisance as a justification for Climate Mitigation

Ron Clutz, at his Science Matters blog, has a penchant for producing some interesting articles that open up new areas outside of the mainstream of either climate alarmism or climate scepticism, some of which may challenge my own perspectives. With Critical climate intelligence for jurists and others, Ron has done this again.
There is a lot of ground covered here, and I am sure that it just touches on a few of the many issues. The first area covered is the tort of Public Nuisance, explained by legal scholar Richard O. Faulk. This touches upon areas that I have dealt with recently, particularly this section. (bold mine)

Generally in tort cases involving public nuisance, there is a term, which we all know from negligence cases and other torts, called proximate causation. In proximate causation, there is a “but for” test: but for the defendant’s activity, would the injury have happened? Can we say that climate change would not have happened if these power plants, these isolated five power plants, were not emitting greenhouse gases? If they completely stopped, would we still have global warming? If you shut them down completely and have them completely dismantled, would we still have global warming? 

I think Faulk then goes off the argument when he states.

Is it really their emissions that are causing this, or is it the other billions and billions of things on the planet that caused global warming—such as volcanoes? Such as gases being naturally released through earth actions, through off-gassing?

Is it the refinery down in Texas instead? Is it the elephant on the grasses in Africa? Is it my cows on my ranch in Texas who emit methane every day from their digestive systems? How can we characterize the public utilities’ actions as “but for” causes or “substantial contributions?” So far, the courts haven’t even reached these issues on the merits.

A necessary (but not sufficient) condition to be met for adverse human-caused global warming to be abated, is that most, if not all, human GHG emissions must be stopped. Unlike with smoke particulates, where elimination in the local area will make a big difference, GHGs are well-mixed. So shutting down a coal-fired power station in Oak Creek will have the same impact on the future climate change for people of South-East Wisconsin as shutting down a similar coal-fired power station in Boxburg, Ningxia, Mpumalanga, Kolkata or Porto do Pecém. That is in the range of zero or insignificantly different to zero depending on your perspective on CAGW.

Proximate causation was a term that I should have used to counter Minnesotan valve-turners climate necessity defense. As I noted in that post, to reduce global emissions by the amount desired by the UNIPCC – constraining future emissions to well below 1000 GtCO2e, requires not only reducing the demand for fossil fuels and other sources of GHG emissions, but also requires many countries dependent on the supply of fossil fuels for a large part of their national incomes, to leave at least 75% of known fossil fuel reserves in the ground.

An example of proximate causation to be found in the post of 27 December Judge delivers crushing blow to Washington Clean Air RuleGovernor Inslee called the legislation “the nation’s first Clean Air Rule, to cap and reduce carbon pollution.” But the legislation will only reduce so-called carbon pollution if the reduction is greater than the net increase in other areas of the world. The will not happen as both demand and supply are not covered by global agreements with the aggregate impact

Kevin Marshall

Thomas Fuller on polar-bear-gate at Cliscep

This is an extended version of a comment made at Thomas Fuller’s cliscep article Okay, just one more post on polar-bear-gate… I promise…

There are three things highlighted in the post and the comments that illustrate the Polar Bear smear paper as being a rich resource towards understanding the worst of climate alarmism.

First is from Alan Kendall @ 28 Dec 17 at 9:35 am

But what Harvey et al. ignores is that Susan Crockford meticulously quotes from the “approved canon of polar bear research” and exhorts her readers to read it (making an offer to provide copies of papers difficult to obtain). She provides an entree into that canon- an entree obviously used by many and probably to the fury of polar bear “experts”.

This is spot on about Susan Crockford, and, in my opinion, what proper academics should be aiming at. To assess an area where widely different perspectives are possible, I was taught that it is necessary to read and evaluate the original documents. Climate alarmists in general, and this paper in particular, evaluate in relation collective opinion as opposed to more objective criteria. In the paper, “science” is about support for a partly fictional consensus, “denial” is seeking to undermine that fiction. On polar bears this is clearly stated in relation to the two groups of blogs.

We found a clear separation between the 45 science-based blogs and the 45 science-denier blogs. The two groups took diametrically opposite positions on the “scientific uncertainty” frame—specifically regarding the threats posed by AGW to polar bears and their Arctic-ice habitat. Scientific blogs provided convincing evidence that AGW poses a threat to both, whereas most denier blogs did not.

A key element is to frame statements in terms of polar extremes.

Second, is the extremely selective use of the data (or selective analysis methods) to enable the desired conclusion to be reached. Thomas Fuller has clearly pointed out in the article and restated in the comments with respect to WUWT, the following.

Harvey and his 13 co-authors state that WUWT overwhelmingly links to Crockford. I have shown that this is not the case.

Selective use of data (or selective analysis methods) is common on climate alarmism. For instance

  • The original MBH 98 Hockey-Stick graph used out-of-date temperature series, or tree-ring proxies such as at Gaspe in Canada, that were not replicated by later samples.
  • Other temperature reconstructions. Remember Keith Briffa’s Yamal reconstruction, which relied on one tree for the post-1990 reconstructions? (see here and here)
  • Lewandowsky et al “Moon Hoax” paper. Just 10 out of 1145 survey respondents supported the “NASA faked the Moon Landings” conspiracy theory. Of these just 2 dogmatically rejected “climate”. These two faked/scam/rogue respondents 860 & 889 supported every conspiracy theory, underpinning many of the correlations.
  • Smoothing out the pause in warming in Risbey, Lewandowsky et al 2014 “Well-estimated global surface warming in climate projections selected for ENSO phase”. In The Lewandowsky Smooth, I replicated the key features of the temperature graph in Excel, showing how no warming for a decade in Hadcrut4 was made to appear as if there was hardly a cessation of warming.

Third, is to frame the argument in terms of polar extremes. Richard S J Tol @ 28 Dec 17 at 7:13 am

And somehow the information in those 83 posts was turned into a short sequence of zeros and ones.

Not only one many issues is there a vast number of intermediate positions possible (the middle ground), there are other dimensions. One is the strength of evidential support for a particular perspective. There could be little or no persuasive evidence. Another is whether there is support for alternative perspectives. For instance, although sea ice data is lacking for the early twentieth-century warming, average temperature data is available for the Arctic. NASA Gistemp (despite its clear biases) has estimates for 64N-90N.

The temperature data seems to clearly indicate that all of the decline in Arctic sea ice from 1979 is unlikely to be attributed to AGW. From the 1880s to 1940 there was a similar magnitude of Arctic warming as from 1979 t0 2010 with cooling in between. Yet the rate of increase in GHG levels was greater from greater in 1975-2010 than 1945-1975, which was in turn greater than the period decades before.

Kevin Marshall


Russian Brexit Influence on Social Media a Loser’s Conspiracy Theory

A few weeks ago there emerged a new conspiracy theory about the Russians have funded a massive pro-Leave social media campaign. I part-prepared a post backing one at Cliscep emphasizing how ridiculous the so-called evidence was for these claims. Last week Facebook announced that the Russian Internet Research Agency had spent a grand total of $1 (73p) on six adverts and Twitter revealed that a total of $1,031.99 had been spent on six referendum-related ads during the campaign.

There are two parts to this post.

  1. Russian Social Media impact on Brexit in context of the wider campaign
  2. The circumstantial evidence that social media was likely to have had a bigger influence on the Remain vote than on the Leave vote.


Russian Social Media impact on Brexit in context of the wider campaign

The evidence for the success of the Russians on Twitter in influencing the Brexit result needs to be viewed in the wider context.

First is to check the data in support of the argument. As Geoff Chambers pointed out @ 

Second is to look at the other tweets. The bot accounts were not the only source of tweets supporting Brexit. Further, there were quite a lot of tweets in the support of Remain.

Third, is that there are other sources of news/information/propaganda in support of both sides in the campaign. What about the official campaigns? Or the support of international political leaders or International Organisations (e.g. IMF, EU) or businesses? Would a majority of the British public really prefer the opinions of a Twitter Bot over those of President Barak Obama, Chancellor Angela Merkel, Prime Minister David Cameron, the British Treasury, celebrities like St. Bob Geldof, the majority of British MP’s or most British businesses?


Which side of the EU Referendum did social media influence more?

It is very difficult to tell the actual influence of social media on the vote, but there is strong circumstantial evidence that the influence will have been more towards increasing Remain vote rather than the Leave.

First is from the age spread of the vote. I believe that Twitter and other social media use is inversely related to age. Therefore, one would expect that if there had been undue influence, the young would have voted more for Brexit than the older folks. Lord Ashcroft’s Polls surveyed 12,369 on EU Referendum day and published on 24th June under “How the United Kingdom voted on Thursday… and why“.  73% of 18-24 year olds and 62% of 25-34 year olds voted to remain in the EU. It would suggest that the Leave campaign as a whole failed to reach the Twitterati.

From How the United Kingdom voted on Thursday… and why, is the following split by age band.

Second I believe that due to its transitory nature, social media is more likely to have had a bigger influence on in those who made up their mind at the last moment, than those who voted as a reflection of long-held beliefs. But whilst 25% of Remain voters decided in the last week, just 22% of Leave voters did so. So either social media made a bigger influence on the Remain vote, or it had no significant difference at all.

Third evidence that runs counter to a Russian influence through Twitter on the Brexit vote is in the geographical distribution of the Brexit vote. In England and Wales the constituencies that voted most strongly Remain were in inner cities, particularly London, Manchester and Liverpool. The strongest pro-Leave votes were widely spread. But the many of the extreme pro-Leave constituencies in the traditional Labour heartlands in the North of England and South Wales.

I live in Manchester. This encapsulates the divide. The City of Manchester has some of the most pro-Remain constituencies in the country, whilst much of the rest of Greater Manchester was pro-Leave. But as the City of Manchester folks has the most vocal people in the region, along with the most vocal twitterati, it would seem that Greater Manchester is full of Remainers. The estimated vote by constituency gives a quite different picture.

The Leave constituencies are on the margins of Greater Manchester and form the big majority. But the most vocal opinion formers are in central Manchester. Similarly, the most vocal activists nationally are those in London, along with the University Cities of Oxford, Cambridge, and Bristol.  Brighton and Manchester are also other centers of activism.

Following the EU Referendum, there was a major online petition to Parliament that wanted to nullify the result by having a 2nd Referendum on different rules.The petition was dominated by those in London and other centers of activism. This was a petition map extract of 00.30 26/06/16.

These same centres of activism dominated the “Prevent Donald Trump making a State Visit” petition at the beginning of this year. Compare the spread of petition numbers by political constituency with the rival petition supporting the state visit. The pale orange areas have proportionately very low numbers of signatories. The red areas have proportionately high numbers. The “Prevents” are mostly in the cities, the “Supports” have a much more even geographical spread.


Concluding Comments

The claims that Russian-sponsored social media presence helping tip the scales towards a Brexit vote does not stand up to scrutiny. The actual evidence of spending on social media is negligible; the other forms of media and major leaders were predominantly pro-Remain; the demographics of social media users are very much in line with Remain voters; and online activists are dominated by City-based virulently pro-EU types. The continued Russian conspiracy theory is predominantly from a bunch losers who cannot recognize that most people have different views from their own.

Kevin Marshall 

Evidence for the Stupidest Paper Ever

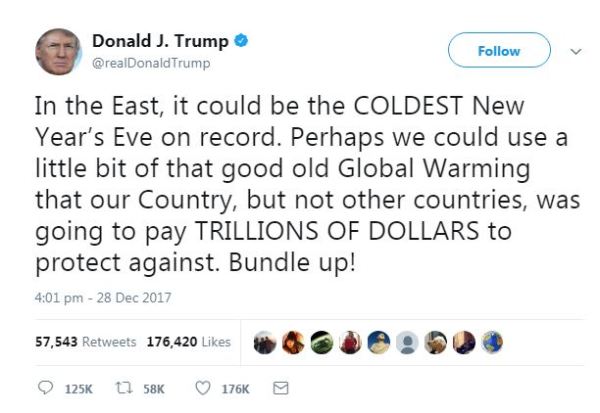
Judith Curry tweeted a few days ago

This is absolutely the stupidest paper I have ever seen published.

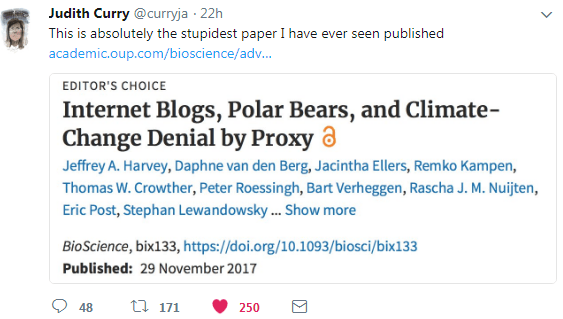
What might cause Judith Curry to make such a statement about Internet Blogs, Polar Bears, and Climate-Change Denial by Proxy? Below are some notes that illustrate what might be considered stupidity.

Warmest years are not sufficient evidence of a warming trend

The US National Oceanic and Atmospheric Administration (NOAA) and National Aeronautics and Space Administration (NASA) both recently reported that 2016 was the warmest year on record (Potter et al. 2016), followed by 2015 and 2014. Currently, 2017 is on track to be the second warmest year after 2016. 

The theory is that rising greenhouse gas levels are leading to warming. The major greenhouse gas is CO2, supposedly accounting for about 75% of the impact. There should, therefore, be a clear relationship between the rising CO2 levels and rising temperatures. The form that the relationship should take is that an accelerating rise in CO2 levels will lead to an accelerating rate of increase in global average temperatures. Earlier this year I graphed the rate of change in CO2 levels from the Mauna Loa data.

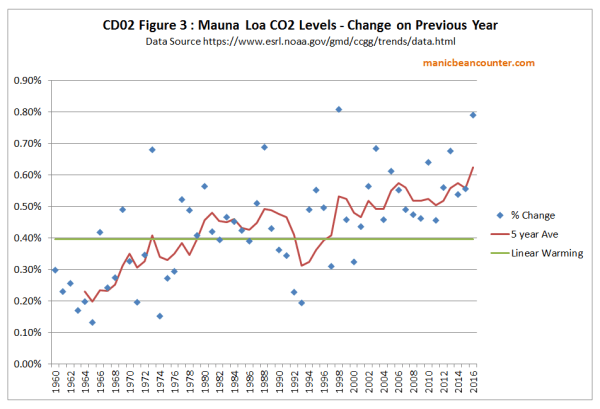
The trend over nearly sixty years should be an accelerating trend. Depending on which temperature dataset you use, around the turn of the century warming either stopped or dramatically slowed until 2014. A strong El Nino caused a sharp spike in the last two or three years. The data contradicts the theory in the very period when the signal should be strongest.

Only the stupid would see record global average temperatures (which were rising well before the rise in CO2 was significant) as strong evidence of human influence when a little understanding of theory would show the data contradicts that influence.

Misrepresentation of Consensus Studies

The vast majority of scientists agree that most of the warming since the Industrial Revolution is explained by rising atmospheric greenhouse gas (GHG) concentrations (Doran and Zimmerman 2009, Cook et al. 2013, Stenhouse et al. 2014, Carlton et al 2015, Verheggen et al. 2015), 

Doran and Zimmerman 2009 asked two questions

1. When compared with pre-1800s levels, do you think that mean global temperatures have generally risen, fallen, or remained relatively constant?

2. Do you think human activity is a significant contributing factor in changing mean global temperatures?

Believing that human activity is a significant contributing factor to rising global temperatures does not mean one believes the majority of warming is due to rising GHG concentrations. Only the stupid would fail to see the difference. Further, the results were a subset of all scientists, namely geoscientists. The reported 97% consensus was from a just 79 responses, a small subset of the total 3146 responses. Read the original to find out why.

The abstract to Cook et al. 2013 begins

We analyze the evolution of the scientific consensus on anthropogenic global warming (AGW) in the peer-reviewed scientific literature, examining 11 944 climate abstracts from 1991–2011 matching the topics ‘global climate change’ or ‘global warming’. We find that 66.4% of abstracts expressed no position on AGW, 32.6% endorsed AGW, 0.7% rejected AGW and 0.3% were uncertain about the cause of global warming. Among abstracts expressing a position on AGW, 97.1% endorsed the consensus position that humans are causing global warming. 

Expressing a position does not mean a belief. It could be an assumption. The papers were not necessarily by scientists, but merely authors of academic papers that involved the topics ‘global climate change’ or ‘global warming’. Jose Duarte listed some of the papers that were included in the survey, along with looking at some that were left out. It shows a high level of stupidity to use these flawed surveys as supporting the statement “The vast majority of scientists agree that most of the warming since the Industrial Revolution is explained by rising atmospheric greenhouse gas (GHG) concentrations“.

Belief is not Scientific Evidence

The most recent edition of climate bible from the UNIPCC states (AR5 WG1 Ch10 Page 869)

It is extremely likely that human activities caused more than half of the observed increase in GMST from 1951 to 2010.

Mispresenting surveys about beliefs are necessary because the real world data, even when that data is a deeply flawed statisticdoes not support the belief that “most of the warming since the Industrial Revolution is explained by rising atmospheric greenhouse gas (GHG) concentrations“.  

Even if the survey data supported the statement, the authors are substituting banal statements about beliefs for empirically-based scientific statements. This is the opposite direction to achieving science-based understanding. 

The false Consensus Gap

The article states

This chasm between public opinion and scientific agreement on AGW is now commonly referred to as the consensus gap (Lewandowsky et al. 2013)

Later is stated, in relation to sceptical blogs

Despite the growing evidence in support of AGW, these blogs continue to aggressively deny the causes and/or the projected effects of AGW and to personally attack scientists who publish peer-reviewed research in the field with the aim of fomenting doubt to maintain the consensus gap.

There is no reference that tracks the growing evidence in support of AGW. From WUWT (and other blogs) there has been a lot of debunking of the claims of the signs of climate apocalypse such as

  • Malaria increasing as a result of warming
  • Accelerating polar ice melt / sea level rise
  • Disappearing snows of Kilimanjaro due to warming
  • Kiribati and the Maldives disappearing due to sea level rise
  • Mass species extinction
  • Himalayan glaciers disappearing
  • The surface temperature record being a true and fair estimate of real warming
  • Climate models consistently over-estimating warming

The to the extent that a consensus gap exists it is between the consensus beliefs of the climate alarmist community and actual data. Scientific support from claims about the real world come from conjectures being verified, not by the volume of publications about the subject.

Arctic Sea Ice Decline and threats to Polar Bear Populations

The authors conjecture (with references) with respect to Polar Bears that

Because they can reliably catch their main prey, seals (Stirling and Derocher 2012, Rode et al. 2015), only from the surface of the sea ice, the ongoing decline in the seasonal extent and thickness of their sea-ice habitat (Amstrup et al. 2010, Snape and Forster 2014, Ding et al. 2017) is the most important threat to polar bears’ long-term survival.

That seems plausible enough. Now for the evidence to support the conjecture.

Although the effects of warming on some polar-bear subpopulations are not yet documented and other subpopulations are apparently still faring well, the fundamental relationship between polar-bear welfare and sea-ice availability is well established, and unmitigated AGW assures that all polar bears ultimately will be negatively affected. 

There is a tacit admission that the existing evidence contradicts the theory. There is data showing a declining trend in sea ice for over 35 years, yet in that time the various polar bear populations have been growing significantly, not just “faring well“. Surely there should be a decline by now in the peripheral Arctic areas where the sea ice has disappeared? The only historical evidence of decline is this comment in criticizing Susan Crockford’s work.

For example, when alleging sea ice recovered after 2012, Crockford downplayed the contribution of sea-ice loss to polar-bear population declines in the Beaufort Sea.

There is no reference to this claim, so readers cannot check if the claim is supported. But 2012 was an outlier year, with record lows in the Summer minimum sea ice extent due to unusually fierce storms in August. Losses of polar bears due to random & extreme weather events are not part of any long-term decline in sea ice.

Concluding Comments

The stupid errors made include

  • Making a superficial point from the data to support a conjecture, when deeper understanding contradicts it. This is the case with the conjecture that rising GHG levels are the main cause of recent warming.
  • Clear misrepresentation of opinion surveys.
  • Even if the opinion surveys were correctly interpreted, use of opinion to support scientific conjectures, as opposed looking at statistical tests of actual data or estimates should appear stupid from a scientific perspective.
  • Claims that a consensus gap between consensus and sceptic views when the real gap is between consensus opinion and actual data.
  • Claims that polar bear populations will decline as sea ice declines is contradicted by the historical data. There is no recognition of this contradiction.

I believe Harvey et al paper gives some lessons for climatologists in particular and academics in general.

First is that when making claims crucial to the argument they need to be substantiated. That substantiation needs to be more than referencing others who have said the same claims before.

Second is that points drawn from referenced articles should be accurately represented.

Third, is to recognize that scientific papers need to first reference actual data and estimates, not opinions.  It is by comparing the current opinions with the real world that opportunities for advancement of understanding arise.

Fourth is that any academic discipline should aim to move from conjectures to empirically-based verifiable statements.

I have only picked out some of the more obvious of the stupid points. The question that needs to be asked is why such stupidity should have been agreed upon by 14 academics and then passed peer review?

Kevin Marshall