Key Error in Climate Policy Illustrated

Good example of the key logical error in climate policy justifications is illustrated by an article posed in a Los Angeles Times article and repeated by Prof. Roger Pielke Jnr on Twitter. This error completely undermines the case for cutting greenhouse gas emissions.

The question is

What’s more important: Keeping the lights on 24 hours a day, 365 days a year, or solving the climate crisis?

It looks to be a trade-off question. But is it a real trade-off?

Before going further I will make some key assumptions for the purposes of this exercise. This is simply to focus in on the key issue.

  1. There is an increasing human-caused climate crisis, that will only get much worse, unless…
  2. Human greenhouse gas (GHG) emissions are cut to zero in the next few decades.
  3. The only costs of solving the climate crisis to the people of California are the few blackouts every year. This will remain fixed into the future. So the fact that California’s electricity costs are substantially higher than the US national average I shall assume for this exercise are nothing to do with any particular state climate-related policies.
  4. The relevant greenhouse gases are well-mixed in the atmosphere. Thus the emissions of California, do not sit in a cloud forever above the sunshine state, but are evenly dispersed over the whole of the earth’s atmosphere.
  5. Global GHG emissions are the aggregate emissions of all nation states (plus international emissions from sea and air). The United States’ GHG emissions are the aggregate emissions of all its member states.

Let us put the blackouts in context. The State of California has a helpful graphic showing a breakdown of the state GHG emissions.
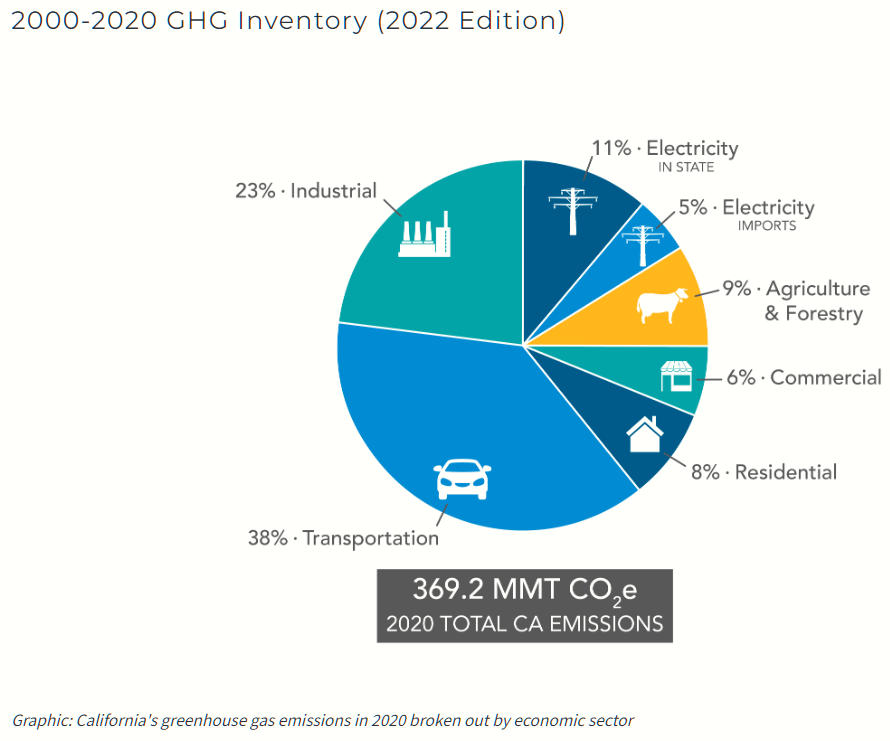
Figure 1: California’s greenhouse gas emissions in 2020 broken out by economic sector

Electricity production, including imports, accounts for just 16% of California’s GHG emissions or about 60 MMtCO2e. Globally in 2020 global GHG emissions were just over 50,000 MMtCO2e. So the replacing existing electricity production from fossil fuels with renewables will cut global emissions by 0.12%. Replacing all GHG emissions from other sources will cut global emissions by 0.74%. So California alone cannot solve the climate crisis. There is no direct trade-off, but rather enduring the blackouts (or other costs) for a very marginal impact on climate change for the people of California. These tiny benefits of course will be shared by the 7960 million people who do not live in California.

More generally, the error is in assuming that the world follows the “leaders” on climate change. Effectively, the world the rest of the world is assumed to think as the climate consensus. An example is from the UK in March 2007 when then Environment Minister David Miliband was promoting a Climate Bill, that later became the Climate Change Act 2008.

In the last 16 years under the UNFCCC COP process there has been concerted efforts to get all countries to come “onboard”, so that the combined impact of local and country-level sacrifices produces the total benefit of stopping climate change. Has this laudable aim been achieved?

I will just go back to 2015, despite the United Nations Framework Convention on Climate Change Treaty (that set up the UNFCCC body) entering into force in March 1994. In preparation for COP 21 Paris most countries submitted “Intended Nationally Determined Contributions” (INDCs). The submissions outlined what post-2020 climate actions they intended to take under a new international agreement, now called the Paris Agreement. On the 1st November 2015 the UNFCCC produced a Synthesis Report of the aggregate impact of the INDCs submitted up to 1st October. The key chart is reproduced below.

Figure 2 : Summary results on the aggregate effect of INDCs to 1st November 2015.

The aggregate impact is for emissions still to rise through to 2030, with no commitments made thereafter. COP21 Paris failed in it’s objectives of a plan to reduce global emissions as was admitted in the ADOPTION OF THE PARIS AGREEMENT communique of 12/12/2015.

  1. Notes with concern that the estimated aggregate greenhouse gas emission levels in 2025 and 2030 resulting from the intended nationally determined contributions do not fall within least-cost 2 ˚C scenarios but rather lead to a projected level of 55 gigatonnes in 2030, and also notes that much greater emission reduction efforts will be required than those associated with the intended nationally determined contributions in order to hold the increase in the global average temperature to below 2 ˚C above pre-industrial levels by reducing emissions to 40 gigatonnes or to 1.5 ˚C above pre-industrial levels by reducing to a level to be identified in the special report referred to in paragraph 21 below;

Paragraph 21 states

  1. Invites the Intergovernmental Panel on Climate Change to provide a special report in 2018 on the impacts of global warming of 1.5 °C above pre-industrial levels and related global greenhouse gas emission pathways;

The request lead, 32 months later, to the scary IPCC SR1.5 of 2018. The annual COP meetings have also been pushing very hard for massive changes. Has this worked?
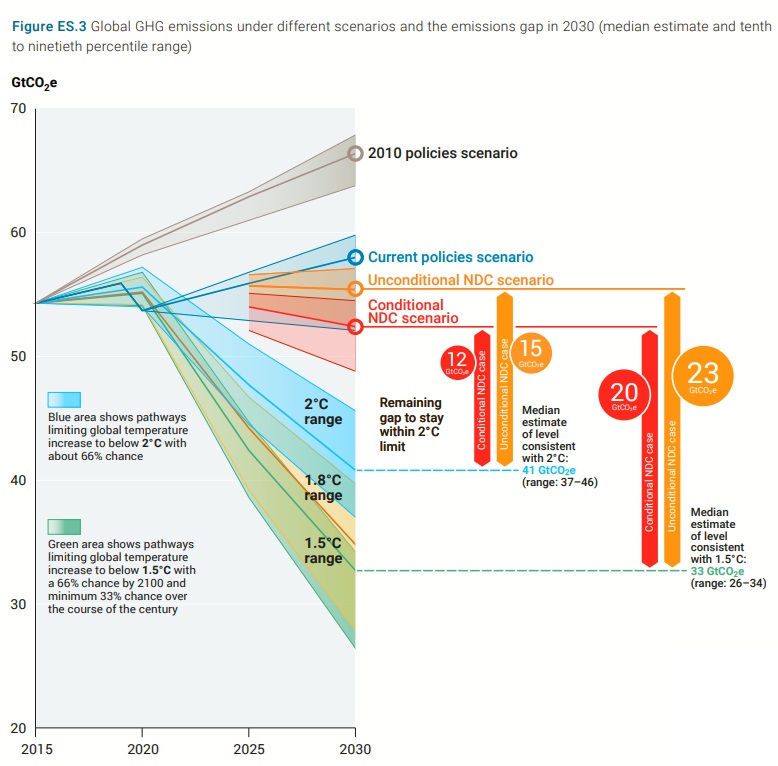
Figure 3 : Fig ES.3 from UNEP Emissions Gap Report 2022 demonstrating that global emissions have not yet peaked

The answer from the UNEP Emissions Gap Report 2022 executive summary Fig ES.3 is a clear negative. The chart, reproduced above as Figure 3, shows that no significant changes have been made to the commitments since 2015, in that aggregate global emissions will still be higher in 2030 than in 2015. Indeed the main estimate is for emissions in 2030 is 58 GtCO2e, up from 55 GtCO2e in 2015. Attempts to control global emissions, hence the climate, have failed.

Thus, in the context of the above assumptions the question for the people of California becomes.

What’s more important: Keeping a useless policy that is causing blackouts, or not?

To help clarify the point, there is a useful analogy with medicine.

If a treatment is not working, but causing harm to the patient, should you cease treatment?

In medicine, like in climate policy, whether or not the diagnosis was correct is irrelevant. Morally it is wrong to administer useless and harmful policies / treatments. However, there will be strong resistance to any form of recognition of the reality that climate mitigation has failed.

Although the failure to reduce emissions at the global level is more than sufficient to nullify any justification for emissions reductions at sub-global levels, there are many other reasons that would further improve the case for a rational policy-maker to completely abandon all climate mitigation policies.
BP Energy Outlook’s 2023 fantasy scenarios

If a fantasy is something impossible, or highly improbable, then I believe that I more than justify the claim concerning the latest BP Energy Outlook. A lot of ground will be covered but will be summarised at the end.

Trigger warning. For those who really believe that current climate policies are about saving the planet, please exit now.

The BP Energy Outlook 2023 was published on 26th June. From the introduction

Energy Outlook 2023 is focused on three main scenarios: Accelerated, Net Zero and New Momentum. These scenarios are not predictions of what is likely to happen or what BP would like to happen. Rather they explore the possible implications of different judgements and
assumptions concerning the nature of the energy transition and the uncertainties around those judgements.

One might assume that the order is some sort of ascent, or decent. That is not the case, as New Momentum is the least difficult to achieve, then Accelerated, with Net Zero being the hardest to achieve. The most extreme case is Net Zero. Is this in line with what is known as Net Zero in the UNFCCC COP process? From the UNEP Emissions Gap Report 2018 Executive Summary, major point 2

Global greenhouse gas emissions show no signs of peaking. Global CO2 emissions from energy and industry increased in 2017, following a three-year period of stabilization. Total annual greenhouse gases emissions, including from land-use change, reached a record high of 53.5 GtCO2e in 2017, an increase of 0.7 GtCO2e compared with 2016. In contrast, global GHG emissions in 2030 need to be approximately 25 percent and 55 percent lower than in 2017 to put the world on a least-cost pathway to limiting global warming to 2°C and 1.5°C
respectively.

With Net Zero being accomplished for 2°C in 2070 and 1.5°C in 2050, this gives 20 years of 2017 emissions from 2020 for 2°C of warming and just 12 years for 1.5°C. Figure 1 in the BP Energy Outlook 2023 Report, reproduced below, is roughly midway between 12 and 20 years of emissions, although with only about three-quarters of the emissions, in equivalent CO2 tonnes that the UN uses for policy. This seems quite reasonable course to take to keep things simple.

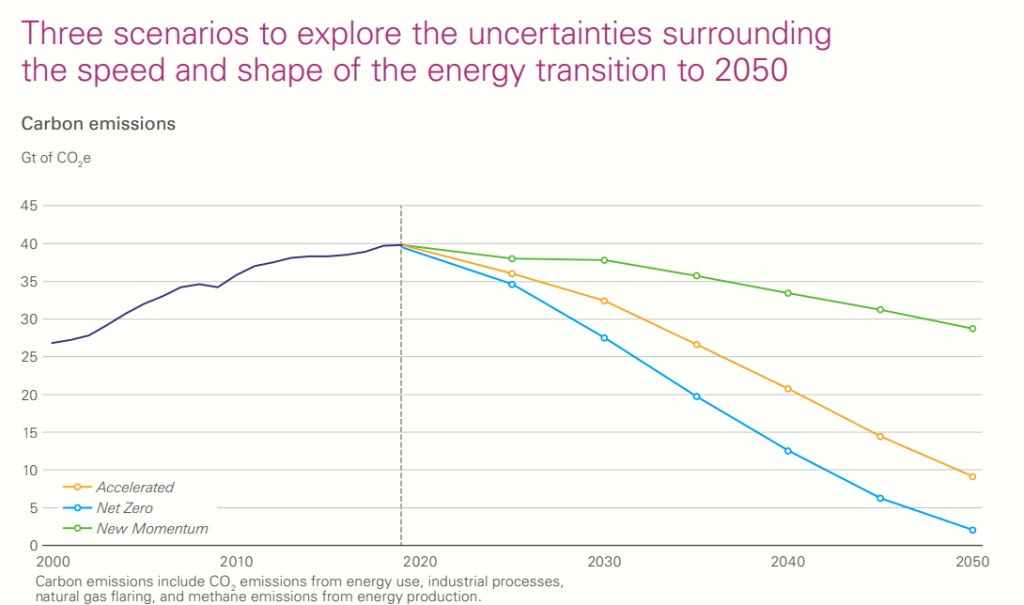
The BP Energy Outlook summarises the emissions pathways in a key chart, reproduced below.

Fig 1 : BP Energy Outlook 2023 scenario projections, with historical emissions up to 2019

One would expect the least onerous scenario would be based on current trends. The description says otherwise.

New Momentum is designed to capture the broad trajectory along which the global energy system is currently travelling. It places weight on the marked increase in global ambition
for decarbonization in recent years, as well as on the manner and speed of decarbonization seen over the recent past. CO2e emissions in New Momentum peak in the 2020s and by 2050 are around 30% below 2019 levels.

That is the most realistic scenario based on current global policies is still based on a change in actual policies. How much though? Fig 1 above, shows, actual emissions up to 2019 are increasing, then a decrease in all three scenarios from 2020 onwards.

At Notalotofpeopleknowthat, in an article on this report, the slightly narrower CO2 emissions narrow CO2 emissions are shown.

Fig 2 : Global CO2 Emissions 2011-2022 from notalotofpeopleknowthat

There was a significant drop in emissions in 2020 due to covid lockdowns, but emissions more than recovered to break new records in 2022. But all scenarios in Fig 1 show a decline in emissions from 2019 to 2025. Neither do emissions show signs of peaking? The UNEP Emissions GAP Report 2022 forecasts that GHG emissions (the broadest measure of emissions) could be up to 9% higher than in 2017, with a near zero chance of being the same. The key emissions gap chart is reproduced in Fig 3.

Fig 3. Emissions gap chart ES.3 from UNEP Emissions Gap Report 2022

Clearly under current policies global GHG emissions will rise this decade. The “new momentum” was nowhere in sight last October, nor was there any sight of emissions peaking after COP27 at Sharm el-Sheikh in December. Nor is there any real prospect of that happening at COP28 in United Arab Emirates (an oil state) later this year.

Yet even this chart is flawed. The 2°C main target for 2030 is 41 GtCO2e and the 1.5°C main target is 33 GtCO2e. Both are not centred in their ranges. From the EGR 2018, a 25% reduction on 53.5 is 40, and a 55% reduction 24. But at least there is some pretence of trying to reconcile desired policy with the most probable reality.

It gets worse…

In the lead-up to COP21 Paris 2015 countries submitted “Intended Nationally Determined Contributions” (INDCs). The UNFCCC said thank you and filed them. There appears to be no review or rejection of any INDCs that clearly violated the global objective of substantially reducing global greenhouse gas emissions by 2030. Thus an INDC was not rejected in the contribution was highly negative. That is if the target implied massively increasing emissions. The major example of this is China. Their top targets of peaking CO2 emissions around 2030 & “to lower carbon dioxide emissions per unit of GDP by 60% to 65% from the
2005 level” (page 21) can be achieved even if emissions more than double between 2015 and 2030. This is simply based on the 1990-2010 GDP average growth of 10% and the emissions growth of 6%. Both India and Turkey (page 5) plan to double emissions in the same period. (page 5) and Pakistan to quadruple theirs (page 26). Iran plans to cut its emissions by 4% up to 2030 compared with a BAU scenario. Which is some sort of increase.

There are plenty of other non-OECD countries planning to increase their emissions. As of mid-2023 no major country seems to have reversed course. Why is this important? The answer lies in a combination of the Paris Agreement & the data

The flaw in the Paris Agreement

Although nearly every country has signed the Paris Agreement, few have understood its real lack of teeth in gaining reductions in global emissions. Article 4.1 states

In order to achieve the long-term temperature goal set out in Article 2,
Parties aim to reach global peaking of greenhouse gas emissions as soon as
possible, recognizing that peaking will take longer for developing country Parties,
and to undertake rapid reductions thereafter in accordance with best available
science, so as to achieve a balance between anthropogenic emissions by sources
and removals by sinks of greenhouse gases in the second half of this century, on the
basis of equity, and in the context of sustainable development and efforts to
eradicate poverty.

The agreement lacks any firm commitments but does make a clear distinction between developed and developing countries. The latter countries have no obligation even to slow down emissions growth in the near future. Furthermore, the “developed” countries are quite small in population. These are basically all the members of the OECD. This includes some of the upper middle-income countries like Turkey, Costa Rica and Columbia, but excludes the small Gulf States with very high per capita incomes.

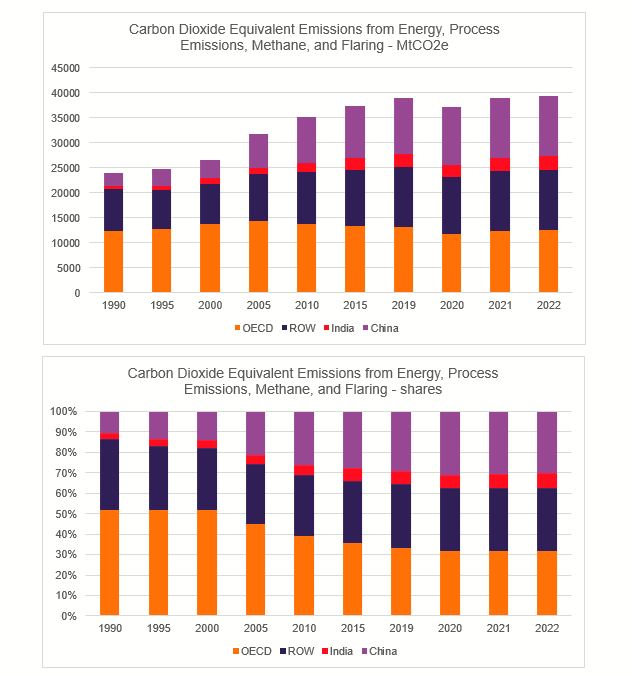
BP is perhaps better known for its annual Statistical Review of World Energy. The 2023 edition was published on the same day as the Energy Outlook but for the first time by the Energy Institute. From this, I have used the CO2 emissions data to split out the world emissions into four groups – OECD, China, India, and Rest of the World. The OECD countries collectively have a population of about 1.38bn, or about the same as India or China.

Fig 4: Global Emissions from the Energy Institute Statistical Review of World Energy 2023 shown in MtCO2e and shares.

From 1990 to 2022, OECD countries increased their emissions by 1%, India by 320%, China by 370% and ROW by 45%. As a result the OECD share of global emissions fell from 52% in 1990 to 32%. Even if all the non-OECD countries kept the emissions constant in the 2020s, the 2°C target could only be achieved by OECD countries reducing their emissions by nearly 80% and for the 1.5°C target by over 170%. The reality is that obtaining deep global emissions cuts are about as much fantasy as believing an Official Monster Raving Loony Party candidate could win a seat in the House of Commons. Their electoral record is here.

The forgotten element….

By 2050, we find that nearly 60 per cent of oil and fossil methane gas, and 90 per cent of coal must remain unextracted to keep within a 1.5 °C carbon budget.

Welsby, D., Price, J., Pye, S. et al. Unextractable fossil fuels in a 1.5 °C world. Nature 597, 230–234 (2021).

It has been estimated that to have at least a 50 per cent chance of keeping warming below 2°C throughout the twenty-first century, the cumulative carbon emissions between 2011 and 2050 need to be limited to around 1,100 gigatonnes of carbon dioxide (Gt CO2). However, the greenhouse gas emissions contained in present estimates of global fossil fuel reserves are around three times higher than this, and so the unabated use of all current fossil fuel reserves
is incompatible with a warming limit of 2°C

McGlade, C., Ekins, P. The geographical distribution of fossil fuels unused when limiting global warming to 2 °C. Nature 517, 187–190 (2015).

I am not aware of any global agreement to keep most of the considerable reserves of fossil fuels in the ground. Yet is clear from these two papers that meeting climate objectives requires this. Of course, the authors of the BP Energy Outlook may not be aware of these papers. But they will be aware of the Statistical Review of World Energy. It has estimates of reserves for oil, gas, and coal. They have not been updated for two years, but there are around 50 years of gas & oil and well over 100 years of coal left. Once

Key points covered

  • Energy Outlook scenarios do not include an unchanged policy
  • All three scenarios show a decline between 2019 & 2025. 2022 actual emissions were higher than 2019.
  • In aggregate Paris climate commitments mean an increase emissions by 2030, something ignored by the scenarios.
  • The Paris Agreement exempts developing countries from even curbing their emissions growth in the near term. Accounting for virtually all the emissions growth since 1990 and around two-thirds of current emissions makes significantly reducing global emissions quite impossible.
  • Then totally bypassing the policy issue of keeping most of the available fossil fuels in the ground.

Given all the above labelling the BP Energy Outlook 2023 scenarios “fantasies” is quite mild. Even though they may be theoretically possible there is no general recognition of the policy constraints which would lead to action plans to overcome these constraints. But in the COP process and amongst activists around the world there is just a belief that proclaiming the need for policy will achieve a global transformation.

Kevin Marshall