James Ross Island warming of past 100 years not unusual

At Wattsupwiththat there is a post by Sebastian Lüning The Medieval Warm Period in Antarctica: How two one-data-point studies missed the target.

Lüning has the following quote and graphic from Mulvaney et al. 2012, published in Nature.

But the late Bob Carter frequently went on about the recent warming being nothing unusual. Using mainstream thinking, would you trust a single climate denialist against proper climate scientists?

There is a simple test. Will similar lines fit to data of the last two thousand years? It took me a few minutes to produce the following.

Bob Carter is right and nine leading experts, plus their peer reviewers are wrong. From the temperature reconstruction there were at least five times in the last 2000 years when there were similar or greater jumps in average temperature. There are also about seven temperature peaks similar to the most recent.

It is yet another example about how to look at the basic data rather than the statements of the experts. It is akin to a court preferring the actual evidence rather than hearsay.

Kevin Marshall

Understanding the US EIAs Levilized Cost of Electric Generation figures

At Watts Up With That?, Willis Eschenbach has a post “The Levelized Cost of Electric Generation“. These are estimated figures by US Energy Information Agency (EIA) for the costs of power by fuel source, for plants with construction started now that would enter service in 2018. The full table from the EIA in $/MwH is reproduced as Table 1 below.

Willis makes the valid point that every unit of “non-dispatchable” power (i.e. renewables with no power on demand) capacity, there must be an equal amount of dispatchable power to back it up. He does not follow this up. Non-dispatchable power does not need to be fully-covered by the expensive high-efficiency fossil-fuelled power stations. The most extreme conditions of peak power demands but no wind can be met by diesel generators. These are relatively low capital cost, but with high unit costs of output. They still add to the costs of renewables, along with reducing the CO2 savings. In terms of the large scale fossil-fuelled power stations gas is clearly better than coal. Combined cycle gas has half the capital cost per unit as conventional coal so dropping the utilisation will have a much smaller impact on unit costs. Further it can be switched on or off much quicker than conventional coal. Combined the actual additional cost of renewables is lower than he implies.

As I have been looking into the subsidies that renewables receive in the UK, I would like to observations. To understand these comments in the context of Willis Eschenbach’s post please note:-

  • In the UK, all generated electricity is paid the wholesale price (approx $0.09 kwh at present).
  • In addition renewables receive renewables obligation credits or ROCs. Biomass (wood pellets usually imported from USA) and onshore wind receive 1 ROC per megawatt hour. Offshore wind receives 2 ROCs. With a ROC worth $0.07 kwh (£42.02 MwH), onshore wind and biomass receives $0.16 kwh and offshore wind $0.23 kwh.
  • Currency conversion is at £1.00 = £1.66. Willis uses kilowatt hours for his simplified summary, whereas as the EIA uses megawatt hours.

Revenue is somewhat different to the costs, but there are a few observations possible.

  1. Capacity utilisation for onshore wind is assumed at 34% and 37% for offshore. For the UK, actual average utilisation as 26% for onshore and 35% for offshore. On that basis, US costs for onshore wind would rise from $0.087 to $0.117 kwh. Here are the figures from the most recent four available years.

  2. Biomass in the UK consists of burning non-fossil fuels in existing coal-fired power stations. It is more expensive than coal because (a) fuel cost per tonne is more than coal and (b) output per tonne is slightly less than coal. I would want to know why the capital cost per kwh is 20% lower and why the variable costs are just 45% higher. On fuel costs alone the 0.2 ROCs per Mwh would be more than generous for biomass. Based on figures from April to August 2013, the full year subsidy saving of this change would be in the order of £300m or $500m per annum.
  3. The transmission investment is vastly understated. Like in the UK, the cost of transmission for a power station investor is likely in connecting the power station to the nearest point on the national grid, regardless of the capacity of the line. To obtain 34% efficiency, wind turbines need to be placed in highly exposed areas, such as hill-tops. Population centres, and established grid networks, tend to be on the plains, or in sheltered valleys. In the UK, the best locations for wind turbines are in the far North of Scotland. To effectively connect this to main grid means upgrading about 400 miles of transmission lines to enable around 5-10GW of power at peak generation. This capital cost could be as much as the wind turbines themselves. Fossil-fuelled power stations tend to be located near existing power stations. These in turn are near to the existing grid infrastructure. The upshot is that wind turbines have much higher transmission costs than fossil-fuelled power stations. The difference could be a number of cents per kilowatt hour.

Kevin Marshall

Observations on the Shollenberger Survey

In late 2012 there was a lot of adverse comment about the paper Lewandowsky, Oberauer & Gignac – NASA faked the moon landing:Therefore (Climate) Science is a Hoax: An Anatomy of the Motivated Rejection of Science (in press, Psychological Science). I did my own quick analysis using pivot tables, which was referred to elsewhere.

Last week, Brandon Shollenberger produced a shorter survey that, though tongue in cheek, aimed to replicate the findings of the Lewandowsky et al. He wrote

As you’re aware, Stephan Lewandowsky has written several papers claiming to have found certain traits amongst global warming skeptics. I believe his methodology is fundamentally flawed. I believe a flaw present in his methodology is also present in the work of many others.

To test my belief, I’m seeking participants for a short survey (13 questions). The questions are designed specifically to test a key aspect of Lewandowsky’s methodology. The results won’t be published in any scientific journal, but I’ll do a writeup on them once the survey is closed and share it online.

This was published at the blogs Wattsupwiththat, JoanneNova and BishopHill blogs. The poll is still available to view.

A few hours ago Jo Nova published Shollenberger’s initial findings, as “Warmists Are Never Wrong, Even When Supporting Genocide“. Using the same methodology that Lewandowsky et al (LOG12) “demonstrated” that those who reject the climate religion have a propensity to believe in cranky conspiracy theories, Shollenberger showed that believers in catastrophic global warming have a propensity to believe in genocide, paedophilia and human trafficking. Like for the LOG12, I have run the data through Excel pivot tables to reveal that Shollenberger was successful in undermining LOG12.

Categorizing the responses

For the LOG12 I split the respondents according to the average response to the four LOG12 “climate science” questions.


Similarly, with the Shollenberger survey, I have categorised the respondents according to response to the three questions on global warming. This time I weighted the responses in relation to belief in catastrophic anthropogenic global warming. First I changed the 1 to 5 response to a 0 to 4 response. The weightings were then 1 for Ques 1, 2 for Ques 2 and 4 for Ques 3. By dividing by the maximum score of 28, I obtained a “believer” percentage. Questions are below.

Also, I have looked at the percentage with the outlier scores, along with the average scores.


Preliminary observations

Some brief preliminary observations that stand out from the pivot tables. These are the green bordered summaries below and the responses to the individual questions at the foot.

  1. Compared with LOG12, Schollenberger gets three times the responses and takes a week rather than 18 months to publish the results.
  2. Schollenberger shows the result of only publishing a survey on only one side of the global warming divide, whilst trying to analyse the other side. The vast majority of responses are from people you are not targeting.
  3. The three times response, in a much shorter time frame indicates that sceptics are far more interested in the subject of global warming than the believers.
  4. Proportionately, more far sceptics seem to visit “believer” blogs than “believers” visit sceptic blogs. This should not be controversial. Sceptics look to understand the view they oppose, whilst “believers” look for confirmation. Climate change is no different from many other areas, including many of the softer sciences.
  5. Schollenberger, in his three questions on belief in global warming captures a broader possible range of beliefs in the climate science, than LOG12 does in four questions. In particular it is possible to distinguish between those who believe humans have caused most of the recent warming, but it is fairly trivial, and those who (like the MSM) believes we are all doomed unless we abandon out cars for bicycles and go to 2W lightbulbs everywhere. The LOG12 questions were designed to polarize views into “pro-science” and “deniers”. Schollenberger thus achieves very quickly what millions of dollars spent on opinion surveys conceals. The extreme alarmism that justifies policy is not held by the majority who believe that anthropogenic global warming is an issue.
  6. Both surveys were uncontrolled for “scam” responses. That is for those on one side to be able to mischievously post as an opponent, but with reprehensible views. The Schollenberger survey had more, and (to a lesser extent) a higher proportion of scam responses. Given the knowledge of LOG12, this is not surprising. But, given the proportions of non-scam responses, “believers” seem to have a greater propensity to scam “sceptics” than the opposite.
  7. Thus Schollenberger can demonstrate that Lewandowsky’s conclusions are as much based on scam responses as his survey.


The Survey Questions


Number of Responses to questions 4 to 13, in relation to CAGW score.


Kevin Marshall

Forcings – Hansen et al 2000 v UNIPCC 2007

Two months ago I did an analysis of aerosols in the UNIPCC AR4 report, observing that

  1. That the IPCC can’t add up.
  2. The figures appear contrived to show that only CO2 was the problem.

Anthony Watts has a posting today “Shocker: The Hansen/GISS team paper that says: “we argue that rapid warming in recent decades has been driven mainly by non-CO2 greenhouse gases“. This is based on the James Hansen (and others) paper analysing natural forcings, with the following graphic.


Hansen et al Figure 1: Estimated climate forcings between 1850 and 2000.

I thought that I would do a quick the comparison between what the IPCC were saying in 2007, with what Hansen et al. were saying in 2000.

According to the UNIPCC

  1. Hansen underestimated CO2 component.
  2. Hansen overestimated the CH4 component.
  3. Hansen overestimated the impact of the sun.

However, Hanson could counter that the UNIPCC have completely forgotten about the impact of volcanoes.

It could be completely coincidental, that further analysis by climate scientists gives a greater role to CO2, and therefore even stronger justification for constraining CO2 emissions. However, although they became more certain on positive forcings, they are less certain than Hansen on aerosols. It gives even greater credence to the cynical view that the climate science community are exaggerating the influence of anthropogenic forcings on climate. Given the billions of dollars annually being poured into research one could reasonably expect a reduction in the uncertainties over time.

A Climate Change / Global Warming Spectrum

In politics, most people’s views can be placed on a spectrum, when it comes to climate change / global warming there is no such perspectives. The views are often polarized, particularly by those who believe in a future climate catastrophe. This is an initial attempt at a grid aimed at clarifying the issues. Your constructive advice is sought on how this might be improved.

When there are contentious or politicized issues, a spectrum of opinions emerge where there is free discussion of ideas. This is true in politics and the Christian religion. In both, there is not just a one-dimensional spectrum of ideas, but multi-dimensional perspectives. For instance, in politics it has been argued that the left-right spectrum should be split into economic and moral issues. The United States Libertarian Party has had a simple survey running since 1995. A more comprehensive (but still American-orientated) survey is the Political Spectrum Quiz.

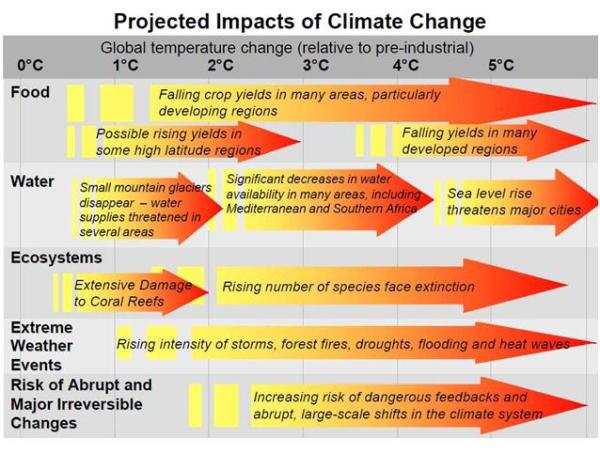
Another idea comes from Greg Craven, who did a series of zany You-Tube videos on Climate Change, particularly such as The Most Terrifying Video You’ll Ever See” and “How it all ends“. He claimed that for the mass of non-scientists it was best to take a risk-based approach, grading the science on the credibility of those who made the claims. One objection with his analysis was it was based on polar extremes. That is either the worst climate catastrophe imaginable, or it is all a hoax. I proposed that there was a spectrum of possible outcomes, with the apocalyptic catastrophe at one extreme and the null outcome at the other. Basically there is a spectrum of views.

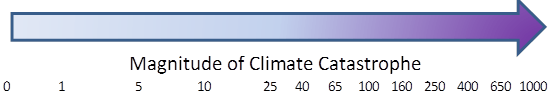
For this spectrum, the possible scenarios are from the null outcome on the left, rising to a huge climate catastrophe on the right.

Craven’s argument was to consider either 0 or 1000, whereas I claimed that the UNIPCC scenarios (representing the “consensus” of climate scientists), allowed for a fair range of outcomes. I have provided a log scale, as this puts clear distance between someone who believes in a low risk of catastrophe of extreme catastrophe to someone who says there is no risk at all. For instance, if someone believes that there is a 1% chance of the worst case, a 9% chance of loss of 100 and a 90% chance of a loss of 10, then their score would be 0.01*1000 + 0.09*100 + 0.90*10 = 28. In other words, for that person, especially if they are risk averse, there is still a very significant issue that should justify serious consideration of some type of global policy action.

But this measure of the prospective level of climate catastrophe needs to be based upon something. That something is scientific evidence, not people’s intuitions or gut feelings. If we imagine that the uncertainties can be measured as risks (as neoclassical economists do) then then the worst case scenario can only be attained if there is near certain, unambiguous scientific evidence in support of that prediction. If the evidence is weak statistically, gives highly variables results depending on methodology or data sets, or only tangential to the prediction, then a lower risk weighting lower than 1 will need to be ascribed. For an overall picture, we need to ascribe a weighting to the body of evidence. I propose a traffic light system. In outline green is for an overwhelming body of evidence, red is for no proper evidence whatsoever, and amber is for some weak evidence. Something along the following lines:-

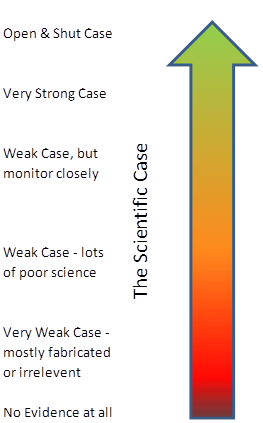
Basically, an unambiguous case for impending global catastrophe must have a substantial body of strong scientific evidence to substantiate that case, with little or no contrary evidence. I will develop on another day the analogy with evidence presented to a criminal court by the prosecution. However, for the present, an analogy that is relevant is that this conclusion is only reached once the evidence fails to fall over under independent cross-examination.

This gives us a grid with the magnitude of the climate catastrophe on the X axis, and the scientific case on the Y axis. The grid, with my first opinion of where people various groups are placed, is given below. I know it is controversial – the whole aim is to get people to start thinking constructively about their views.

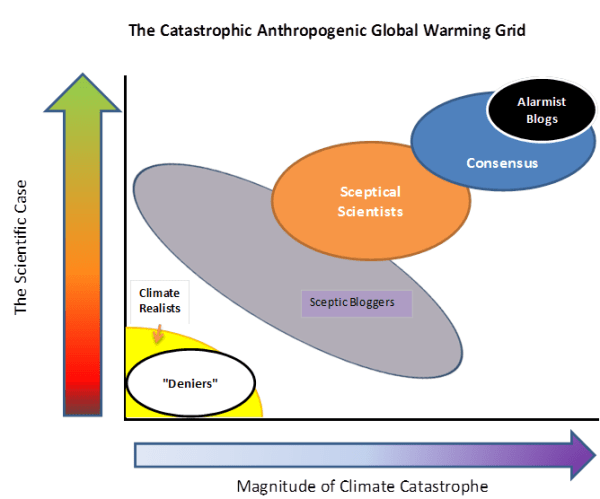
Alarmist Blogs (for instance Skeptical Science and Desmogblog) have an extreme black-and-white one world where they are always right, and anyone who disagrees is the polar opposite . “Deniers” is a bogeyman construct of their making.

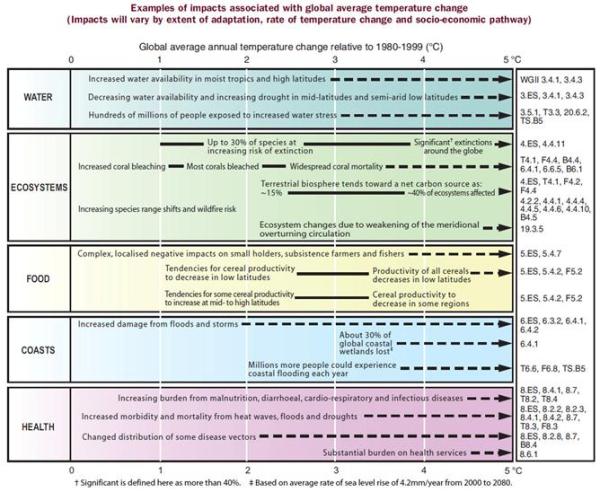
If one reads the detail of UNIPCC AR4 report, the “Consensus” of climate scientists allow for some uncertainties, and for scenarios which are not so catastrophic.

The more Sceptical Scientists, such as Richard Lindzen, Roger Pielke Snr and Roy Spencer, view increasing greenhouse gases as a serious issue for study. However, they view the evidence as being both much weaker than the “consensus” and pointing to a much less alarming future.

The most popular Sceptic Blogs, such as Wattsupwiththat, Climate Audit and Bishop Hill I characterise as having a position of “The stronger the evidence, the weaker the relevance“. That is they allow for a considerable spread of views, but neither dismiss rise in CO2 as of no consequence, nor claim that the available evidence is strong.

Finally, the Climate Realists such as Joanne Nova and the British Climate Realists website. They occupy a similar position as the “deniers”, but from a much more substantial position. They can see little or no evidence of catastrophe, but huge amounts of exaggeration dressed up as science.

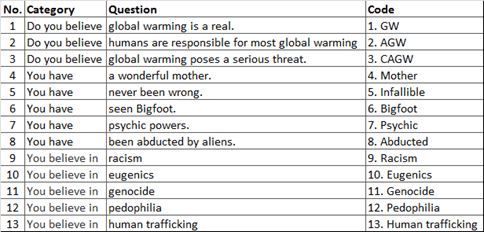
What are your opinions? What position do you think you lie on the grid? Is there an alternative (and more informative) way of characterizing the different positions?

Climate Change Damage Impacts – A story embellished at every retelling

Willis Eschenbach has a posting on a recent paper on climate change damage impacts. This is my comment, with hyperlinks and tables.

My first reaction was “Oi– they have copied my idea!”

Well the damage function at least!

https://manicbeancounter.wordpress.com/2011/02/11/climate-change-policy-in-perspective-%E2%80%93-part-1-of-4/

Actually, this can be found by the claims of the Stern Review or AR4. Try looking at the table in AR4 of “Examples of impacts associated with global average temperature change” and you will get the idea.

A simpler, but more visual, perspective is gained from a slide produced for the launch of the Stern Review.

More seriously Willis, this is worse than you thought. The paper makes the claim that unlikely but high impact events should be considered. The argument is that the likelihood and impacts of potential catastrophes are both higher than previous thought. The paper then states

“Various tipping points can be envisaged (Lenton et al., 2008; Kriegler et al., 2009), which would lead to severe sudden damages. Furthermore, the consequent political or community responses could be even more serious.”

Both of these papers are available online at PNAS. The Lenton paper consisted of a group of academics specialising in catastrophic tipping points getting together for a retreat in Berlin. They concluded that these tipping points needed to include “political time horizons”, “ethical time horizons”, and where a “A significant number of people care about the fate of (a)

component”. That is, there is a host of non-scientific reasons for exaggerating the extent and the likelihood of potential events.

The Krieger paper says “We have elicited subjective probability intervals for the occurrence of such major changes under global warming from 43 scientists.” Is anybody willing to assess if the subjective probability intervals might deviate from objective probability intervals, and in which direction.

So the “Climate Change damage impacts” paper takes two embellished tipping points papers and adds “…the consequent political or community responses could be even more serious.”

There is something else you need to add into the probability equation. The paper assumes the central estimate of temperature rise from a doubling of CO2 levels is 2.8 degrees centigrade. This is only as a result of strong positive feedbacks. Many will have seen the recent discussions at Climateaudit and wattsupwiththat about the Spencer & Bracewell, Lindzen and Choi and Dessler papers. Even if Dessler is given the benefit of the doubt on this, the evidence for strong positive feedbacks is very weak indeed.

In conclusion, the most charitable view is that this paper takes an exaggerated view (both magnitude and likelihood) of a couple of papers with exaggerated views (both magnitude and likelihood), all subject to the occurrence of a temperature rise for which there is no robust empirical evidence.

Al Gore’s faulty case for CAGW

Wattsupwiththat have an estimate of Al Gore’s Climate Reality online viewing figures. I posted at the follow-up article

manicbeancounter says:

September 22, 2011 at 12:17 pm

I was one of those who stayed for over 5 minutes.

A video they had justified the case for global warming by re-doing the CO2 in a jar experiment – very nicely as well. Only they did not say what the concentrations were compared to the atmosphere (probably >1000 times the 0.04% at the moment).

Then in the space of a sentence mentioned feedbacks amplifying the effect.

So of the predicted warming up to 6 degrees centigrade this century predicted by the most extreme alarmists, Al Gore’s little video had a flawed experiment to justify the insignificant first 20%, and a “trust the computer models” for the alarming bit.

Don’t take my word for it – I am just a (slightly) manic beancounter. Check out for yourself at http://climaterealityproject.org/video/climate-101/

By the way – don’t worry about the stats – Alexa currently ranks this site at 16,989 and Climate Reality at 64,734.

REPLY: I have a post coming up on this video, which is online here also, without the need to visit Gore’s site: http://vimeo.com/28991442
-Anthony


Outflanking Al Gore & other alarmists

At Wattupwiththat there is a proposal to build a database by

Find(ing) every false, misleading, scary, idiotic, non-scientific statement they have made in the past twenty years. Create an index by name with pages listing those statement with links to the source. Keep it factual. Let their own words come back to haunt them.

My comment was

A database of all the exaggerations, errors and false prophesies on its own will do no good. No matter how extensive and thorough and rigorous, it will be dismissed as having been compiled by serial deniers funded by big oil. Getting a fair hearing in the MSM will be impossible. It the coming battle the alarmists have decided the field of battle and have impenetrable armour.

To be brief, there needs to be two analogies brought to the fore.

First is the legal analogy. If there is a case for CAGW, it must be demonstrated by primary, empirical evidence. That evidence must be tested by opponents. It is not the bits, that may be true – like lots more CO2 will cause some warming. But that there is sufficient CO2 to cause some warming, which will be magnified by positive feedbacks to cause even greater warming, and this substantive warming will destabilize the planet weather systems in a highly negative way. The counter-argument is two-fold – that many of dire, immediate, forecasts have been highly exaggerated and more importantly, the compound uncertainties that have been vastly underestimated. That the case is weak is shown by the prominence given to what is hearsay evidence, such as the consensus, or the proclamations of groups of scientists, or to the image of the hockey stick. In some cases, it has been tantamount to jury-tampering.

Second is the medical analogy. A medical doctor, in proscribing a painful and potentially harmful course of treatment, should at last have a strong professionally-based expectation that post treatment the patient will be better off than if nothing was done. The very qualities that make politicians electable – of being able to make build coalitions by fudging, projecting an image, and undermining the opponents by polarizing views – make them patently unfit for driving through and micro-managing effective policy to reduce CO2. They will of necessity overstate the benefits and massively understate the costs, whether financial or in human suffering. They will not admit that the problem is beyond their capabilities, nor that errors had been made. The problem is even worse in powerful dictatorships than democracies.

I have tried to suggest a method (for those who are familiar with microeconomics) the IPCC/Stern case for containing CO2 here.

https://manicbeancounter.wordpress.com/2011/02/11/climate-change-policy-in-perspective-%E2%80%93-part-1-of-4/

Also, why there is no effective, global political solution possible.

https://manicbeancounter.wordpress.com/2011/02/13/climate-change-in-perspective-%E2%80%93-part-2-of-4-the-mitigation-curve/

What is missing is why the costs of global warming have been grossly exaggerated.

Show Warming After it Has Stopped Part 2

Last week I posted how Miles Allen had pulled off a trick to show warming in the 21st century after that trend had stopped in 1998. According to David Middleton at Watts up with That, the BBC’s Richard Black is using a similar decadal comparison to show that warming has continued. There are two Richard Black’s claim that the GWPF are cherry-picking the data. First, that an employee of the UK state broadcaster should choose to use a foreign temperature record over the UK one. Second, why the switch to decadal comparisons, when the IPCC has long used the norm.

Let me break this down with two graphs. Like with the previous posting, I see no scientific reason to necessitate why the starting point for the earth’s orbit of the sun has to be on 1st January. I therefore include all 12 month moving averages. That is Jan-Dec, Feb-Jan, Mar-Feb etc. I have also included three lines on my analysis. First the NASA GISSTEMP; second the HADCRUT3 and third the difference between the two.

The first graph shows the decadal change in the NASA GISS figures that Richard Black is talking about. Sure enough the only period where the 12 month average temperature anomaly is lower than a decade before is in 2008. Using the HADCRUT3 data reveals a similar pattern, but the negative period is much longer. If The HADCRUT3 decadal change is subtracted from the GISSTEMP, there is shown to be a greater decadal warming trend in the NASA than in the UK figures. This might suggest the reason for Richard Black’s preference for foreign data over that paid for by the UK taxpayer’s.

The second graph shows the 12 month moving average data – and clearly shows the reasons for both using decadal temperature changes over annual, and foreign data over British. From 1988 to 1997, there was no real warming trend if the Pinatubo cooling is removed from 1995. However the NASA anomaly seems to be around twice as volatile is the Hadley. But in 1998 the position reverses. The natural 1998 El Nino effect is twice according to the British scientists, as it is to Dr Hansen and his team. Post 1998 the story diverges. According to NASA, the warming resumes on an upward trend. According to the Hadley scientists, the 1998 El Nino causes a step change in average temperatures and the warming stops. As a result the NASA GISS warming trend is mirrored by its divergence from the more established and sober British series.

Betraying Socialist Principles to Combat Climate Change

Jo Nova reports that a Carbon Tax is coming to Australia. This is to be followed by carbon trading. Comment submitted

In economic theory, in a closed economy and zero transaction costs, with all other things being equal, a carbon trading should work quite well to reduce carbon emissions. In the real world consider these points.

1. The oil price has more than tripled in the past decade. There are enough incentives to improve energy efficiencies from this alone. The marginal impact of carbon trading will be much lower than if the oil price had been static.

2. Those businesses which can most easily pass on the extra costs to the customer are those with no competition from abroad. Supermarkets, which consume huge amounts of energy, are a good example. Australians cannot hop over to New Zealand or Singapore for their weekly groceries. The biggest burden relatively, will be borne by the poor. Manufacturing businesses will be incentivised by the profits from selling carbon credits to ship production abroad to China. High polluting, old production processes will gain a new income stream. New, efficient, competing ventures will have to pay the incumbents to enter the market.

3. The energy trading schemes are highly complex and need experts to set up the rules. Or rather people who read up on the theory, and know more than the naive punters the elected representatives of the people. Enron was bidding to be a big player, before it went bust. Lehman Brothers was bidding to be a big player, before it went bust. With mortgage securitisation now so out of fashion, this presents a new way for the masters of the universe to make extraordinary profits.

I do not keep up with politics much, especially on t’other side of globe like. (I am from Manchester, England). So have I got this reet? A socialist government in Australia is bringing in a regressive policy that could cause consumers to subsidise the movement of manufacturing jobs abroad, and help a return to the multi-million dollar bonuses in the financial services industry. All this, in the name of a policy that will be near impotent in constraining CO2 emissions.

If you follow the UNIPCC or Stern Review line, the policies to combat climate change are highly cost effective. But that requires correctly identifying the low-cost alternatives and successfully pursuing those options. Politicians have not the skill-sets, the incentives, the staying power, the knowledge, the longevity, the power, or the incentives to achieve these aims. They may inadvertently undermine the very things in which they originally believed.

Antony Watts in addition reports that whilst the socialist government in Australia is taking on carbon trading, the Republicans of New Hampshire are ditching the same policy. I commented

I do not keep up with politics too much, so Anthony, are you sure that you have things the right way round? A socialist government in Australia is bringing in a regressive policy that could cause consumers to subsidise manufacturing jobs abroad, and help a return to the multi-million dollar bonuses in the financial services industry. All this, in the name of a policy that will be near impotent in constraining CO2 emissions. The Republican Party (who represent business interests) in New Hampshire is proposing binning a policy that would help their real constituents.

Revision on 25th February.

  1. Having slept on the issue, I would like to put a perspective on my comments above. Carbon trading will have some early successes over and above rises in the oil price, as it gives a cost-bias to non-GHG energy sources. However, given that

    1. Regulation is making it difficult to build high-carbon power-stations, particularly coal. So the movement away from high fossil-fuel power is happening anyway.
    2. High carbon-emitting manufacturing has been moving away from the developed countries for years. For instance, steel, shipbuilding and bulk chemicals are goods examples, along with labour-intensive low-carbon options.
    3. Government subsidies for clean energy sources.

    So even with a well-designed and well-run policy, the impact will be limited to start off with. That is the cost per unit of CO2 saved will already be high. Then as the policy is progressed, diminishing returns will set in.