Two Ways to Forecast English Local Elections

On the 25th Mike Smithson of Political Betting went to London for the annual local elections briefing organised by the Political Studies Association. Profs Colin Rawlings and Michael Thrasher concentrated on their by-election prediction model. Smithson showed these two slides.

This is an increase on their forecasts in the Times earlier in the month, which gave Conservative +50, Labour -50, Lib Dem +100, UKIP -100. However, the seat change are is still well below my own, much more basic, forecasts. I have summarized how the seat changes stack up against both the 2013 and the previous 2009 round.

I should note that my seat changes make no allowance for boundary changes, or even changes in the councils. On this basis, there is no real difference between the forecasts for the Liberal Democrats or UKIP. The difference lies with the two main parties, where I predict nearly three times the gain for the Conservatives and four times the loses for Labour. In so doing I am basically saying that the seats will roughly revert back to the seat numbers of 2009. Figure 2 (from my post on the earlier Rawlings and Thrasher forecasts) shows this very volatility.

Note the 2013 figures included Ynys Môn council in Wales, along with 33 English Councils.

At the moment we are living in turbulent times in terms of shift in opinion. I think it is not unreasonable to expect similar swings in seat numbers to those that occurred in these two previous elections, especially

Using local by-elections as a means of predicting local elections seems intuitively appealing. Every Friday is published the data on the previous days by-elections at both Politicalbetting and ConservativeHome blogs. The availability of this data is in no small part due to work done over many years by Rawlings and Thrasher. Yet these results are for the whole of England, whilst these elections are for only a seventh of the total. So local issues may be different, especially when these elections are in predominantly Conservative areas. The divergence is shown in the unchanged modeled National Equivalent Vote share from 2013 to 2017 for the Labour Party. It seems to me unlikely that this 29% share, (compared to actual 2013 English vote share of 21.1%) should be unchanged when the UK General Election opinion polls have dropped around 12% from around 38% to 26%. The current relative position of the Conservatives to Labour is about the same as in 2009, with maybe the Conservatives in a slightly stronger position currently. For this reason, I think the benchmark for forecasts should be 2009 in England.

However, if Rawlings and Thrasher, by their modelling can produce something nearer to the actual results this coming Thursday then they will have greatly added to election forecasting by managing to go beyond the rough ratios of swings in proportion to movements in national opinion polls.  The key will be in the Labour party losses, where the R&T forecasts appear most divergent. That is, without evidence of a large move in the opinion polls (and I am writing this before the opinion polls for the Sunday papers are published), if Labour seat losses are less than 200, then the explanation for this divergence will be at least in part be from predictions based on by-election results. The model will have been a predictive success. Even if Labour loses 300 seats, the fact of developing a rigorous model that is falsified by the data, could develop our understanding of council by-elections as a predictor relation to the full results. This previously unavailable information could still be useful. In less than a week we shall know.

Kevin Marshall


Will Ruth Davidson be Apologizing to Voters After the Scottish Local Elections on May 4th?

The Conservatives in Scotland are likely to show large gains in the Scottish local elections next Thursday.  So why should Ruth Davidson end up have to make an apology?

Consider the reasons that are likely to be large gains next week.

First, is that in 2012 the Conservatives did rather badly. They lost 28 seats to 115 seats, less than 10% of the total. In first preference vote share they went down over 2% to 13.3%.

Second is that since the 2015 General Election, when they received 14.9% of the vote – worse than the 2012 local elections with no Independents – the opinion polls have shown a consistent rise in support. By May 2016, the Conservatives achieved 22% of the vote at the constituency level in the Scottish Assembly Elections. By early this year opinion polls are indicating around 25% support.

Third is that support has, if anything, risen further in the last couple of months. Polls conducted since the General election was announced show GE support at 28% (Survation/Sunday Post) and 33% (Panelbase/Sunday Times). Below is a summary from Martin Baxter’s Electoral Calculus Website

On that basis local election vote could be above the 21% of First Preference Votes I used to predict gains of 150 seats. The potential embarrassment lies in the Single Transferable Vote (STV) system. Under STV – a basic alternative to proportional representation – very large council wards have three or four Councillors. If a Party wishes to maximize its seats, it must optimize the number of candidates. In a previous post, I looked at the the candidates per ward.

In only 41 wards do the Conservatives have more than one candidate. In optimizing the number of candidates they have assumed that in only a very limited number of wards will they receive more than a third of first preference votes. Much below that and two candidates would end up competing against each other for votes. This is the strategy of a party, with uneven support, who still expects to get less than 20% of the vote. The problem is that is so long since the Conservatives had this level of support they do not know where that support lies. So, retrospectively, the Conservatives will realize that in many wards they could have fielded an extra candidate. This could mean that they fail to become the largest party on a number of councils, due to the prudent approach. Given that the SNP is the strongest party with the most candidates, it is they who will gain from this prudence. Hence the reason that Ruth Davidson could end up apologizing.

If this happens, and the Labour party loses out from fielding too many candidates (through matching the number of seats held in most areas), it could lead to a campaign to abandon the STV system. The SNP will likely stoutly defend a system that seems progressive and benefits them.

Kevin Marshall

Implications of the Forecast Local Council Elections Results in England, Wales and Scotland for GE 2017

Summary

I bring together Local Election forecasts for England, Wales and Scotland made over the past few weeks, before the General Election announcement a week ago. In the three countries I forecast that the Labour Party would lose 700 seats, and the Conservatives to gain over 500 seats. The most dramatic changes I forecast are in Scotland, where the Conservatives should end up with more seats than Labour, firmly cementing their place as the second party of Scotland. The SNP I forecast to have a net gain of 100 seats, despite likely losing seats to the Conservatives.
The impact of the snap General Election is likely to reinforce the dramatic exchange of seats that I forecast, with the additional impacts of (a) confirming the collapse in UKIP support; (b) highlighting the re-emergence of the Liberal Democrats as the major alternative to the Conservatives in much of England; and (c) providing a signal that the peak SNP dominance in Scotland has passed.


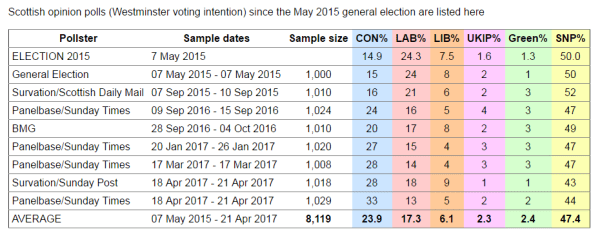
In the last few weeks I have made some results forecasts for the forthcoming local elections in England (here and here), Wales and Scotland occurring on May 4th. I was forecasting some big changes in numbers of seats. Since then a snap General Election has been called for June 8th. This may affect the forecasts, although given I have used mostly GE opinion polls, maybe not quite so much as local election forecasts based more upon recent local election by-election results. Rather than try to reforecast based upon widely fluctuating opinion polls (such as in last Sunday’s papers ), I will try to evaluate the impact of my forecasts being correct in the context of the narrative for the parties for the last few weeks of the General Election campaign.

In England, only a small proportion of councils are up for re-election. The 35 councils are a mixture of shire counties and unitary authorities. They are predominantly in areas with Conservative members of parliament, although there is also the Labour stronghold of Durham, along with Lancashire and Derbyshire where Labour managed to regain council majorities in 2013. In terms of councils involved, this is a very low number. There were 124 English councils with elections in 2016 and 279 in 2015. Entirely absent are any council elections in the major English cities.

In Wales and Scotland all council seats are up for re-election. Although with similar numbers of council seats in the two countries as the English councils, these are far more significant politically.

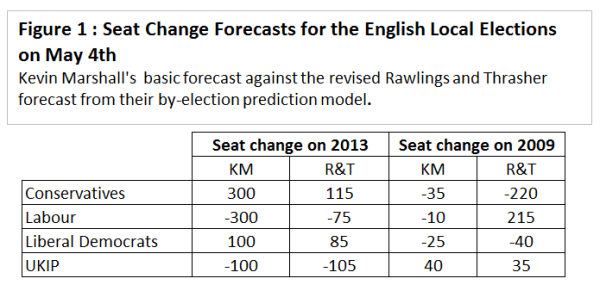
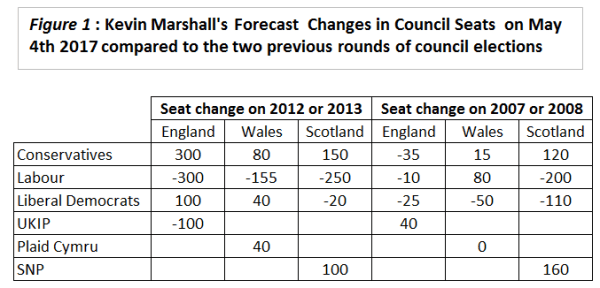
Figure 1 summarizes my forecasts of seat changes for each country both against the last elections in 2012 and 2013 and the previous round of elections in 2007 and 2008.

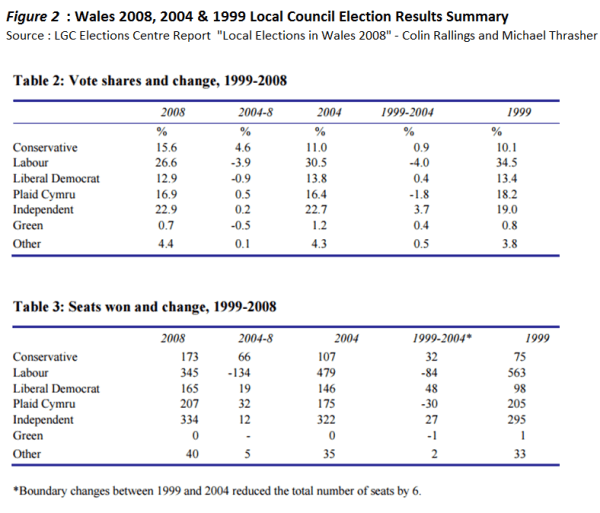
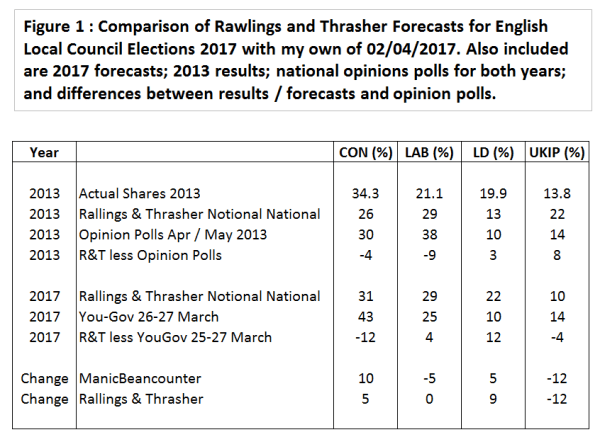
I believe that a major influence on the UK local election results is the state of national opinion. This is in general direction of opinion and not the percentage share of the vote. For instance, in 2007 and 2008 the Labour Government was trailing the Conservatives by quite a long way in the opinion polls – possibly as much as 15 points. By 2012 and 2013 the situation was reversed, with Labour in opposition being around 8 points ahead of the Conservatives. Proportionately, Liberal Democrats as the junior partner in a coalition government, suffered greater reversals than the Conservatives.  This is strongly seen in the English council results, with the exception of the UKIP factor. The 2013 council elections demonstrated a game-changing http://www.bbc.co.uk/news/uk-politics-22382098 rise of UKIP outside of elections to the European Parliament.  In Wales, the National Opinion influence is less marked, but it is still there. Scotland is the least influenced by National Opinion trends, as there are strong factors unique Scottish factors, such as the replacement of the Labour Party with the SNP as the major left of centre party.

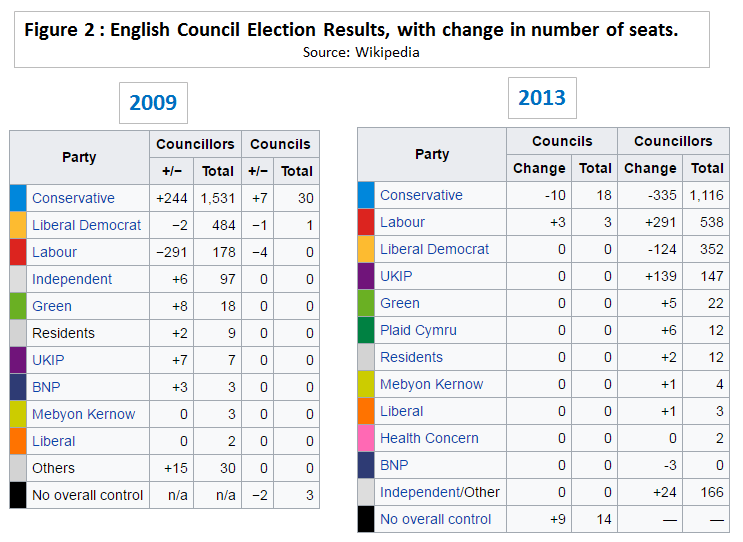
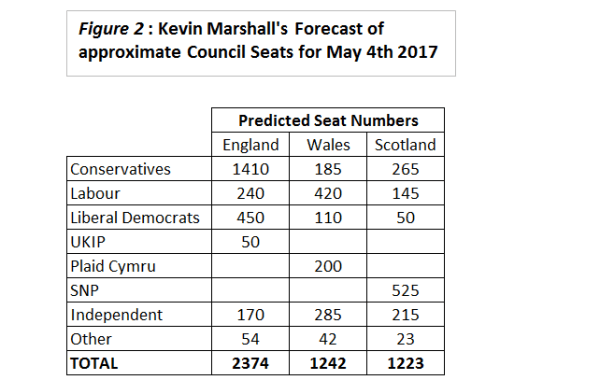
Before looking at the likely consequences for the General Election, I have shown the approximate forecast council seat numbers in figure 2.

Political Implications of the English Council Results

With hindsight my UKIP seat estimate is probably too high. But even if they retain 40 to 50 seats it will still be a major reversal on 2012. It will be very hard to convince voters in England – especially in the pro-Leave areas of the country – that they are a credible alternative political party, whether on Brexit or populist issues such as immigration.

The Liberal Democrats fell into third place behind Labour in 2013. I will be very surprised if that they do not regain second place. Expect to see a lot made of being in most of Britain the only credible alternative to Conservative pro-Brexit juggernaut.

The Labour Party will excuse the results as being in Tory areas, claiming that there is a different picture in the rest of England, particularly in London. They will try change the conversation to winning the mayoral elections in Manchester and Merseyside.


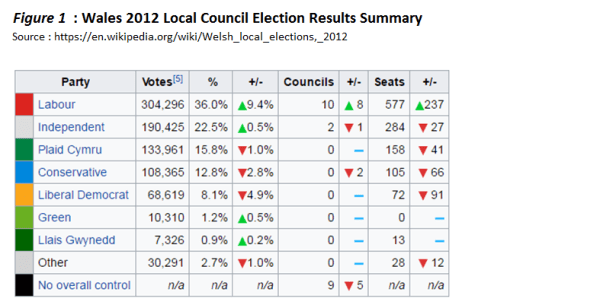
Political Implications of the Welsh Council Results

Plaid Cymru might only make small gains, and it will be in a limited number of areas. They will use this to persuade voters of being an anti-Brexit and pro-Welsh voice. By softening the Welsh language aspects, they might seek to extend their reach beyond the West Coast.

The Liberal Democrats will look at actual council successes to drive home their Pro-Remain message, particularly in the capital, where they will be looking to regain Cardiff Central.

For the Conservatives, coming in third place behind Plaid Cymru, despite large gains, may give confidence to other parties. If they come second (and/or regain control of the two councils lost in 2012) then this will be a landmark achievement. A YouGov opinion poll for Cardiff University and ITV on 24/04/17 of voting intentions for the Welsh local elections gave Labour 28%, Conservatives 26% and Plaid Cymru 19%, against my assumptions of 29%, 16% and 17%. The main inaccuracy of the poll I believe is that it calculates Independents plus minor parties at 12%, half the level of 2012. I assume a 1% gain. Given such varied support across the councils, along with first asking General Election opinions, it is easy to understand how this discrepancy might arise. However, it will be the actual results that will decide who has the greater accuracy.


Political Implications of the Scottish Council Results

It is in Scotland that the results will reverberate most strongly if my forecasts are correct. There are a couple of points to remember about the peculiar Scottish context.

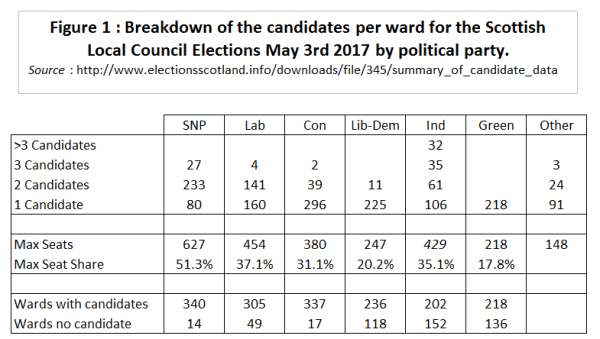
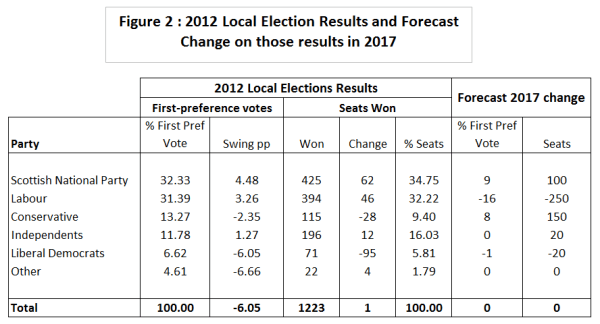
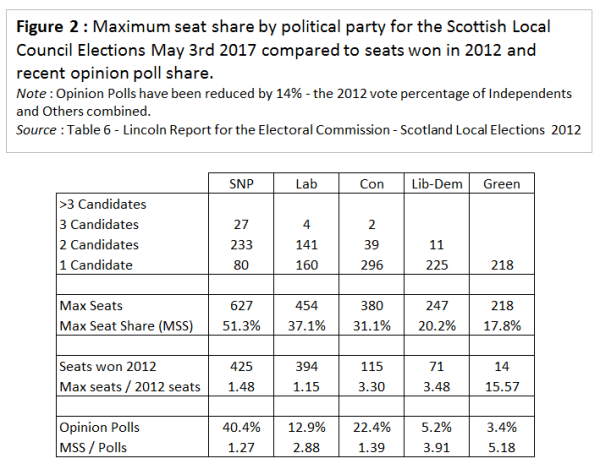
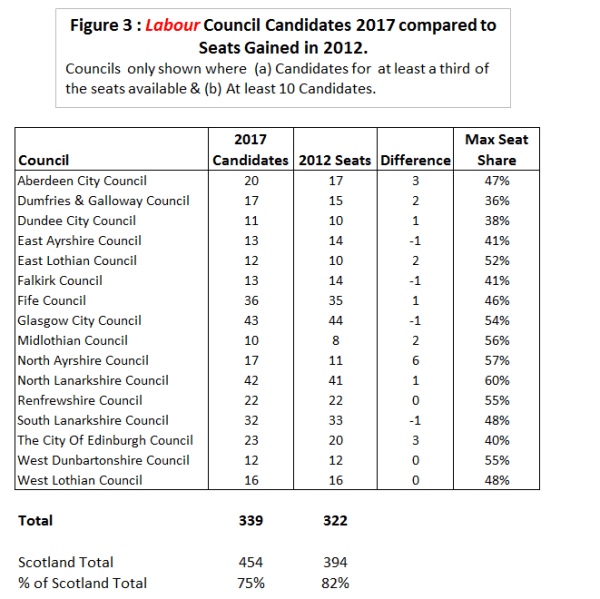
First is that Scotland is embarking on the third set of council elections using the single transferable vote system (STV), with council areas divided into supersized wards of three or four seats. It means that if a party selects too many candidates in a ward, they may end up with less Councillors elected as candidates of the same party compete against each other for votes. They parties therefore try optimization of candidates based on forecasts. As I found, the Labour Party, instead of optimization based on a dramatic forecast fall in their vote, chose to largely match candidates with existing Councillors. They are therefore likely to lose proportionately more seats as a consequence of this quite rational decision.

Second, is the growth in the SNP means that the change in the vote from council election to council election does not strongly reflect the swings in the UK-wide opinion polls over the same period. For instance, although the Labour share of the vote in 2012 was higher than in 2007, the rise was much smaller than the SNP rise in vote share. However, I still forecast SNP vote share to increase, resulting in a net gain in Councillors. But these net gains will include very large gains in Labour councils, such as Glasgow, alongside loses elsewhere, especially to the Conservatives. There will be a strong message for those who oppose independence that the SNP juggernaut might have peaked and could signal the turning of the tide on the Independence issue.

Lib Dems may not have a significant showing, as in many areas where they are strong in the Westminster elections, are where there is a strong representation of Independents. Indeed, the councils of Orkney and Shetland, where the Lib Dems have their only Scottish MP, are all Independents. Whether they will win over some votes as the party of double-Remainers, remains to be seen. An extensive Scottish Yougov poll  published in January, but based on sampling in late 2016, showed that the double-Remainers were 28% of voters. That includes 21% who voted in one or none of the two referendums.

From my forecast the Conservatives will easily replace Labour as the second political party represented on Scotland’s councils. Due to Labour having too many candidates, they could pick up seats in unexpected areas. Conversely, if the Conservative surge continues, then Ruth Davidson may end up apologizing for having too few candidates, as vote share in some wards might easily elect the available candidates.


Implications for the UK General Election

A loss of 700 seats across three countries would be a huge message that the Labour Party under Jeremy Corbyn’s leadership was heading for an even worse result than in 1983. The benchmark in England and Wales would be the woeful results of 2007 and 2008, which were 530 seats lower than the last set of elections, compared to my forecast of 455 seats lost.

The Conservatives will want to downplay strong gains in England and Wales in case complacency reduces turnout on June 8th. But they will want to emphasize their confirmed position as the opposition in Scotland.

The Liberal Democrats will announce that they are back, and concentrate on gains made in particular areas where they are clearly the main opposition to the Conservatives Hard Brexit. They will emphasize any gains they might make in the council areas where they had Westminster MPs until 2015.

UKIP may lose more than the rounded 100 seats I forecast. It will show that, unlike in 2015, they are no longer the protest vote of the disaffected. Given that their main cause has been achieved, and supporting the Conservatives is the surest way to ensure Brexit is enacted in full, this may signal the end of the UKIP as a national force on June 8th.

The biggest losers could end up being the SNP, despite their likely winning control of a number of councils and destroying the Scottish Labour Party. Their demonisation of the Conservative and Unionist Party as the subjugators of the Scots will not hold as much sway when the spread of their Councillors is much broader than in living memory and the Conservative voter is more likely to be your own neighbour.

Kevin Marshall

Local Elections Forecast for Scotland May 2017 (Pre-GE Announcement)

My forecast for the Scottish Local Elections in terms of change in share of the First Preference Votes from 2012 is SNP +9%, Labour -16%,  Conservatives +8%, Lib Dems -1% and Independents NC. In terms of change in seats, out of 1223 being contested, I forecast SNP +100, Labour -250,  Conservatives +150, Lib Dems -20 and Independents NC. The reasons are given below. This was compiled prior to Theresa May announcing a snap General Election to be held on June 8th. However, given that my forecast was largely based upon movements in Scottish GE opinion polls, the fact that the local elections will be held during a GE campaign might reinforce the influence on the local vote,


There are a number of factors that make forecasting the the outcome of the local elections just three weeks from now quite difficult.

  • In 2007 was the first election change to the Single Transferable Vote (STV) system, along with ward numbers being reduced, with three or four councillors per ward.
  • In 2007 the Labour Party did badly in the share of the of First Preference votes due to unpopularity of the Westminster Labour Government and also lost out due to STV. Compared to 2003, Labour’s share of the vote dropped 4.5% to 28.1%, but their share of council seats dropped 13.2% to 28.5%. The SNP were the big winners. From 2003 the SNP’s share of the vote rose 3.8% to 27.9% and their share of council seats rose 14.9% to 29.7% (source : tables 6 & 7 of Scottish Council Elections 2007 Results and Statistics).
  • In 2012 the Westminster Labour Party in Opposition were riding high in the polls. But in the Scottish Local Elections only improved their vote share on 2007 by 3.3% to 31.4% and their seat share by 3.7% to 32.2%. The SNP also improved on their 2007 results. The SNP vote share increased 4.4% to 32.3% and their seat share 5.1% to 34.7%. The Lib Dems suffered the biggest setback, with vote share almost halving to 6.6% and seat share reducing 7.8% to 5.8%  (source : tables 6 & 7 of  Lincoln Report on Report on Scottish Council Elections 2012).
  • Following the Independence Referendum of October 2014, the SNP, despite losing the referendum, increased their share of the Scottish Westminster voting intention opinion polls from around 30% to 47-48%.
  • Since the General Election (with SNP winning 50% of the vote and 56 of 59 seats) the SNP’s share of the Westminster voting intention has remained near 50%. The Conservatives have improved from 15% to around 25%, whilst Labour have declined from 24% to 15%. See Figure 1 below, lifted from the Electoral Calculus website.

  • The is a big gap in the polls between September 2015 and September 2016. But in May 2016 there was the Elections to the Scottish Parliament, with the constituency (and regional) vote shares of Con 22.0% (22.9%) , Lab 22.6% (19.1%), Lib Dem 7.8% (5.2%), UKIP 2.0%, Green 0.6% (6.6%) and SNP 46.5% (41.9%).  This bridges the gap in quite nicely, and is consistent with the polls.
  • In June 2016, the UK voted to leave the European Union by 51.9% to 48.1%. But in Scotland the vote was 38.0% to 62.0%. The SNP maintains a paradoxical position of wanting Independence from the UK, but to remain a part of the more opaque European Union. First Minister Nicola Sturgeon was hoping that Brexit would cause those Scots who voted to remain in both the UK and the European Union would come over to the Scottish Independence side. According to a large YouGov poll conducted last year and published in January, this switch has happened. But it has made no impact on the polls as there has also been a switch between those who voted for Independence from both the UK and the EU to support for remaining a part of the UK.
  • The STV system forces parties, if they wish to maximize the number of candidates elected, to optimize the number of candidates. My previous post was a long digression, based on the published candidate lists, on how of the three main parties, SNP and Conservatives appear to have adopted these optimization strategies. Conversely the Labour Party appears to have fielded candidates in line with the number of council seats held, failing to recognize that their support has about halved. As a result I would expect the Labour Party to experience a greater fall in share of seats than in share of the vote.

Forecast for Scottish Local Elections (pre-GE announcement)

Based on the above, I offer up quite a radical forecast for the Local Elections.

The Scottish National Party (SNP) look to have peaked in terms in popularity. Their vote share in the 2016 Scottish Parliament elections was slightly below the Westminster Elections of 2015. Estimation of the vote share in the Local Elections is a matter of allowing for how much the Independents will eat into the SNP share of the Scottish Vote. I think that a 41% share is a reasonable estimate. Share of seats I expect to rise by slightly less than vote share, which gives a rise of 100 seats. Note that with only 627 candidates, such a rise in seat numbers implies less than 1 in 6 of the SNP candidates would fail to get elected.

For the Labour Party, 2012 was an improvement on the 2007 result, but increase in the share of the vote was much smaller than the improvement in England or in Wales. That was due to the SNP taking up much of the fall in vote share of the Liberal Democrats and the Conservatives. Labour have been reducing in the opinion polls since the 2015 General Election and further since the Scottish Parliament election of last year. Given that Labour in the UK has been falling in the opinion polls to below 25% (see new lows with You Gov this last weekend), the share could be lower than 15% that I have assumed. Another factor is that due to the Independents, the vote share could also be lower. the forecast loss of 150 seats I believe to be quite cautious for two reasons. First, is that once a Party with wide spread coverage goes beyond a certain level of support, they fail to win as many seats as vote share, even with a proportional system like STV. The second reason is that Labour have too many candidates. There is an outside chance of seat share falling below 10%.

The Conservative Party are have increased their share in the Scottish opinion polls since last year. That resurgence is partly as a result of Brexit, with the party being the clear choice who support an Independent United Kingdom. But they are overcoming decades of increasing unpopularity. Whilst the opinion polls show the Conservatives at 25% or more, I believe that 21% is a more reasonable forecast. However, in terms of seats, that increase of 8% in first preference votes will be sufficient to mean a much larger increase in seats numbers. So this this time the share of seats will be similar to the share of the vote, whilst in 2012 there was a four point gap.

The Liberal Democrats, if anything, I believe will see another slight decline in their vote share. The Independents are the big unknown. But most of the seats held are in a small number of Councils. 125 out of 200 current Independent Councillors are in 7 out of 32 Council areas. In Orkney and Shetland all the council seats are held by Independents; in  Na h‐Eileanan an (Outer Hebrides) it is 21 out of 31; and in Highland 35 out of 80. I think the vote share will be fairly stable in May as well.


Labour in for a bigger thumping in Scottish Local Elections 2017 than polls suggest

The Labour Party are likely to suffer a bigger defeat in terms of seat losses than their drop in vote share. Under the Single Transferable Vote system if multiple candidates are on the ballot paper, then they split the vote. If there are more candidates on the ballot paper than is warranted by level of support (and number of candidates is greater than one), then too many candidates can result in less seats won. Recent opinion polls suggests Labour’s support is around half the level of 2012, yet in the councils where they are currently well represented, candidate numbers are about the same as existing Councillors, with multiple candidates in many wards. The Labour Party will suffer because they were not sufficiently ruthless in the face of cu

For local council elections Scotland adopted the Single Transferable Vote system in 2004. This May sees the third set of elections using the new system, the others being in 2007 and 2012. Under this system the local wards have a number of seats available. Just over half of wards have three council seats, with the rest having four council seats. But the majority of seats are in wards with four seats. There are up to five main parties (SNP, Labour, Liberal Democrats, Conservatives and Greens) and Independents fighting for those seats. The problem with trying to win a majority on a council is that the Party must try to win at more than one seats in every ward. But each voter only gets one vote, so multiple candidates of each party are competing for first preference votes with each other as well as candidates from other parties. If a Party believes that support is low in the area then they put forward just one candidate. If support is well over half of the electorate, then the Party might put forward three candidates, knowing that at least two candidates are likely to get elected. If the Party gets this wrong, and fields too many candidates, then its vote will be split. Most commonly fielding two candidates instead of one is a gamble. If got wrong the Party could either end up with either no seats instead of one. or one instead of two. This means a realistic prediction is necessary to optimize the number of seats. Elections Scotland has now published a candidate list for the forthcoming May elections. I have summarized the candidates per ward in figure 1.

The top section is a count wards where there a particular number of candidates. For instance in 27 wards the SNP have 3 candidates. The Green Party only has 1 candidate in each of 218 wards.

The middle section has the maximum council seats that a party can win, and the percentage of the 1223 council seats in Scotland. For the Independents the maximum seats is based on the assumption of only 3 seats per ward. Allowing for four or more candidates in four seats wards would make the theoretical maximum slightly higher.

The lower section gives the number of wards out of 354 with candidates and without candidates.

The results are surprising at first, particularly for the SNP who in the Scottish Parliament elections 2016 won 48.8% (63/126) of the seats, yet can win 51.3% of the seats available. Even allowing for about 14% of the vote in Local Elections going to Independents (source : Table 6  Lincoln Report on Report on Scottish Council Elections 2012) this appears to lack ambition. But comparison of the candidates to seats gained last time and position in the opinion polls in Figure 2 clarifies where the big anomalies lie.

The lower section of Figure 1 has been replaced by two more sections in Figure 2.

First is the seats won 2012 and the ratio of the maximum seats that can be won (identical to the number of candidates for the Political parties) to those seats won. In 2012 the SNP won 425 seats and in 2017 has 627 candidates. It therefore has a maximum seats to 2012 seats ratio of 1.48.

Second is the approximate value of recent opinion polls (less 14% to allow for the Independents)¹ and the ratio of maximum seat share to opinion polls share.

When comparing the figures between the parties the Liberal Democrats and the Greens do not really figure in the issue of having too many candidates. The comparison is between the three major parties.  It is here that the Labour Party clearly stands out. They have only got 15% more candidates standing in the local elections than Councillors elected in 2012. But, based on current opinion polls they have far more candidates standing as opinion poll ratings would suggest is ideal to optimize seat wins. The MSS / Polls ratio is partly exaggerated by the very low standing in the polls. But given that standing they should be adopting a similar strategy to the Liberal Democrats and the Conservatives. That is to only field more than one candidate in a ward where there is a reasonable expectation that the additional candidates will not compete against each other and lose seats. So why has Labour decided not defy the realities of the voting system? A strong reason is suggested in Figure 3.

In Figure 3 I have selected the 16 councils where Labour have (a) Candidates for at least a third of the seats available & (b) At least 10 Candidates. This is half the 32 councils in Scotland, but with 75% of Labour Council Candidates in 2017 and 82% of the seats Labour won in 2012. Numbers of candidates by council for the elections in May 2017 are compared with the seats won in 2012.

The number of candidates closely matches the seats won in 2012. This shows an expectation of winning significantly less seats in 2017 compared to 2012. However, it does suggest the reasons for adopting this strategy could be

  1. To promote the idea that Labour can still be the major party on the council, and be capable of a majority on 7 of these councils. This is especially important for Glasgow and North Lanarkshire, where Labour are currently in the majority.
  2. To help prevent second preferences being given to other parties.

However, if the Labour share of the vote on May 3rd is well below the 31.4% achieved in the local elections 2012, I predict the policy of aligning 2017 candidate numbers to seats held will result in a percentage of seats won will be significantly below the vote share. It is in those councils where Labour are currently strongest, the this disparity will be the widest. Top of the list of failures is likely to be North Ayrshire Council, where there are 17 candidates against 10 seats being defended. 

 Kevin Marshall


Notes

  1. I have assumed for General Election polling SNP 47%, Labour 15%, Conservatives 25%, Lib-Dem 6% and Green 4%. From the University of Strathclyde Scottish Opinion Poll Tracker the latest poll is for March 17. The figures are SNP 47%, Labour 14%, Conservatives 28%, and Lib-Dem 4%. Using these figures would make the Labour Candidate numbers even more out of line with the SNP or the Conservatives.


Local Elections Forecast for Wales May 2017

My forecast for the Welsh Council Elections in terms of percentage share of the vote compared to 2012 are Labour -7%, Conservative +3%, Independents +1%, Plaid Cymru +1% and Lib-Dems +1-2%. In terms of seats, Labour -150 to -160, Conservative +80, with the others gaining 70 to 80 seats.


My previous two posts looked at a forecast for the forthcoming local elections in the English County and Unitary Councils. On 4th of May there will also be significant local elections in Wales and Scotland. With respect to Wales, there is good background in a briefing at Britain Elects. Of note

  • All 22 councils are up for election. In 2012 there were 21 councils elections, with Anglesey (Ynys Mon) having its last elections in 2013.
  • There are 1234 seats for election, of which Labour hold 46 per cent and Independents hold 24 per cent.
  • Plaid Cymru are next with 14 per cent of seats.
  • Labour are the biggest party in 14 of the 22 councils and control 10, all in the South.
  • Labour gained over 200 seats in 2012 and control of 8 councils.
  • Independents are the biggest grouping on 4 councils, and form majorities in Powys and Pembrokshire.

To put this in a little more context, consider Wikipedia’s summary of the 21 council results from 2012, reproduced as Figure 1.

Compared with 2008, 2012 was a very good result for Labour. Their percentage gain in seats was about twice the 9.4% increase in the share of the vote. The biggest losses were by the Lib Dems, losing over half their council seats, but the Conservatives and Plaid Cymru also lost significant numbers as well. To put this in context, from LGC Elections Centre Report  “Local Elections in Wales 2008” – Colin Rallings and Michael Thrasher  I have reproduced two tables as Figure 2.

The Independents and Plaid Cymru appear to have fairly stable shares of the vote and numbers of seats. From 1999 to 2008 both Labour in Government slipped in its share of the vote, effectively regaining the 1999 in 2012. In the same period the Liberal Democrats held had the similar vote shares , but increased their number of seats. In 2012 they took a nosedive in both vote share and seats. The Conservatives made headway whilst in opposition, from a low base reached in the 1990s.

Recent Opinion polls

UK Political Info has General Election poll tracker going back to 2010. UK polls show fair stability from 2010 to 2016 when compared with the gap that has opened up after the EU Referendum. Labour were mostly ahead up to 2015, and regained the poll lead in the period around the Welsh Assembly elections in May 2016. At the time of the last elections in 2012 the Labour lead was 5-8% ahead of the Conservatives. After the Referendum Labour have trailed the Conservatives by an increasing amount. In the last couple of months that gap has been around 16-18%. It seems inconceivable that this huge should not have some impact on the Welsh local elections. ICM opinion polls for the Guardian split out the poll for Wales. This component is usually questioning less than 100 people, and shows highly variable results. However, in the six polls so far this year, the gap between Labour and Conservatives is far smaller than in the actual result in the local elections of 2012, yet there are no Independents. However, local factors may play a big role.

Forecast

In this forecast I will make some bold assumptions and give some fairly precise figures. In so doing any variances from my estimates can give a greater understanding of the underlying changes in a period of political turmoil. I will proceed in ascending order of impact.

UKIP are unlikely to gain any seats, despite grabbing 12.5% of the vote and 7 regional seats in the Welsh Assembly Elections just 12 months before. See Table 1. The party is in turmoil following the resignations of its only MP Douglas Carswell and AM Mark Reckless crossing to the Conservatives.

The Liberal Democrats slipped quite badly in 2012. They may gain 1-2% of the vote share and 20-30 seats. They may do quite well in Cardiff and Swansea, where they already have a few seats, and where there was quite strong support for Remain in the EU Referendum.

The Independents and Plaid Cymru  I expect to gain respectively a 23% and 17% share of the vote and 300 and 200 seats. These are small gains of about 25 seats each if Ynys Mon is included.

The leaves the two large Westminster parties to share just under half the vote, if the minor parties are included. Like in previous Welsh local elections I expect to the greatest volatility being between Labour and the Conservatives.

Based on the National opinion polls I forecast the best result for the Conservatives in over twenty years, achieving 16% of the vote and a gain of about 80 seats. This is only fractionally higher than in 2008.

By difference I forecast the Labour Party to see a reduction in their vote share of 7% to 29%, and the loss of 150-160 seats.

The Forecast in context

There are two ways to look at the forecast. First in relation to other forecasts and second in relation to opinion polls.

Conservative peer Robert Hayward has forecast across In England for Labour to lose 125 seats and Conservatives to gain about 100. I have forecast Labour to lose more and the Conservatives gain slightly less in Wales with half the number of seats being fought over. Yet in the context of the change between 2008 and 2012/3, the change is smaller. I forecast Labour to lose two-thirds of the gains they made in the previous elections. Yet the party is more unpopular than in 2008, and also quite split over policy and direction the party should take. In no other major political party would nearly 80% of elected representatives vote no confidence in the leader and then a few months down the line both those representatives and the leader still hold office, carrying on as if nothing had happened. Conversely the Conservatives are more popular than in 2008, and have a confidence, sense of purpose and party unity that is stronger than at any time in the last 30 years.

Kevin Marshall


Is the Rawlings and Thrasher English Elections Forecast a bit timid?

At the weekend I posted my forecast for the English council elections to take place on May 4th, using a comparison with opinion polls both now and 2013, along with the forecast made by Harry Hayfield at Political Betting.

On Sunday, The Times published a forecast from Colin Rawlings and Michael Thrasher, both Professors of Politics at the University of Plymouth.

Again they use local by-election results a a basis for their forecast, and come up with similar results to Hayfield for the Lib-Dems (+9%) and UKIP (-12%). The biggest difference is with Labour, predicting no change, as against -4% for Hayfield. More relevant is the forecast for seats, where they predict Conservative +50, Labour -50, Lib Dem +100, UKIP -100

Despite these chaps having considerable experience of election data, having written a number of post-election reports for the Electoral Commission, I believe that their forecasts might be somewhat out. This I have split into share of the vote and seat predictions.

Rawlings & Thrasher share of the vote prediction

I have summarized some data in figure 1.

Rawlings & Thrasher base their forecast on the Notional National Change, so I have shown the difference between those figures and the General Election Opinion Polls. There are reasons why the local council elections are different from the opinion polls, aside from the fact that opinion polls may not fully reflect actual decisions.

In 2013 UKIP benefitted in the local elections as people used their vote as a protest against the Coalition Government and/or in support of an EU Referendum.  That no longer exists as Brexit is underway; whilst UKIP is in disarray and has fund-raising issues. In this I would agree with Rawlings and Thrasher in a huge drop in support for UKIP, swinging from outperforming the opinion polls, to underperforming.

With the Liberal Democrats, I would agree that they should not only outperform the opinion polls, but do so by a greater margin than in 2013, when being in Coalition Government damaged their brand as being the alternative to the Conservatives in the non-socialist areas. This year they may also benefit as being the Party of those most opposed to Brexit. But the actual share of the vote was 20%. For the notional share of the National Vote to rise nine points would indicate a larger rise to over 30% of the actual vote. It would effectively make the arch-Remainers effectively the biggest beneficiaries of the fall in support for UKIP. That is possible, but would imply very large underlying switches in effective party support. Also, this large net increase in Lib-Dem vote share would be despite no net movement in the general election opinion polls in the last five years. Even if local by-elections results indicate such a swing, when voting for full councils I do not believe that this will replicate this result.

The forecast for Labour to have no change from 2013 is perhaps the most out of line with reality. Just four years ago Labour seemed likely to be in a position to be win the 2015 election. Now they are 13 points lower in the opinion polls. Most of the councils concerned are in the Conservative heartlands, with Labour traditionally trailing in third place. They thus have less far to fall than nationally, but barring a miracle in the next four weeks, they will lose vote share.

By difference, this leaves the Conservatives making much larger gains that 5% of the Notional National Vote.

Rawlings and Thrasher seat change predictions

This I think is the most timid part of the seat changes to repeat they are

Conservative +50, Labour -50, Lib Dem +100, UKIP -100

Prof John Curtice on the Sunday Politics thought, based upon a 12 point swing in the opinion polls, Labour could suffer a much bigger loss of seats than the 50 forecast by Rallings and Thrasher. (hattip Guido Fawkes)

But to get an idea of the likely level of seat changes, it is worth looking at the changes in the similar (but not quite identical in terms of seats and councils) council elections in 2009 and 2013. These, from Wikipedia (here and here) are shown in Figure 2.

Please note that the numbers do not quite stack up due to (a) one more council in 2013 (b) boundary changes (c) by-elections. But broad comparisons can still be made.

UKIP gained 139 seats in 2013. The swing from 2009 to 2013 was probably greater than the counter swing they will likely suffer next month, so the loss of 100 seats is a reasonable estimate.  Similarly the Lib Dem estimate of 100 seats gain seems about right, despite the likely net change in fortunes maybe be less at a National level not likely nearly countering the loss in popularity between 2009 and 2013.

When it comes to Labour, they are nationally in a worse position than in 2009. So their loss of seats could be greater than then suffered in 2009. A reduction of 300 seats, or nearly 60% of the defended seats, seems a reasonable forecast, with a 200 seat loss or less being a relatively good night for Labour with their current unpopularity.

The Conservatives should easily be the biggest gainers. Most of the councils are in Conservative Heartlands. Others, like Lancashire and Derbyshire, are where they have managed majorities in the recent past. Yet in 2013 the Conservative share of the vote was below that achieved in the UK as a whole in the General Election just two years later. Two years after the General Election, the party is in a considerably stronger position, so should gain considerably. A gain of 300 seats is my forecast.

Final points

An aspect to consider in local elections is the impact of turnout. In their report on the 2013 English and Anglesey Council Elections, Rawlings and Thrasher noted that turnout was 31%, compared with over 39% in 2009.

In the similar 2009 report they note that this turnout was higher than in the previous three years.

Could the relatively high turnout be due to the confidence of Conservative voters? In 2009 the Conservative vote was 44.5%, 10% higher than in 2013. Labour had a 12.7% share (over 8% lower) and Lib-Dems were at 24.9% (5% higher). Then the Conservatives were a year away from going back into Government. In 2013, they looked like reverting to opposition. In 2017, there is a new sense of optimism among Conservative supporters, not seen since the end of the Falklands War – or at least with their Brexit supporters. These are concentrated in the middle-aged and older people, among whom turnout is usually higher than in the population at large. On the other hand, the Labour-supporting Remainers might stay at home, being doubly-demoralised. The change in seats could be even bigger than in either 2009 or 2013.

These are of course my forecasts compared with those of others who have more experience in these matters. What is crucial is how analyzing the difference between forecasts and actual results can deepen our collective understanding of what is happening in an interesting period in British history.

Kevin Marshall


Local Elections Forecast May 2017

At Political Betting Harry Hayfield has produced a forecast for the County Council elections in May 2017, just six weeks away. I have long followed this blog, though I neither bet nor follow the politics of the blog propriotor Mike Smithson (Lib-Dem & Pro-Remain on Brexit). However, it is the very differences that provide an alternative perspective. Harry Hayfield’s basic assumptions County Council elections in England are:-

In the local by-elections, areas that voted REMAIN saw the following change:
Con -9%, Lab -4%, Lib Dem +12%, UKIP -12%, Greens 0%, Ind -10%, Others +23%
Where as areas that voted to LEAVE saw the following change:
Con +4%, Lab -4%, Lib Dem +7%, UKIP -9%, Greens +1%, Ind +4%, Others -3%

With any forecast there is a lot of work involved in converting these into seats. Any baseline, when compared to the actual results will help develop an understanding of both of National opinion in turbulent times and also how it impacts at the local politics. What I would note is that the Counties are mainly Conservative territory; has a large Independent / Other representation (though this has been declining for decades); and is predominantly Remain voting, but not extremely more than the UK average.

But that said Harry Hayfield’s forecasts seem to be at odds with the opinion polls. Taking the UK Polling Reports opinion poll figures for (a) 28/04/13 to 10/05/13 and (b) 05/02/17 to 19/02/17 (the latest available) the change in voting intention is about

Con +11%, Lab -13%, Lib Dem +0%, UKIP -2%, Greens +2%.

Since then the Conservatives and Lib Dems at improved slightly at the expense of UKIP and Labour. The latest YouGov figures, for 25-27 March,  are

Con 43%, Lab 25%, Lib Dem 11%, UKIP 10%

And the change on 2013 are about

Con +13%, Lab -14%, Lib Dem +1%, UKIP -4%

The actual share of the vote – skewed by being counties – was

Conservative 34.3%, Labour 21.1%, UKIP 19.9%, Lib Dem 13.8% and Green 3.5%

therefore – Other 7.4%

In terms of the County Councils, perhaps 85% were for Leave in the EU Referendum, on the basis that maybe three-quarters of Parliamentary Constituencies in in England and Wales voted for Leave, and most of the Remain vote was in the Metropolitan areas. So why should the Conservatives only improve by 4% in most of the Council areas on 2013 when they are 13% up in the opinion polls nationally?

Harry Hayfield’s assumptions diverge from the opinion polls from being based upon recent by-elections nationally. That is upon a maybe half a dozen by-elections a week, These one-off events usually have low turnouts, and are highly impacted by protest votes.  The biggest reason for protest votes at the present time is the Brexit issue. It will have an impact on the local elections, with the Remain protest vote being stronger than the Leave support vote. But this will be much less than in by-elections due to (a) higher turnout due to area-wide elections (b) higher turnout on average as the counties tend to have higher turnout than the Metropolitan areas (c) the protest vote is concentrated in the cities, especially London. The latter is evidenced by the two recent very large petitions to change the referendum rules after the EU referendum and to cancel the State Visit of President Trump.

That said, using by-election results is a as good as any considering the political landscape has changed dramatically in the past four years. By using clear assumptions on forecasts it is possible to understand where they go wrong. But that understanding will be only on the empirical differences between forecast and actual. What I will now do is to give a forecast based on reasons (maybe my unfounded opinions) with some notes on the parties. This might muddy the waters a bit, but here goes.

For UKIP 2013 elections were a “game-changer“, to use Nigel Farage’s term. UKIP then got nearly double the share in the County vote as in the National opinion polls. A party campaigning on a single national issue made huge gains on votes at local government level. The 20% of vote share was a precursor to the 26.6% in the European Parliament elections achieved in 2014.  This impact is now gone, and the grassroots support needed to field and promote thousands of candidates may have diminished due to internal strife. Local by-elections may not fully reflect this impact, as they can concentrate their much reduced resources. UKIP’s share may go below the National Opinion polls. On these grounds I will go for a -13% change on 2013, giving UKIP 7% of the vote.

The Liberal-Democrats, are usually the main opposition to the Conservatives in the Counties and also usually perform much better than in General Elections. In 2013 they were in Coalition with the Conservatives, which severely damaged their standing as a local opposition. The 13.8% of the vote was 3-4% ahead of the opinion polls. This margin might not be much more than in previous 20 years, but in those years the Lib-Dems were doing much better nationally. Any bounce I believe will be mostly due to being the respectable face of hard-line opposition to Brexit. This could be bet positive, but put some folks off voting for them on local issues. I would guess at an increase of 5% giving the Lib-Dems 19% of the vote.

The Labour Party cannot fall nearly as far in the English Counties, where support is much lower than the national average. At the end of April and beginning of May 2013 they were polling 38-39% nationally, but achieved 21.1% of the vote. Will they still fall? In 2013 they managed to overtake the Lib-Dems with 538 to 352 seats, as against 247 to 476 in 2009, so the 21.1% was actually an improvement. Nationally Labour are doing worse (or at least no better) than in 2009. What is more, they have lost a lot of their working class base, which would have formed some of the core support in the Counties. I would estimate a 5% fall.

The Independents were once a major contingent in local politics, but only achieved 7.4% of the vote in 2013. How will this go? I would hope for an increase as people vote again for local representatives based on local issues. With the decline of UKIP, and maybe the Lib-Dems tarnished in the eyes of some for going very anti-Brexit, I think they may gain ground to around 10%. The Greens maybe the same.

By difference, the Conservatives will have a 11% increase in the vote share to 45% of the vote share. This is fairly similar to the change in national opinion polls over the last four years (from 30 to 41%). Indeed, it might be a low estimate, as in 2013 the Coalition Government was suffering from normal mid-term blues. At present, the Government is in the unusual position of being significantly more popular than when elected.

So, in conclusion, Harry Hayfield’s estimate was as follows

In the local by-elections, areas that voted REMAIN saw the following change:
Con -9%, Lab -4%, Lib Dem +12%, UKIP -12%, Greens 0%, Ind -10%, Others +23%
Where as areas that voted to LEAVE saw the following change:
Con +4%, Lab -4%, Lib Dem +7%, UKIP -9%, Greens +1%, Ind +4%, Others -3%

The LEAVE areas are at least 5 times more than the REMAIN areas. My estimate, for all English areas with a complete council elections in 2013 & 2017 is as follows.

Con +10%, Lab -5%, Lib Dem +5%, UKIP -12%, Ind/others +2%.

It is the actual results that will matter, and possible lessons to be learnt during a time of massive change in British politics.

Kevin Marshall