An outcome of the expenses scandal in 2009 both the Conservatives and Liberal Democrats had pledged in their 2010 manifestos to reduce the number of constituencies. The outcome was Schedule 2 of the Parliamentary Voting System and Constituencies Act 2011, with the reduction from 650 to 600, along with a review to achieve more equal constituency sizes. The Boundary Comission published its initial recommendations in 2016, then, following extensive consultations, published revised recommendations in 2018. Given the historically low esteem with which the House of Commons is currently held, and the deadlock on the Brexit issue, perhaps there should be a coming together in the House of Commons to enact these changes to show that they can work together to produce a more level playing field in general elections. The main block on such changes is that greater fairness will lead to shifts in the makeup of Parliament.
2018 Review Changes by Region
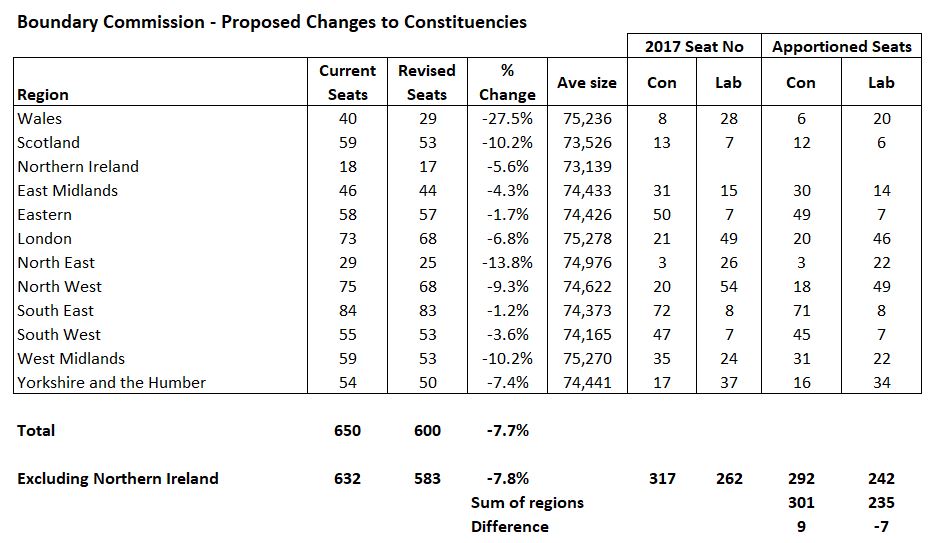
The Boundary Commissions 2018 recommendations, published on 05/09/18 are spread across sites for Wales, Scotland, Northern Ireland and England. Using the results of the 2017 General Election I constructed a table to show the proposed constituency changes by region.
Figure 1 : Proposed Constituency Changes by Region. Additionally is an apportionment of the seats won by Conservative and Labour at GE 2017 on a national and regional basis. As the decrease smallest decreases in seat numbers tend to be in the regions where the Conservatives are stronger, GE 2017 fought on the new boundaries may have given the Conservatives an majority.
All regions will lose seats in the proposed boundary changes, but the proportionate changes vary considerably. Wales will lose over a quarter of its seats, going from 40 to 29 seats. At the other extreme, the South East, which is already the biggest region, will lose just one seat. The result of implementing the changes would make the average number per constituency across regions far more equal than currently. It should be noted that both Scotland and Wales will still have broadly the same representation per capita in Westminster as England, despite having devolved parliaments.
More detailed analysis from Electoral Calculus
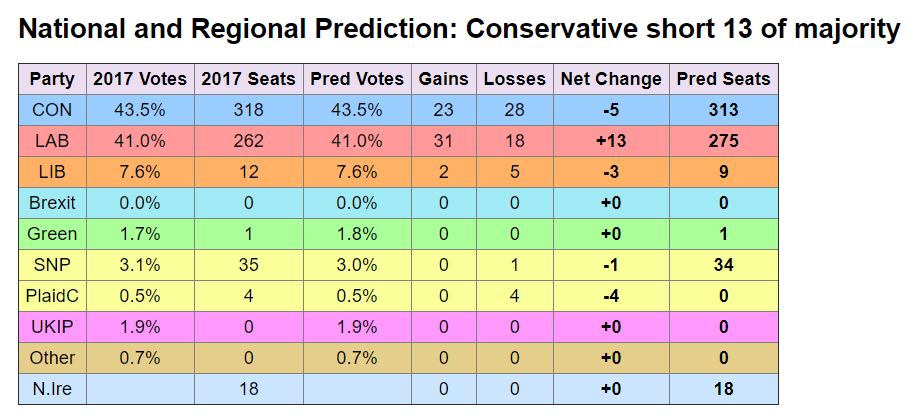
The above gives a general high level impression. The Electoral Calculus website provides a far more detailed analysis through its “Make your Prediction” tool. I first plugged in the results of the 2017 election for the major parties based on the 2017 boundaries at regional level.
Figure 2: Electoral Calculus prediction for 2017 General Election based on 2017 boundaries. The Speaker is included in the Conservative Party Numbers
This fairly accurately produces the 2017 result at the top level with a hung parliament. The predictor slightly overstates the Labour seats, fails to predict any seats for Plaid Cymru and understates the Lib-Dem seats for the same reason. That is the support for the parties is more concentrated than the program allows. Plugging in the national results produces the prediction of a small Conservative majority, much for the same reason. The program does not properly allow for concentrated regional or local support.
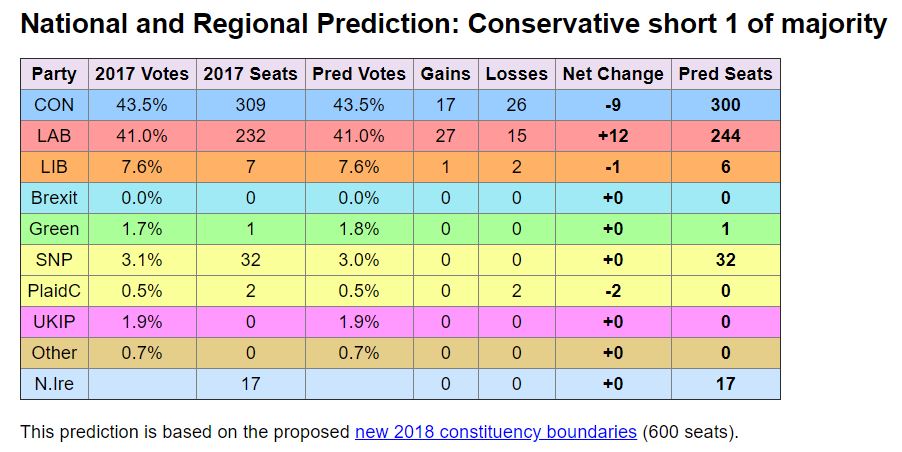
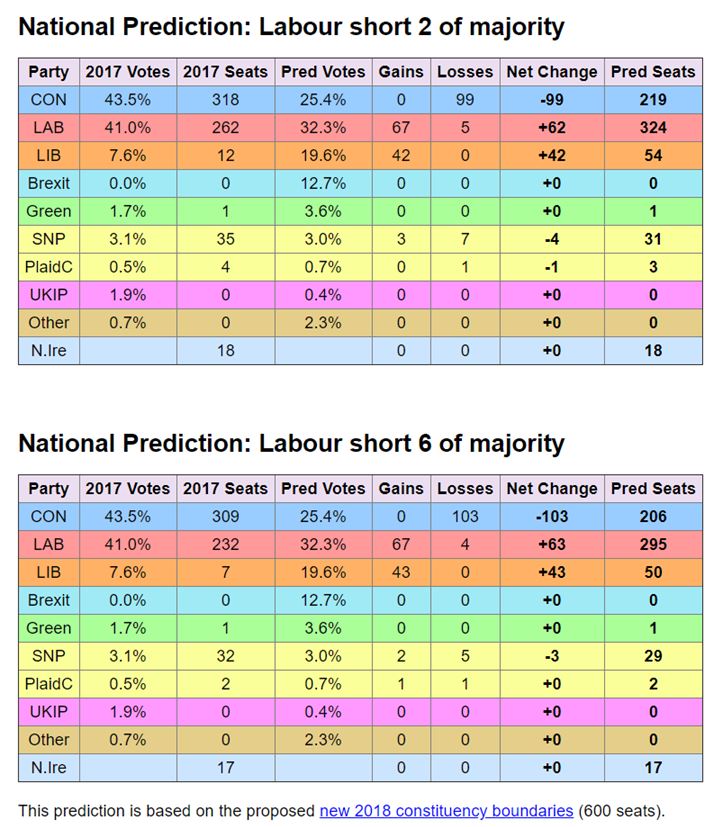
More interesting is the prediction based on the 2018 boundaries with 600 seats.
Fig 3 : Electoral Calculus’s estimate of the 2017 General Election result against an estimate based on regional party vote share.
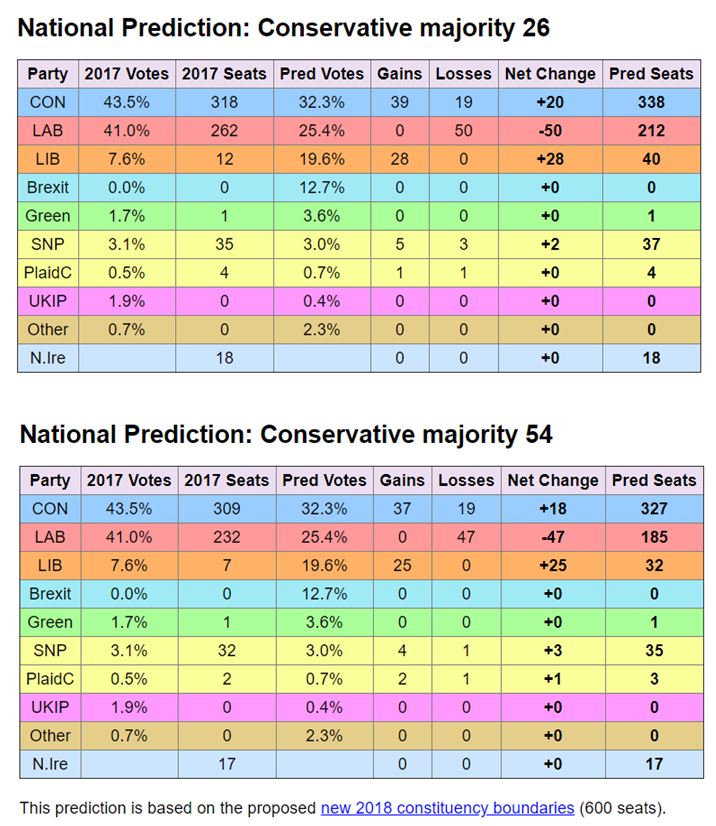
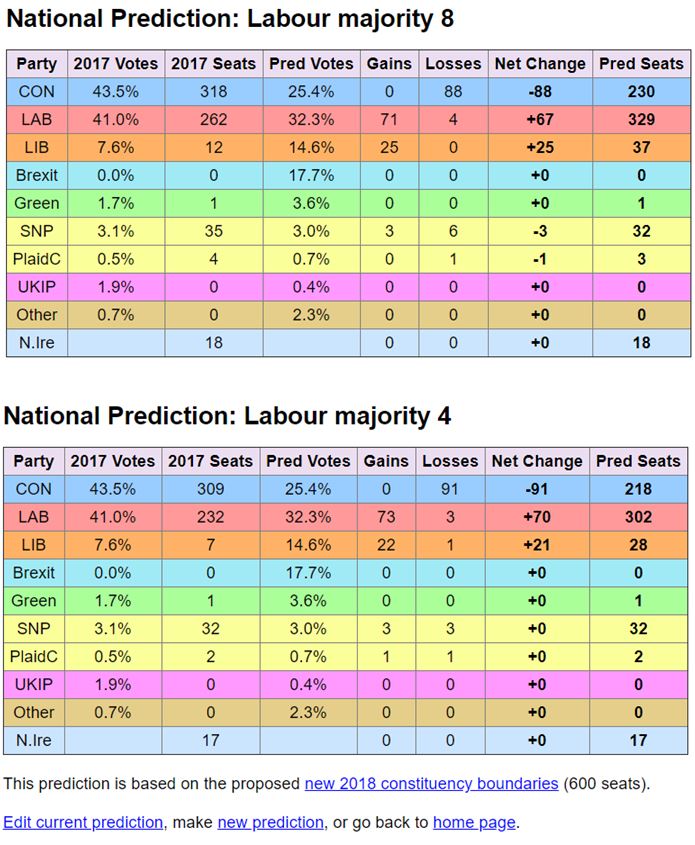
The detailed Electoral Calculus analysis predicts the Conservatives would have been just one short of a majority if the 2017 General Election has been fought on the 2018 600 seat boundaries, or two short if the Speaker is excluded. The national predictor shows a majority of 12. These figures are very similar to my rough estimates above, with a slight Conservative bias in top level forecasts. Given that both the main parties have seen losses of MPs, on these figures neither would see a large net loss of sitting MPs, provided that both Labour and Conservatives were in a similar position in the polls to 2017. However, this is not the case. Electoral Calculus, based on opinion polls from 03 Sep 2019 to 27 Sep 2019, predict a Conservative majority of 12. Plugging in the national vote shares into the predictor, I get a Conservative majority of 26. Using the 2018 Boundaries, with 600 seats the majority increases to 54. Conservative seat share rises from 52.5% to 54.0%, whilst Labours seat share falls from 32.6% to 30.8%. A more level playing field works in the Conservatives favour. However, the bias in the predictor means that the difference is likely smaller.
Fig 4 : Based on opinion polls from 03 Sep 2019 to 27 Sep 2019, Electoral Calculus national GE predictor based on current 650 seat parliameny and 2018 constituency boundaries
However, voting for fairer boundaries should not be based on immediate polling. One would hope that HM’s Official Opposition would have ambitions of winning and election in the future. What would be the impact of swapping the poll positions of Conservatives and Labour? Figure 5 does just that.
Fig 5 : Same assumptions as fig 4, with the exception that polling positions of Conservatives and Labour are reversed.
If the polling positions of Conservatives and Labour were reversed then the Labour Party would be in a similar position to under the existing system and under the 2018 constituency boundaries with 600 seats. This is however a likely scenario under the current circumstances. Allowing for a Conservative bias in the Electoral Calculus estimates, Labour would likely obtain an overall majority. If Conservative votes fell away, they would mostly go to the Brexit Party, whilst gains for Labour would come from the Liberal Democrats. In the final figure I also assume that the Brexit Party are up 5% and the Lib Dems down 5%.
Fig 6 : Same assumptions as fig 5, with the exception that Brexit Party are up 5% and Lib Dems down 5%.
This marginally improves Labour’s position at the expense of the Lib Dems, sufficient to gain a slim overall majority. Again, allowing for the Conservation bias in the figures, the majority would be less marginal.
The Labour party bias under the current boundaries
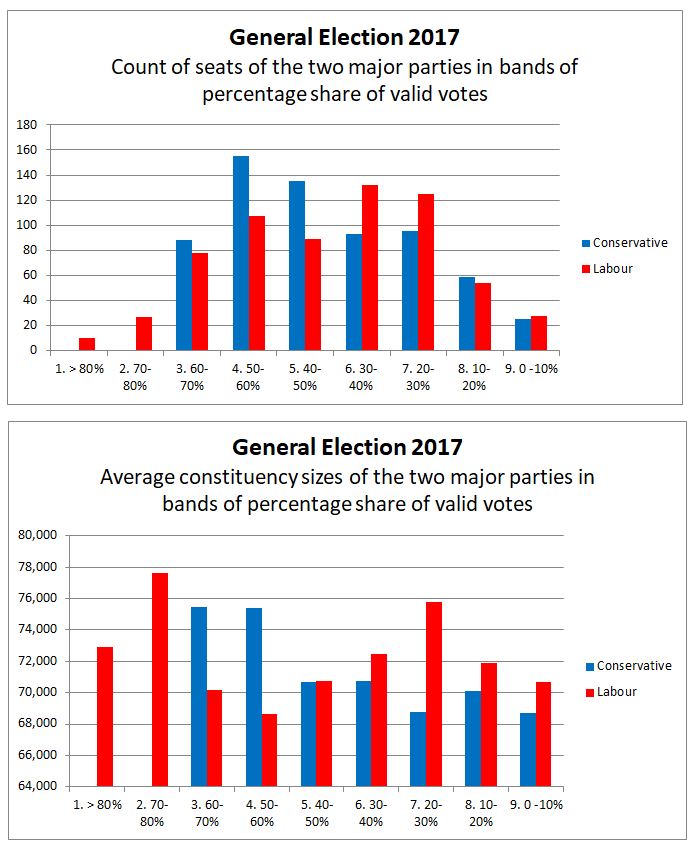
Although the Electoral Calculus figures have a slight Conservative bias, the Boundary Comission changes will favour the Conservatives over Labour. Figure 1 indicates part of the issue. In Wales, the North West and the North East are regions have both larger than average falls in the number of seats and where Labour have a clear majority of the seats. Conversely in the Eastern, East Midlands, South West and South East Regions have both much smaller than average falls in seat numbers and where the Conservatives have a clear majority of the seats. The current constituency boundaries have a Labour Party bias that will be rectified. I have created a couple of charts from the General Election 2017 results, one of which amplifies the current Labour bias in the voting figures.
Fig 7 : From the 2017 General Election results, bands of the percentage of valid votes gained by each party. The upper chart is the count of seats in each band. The lower chart shows the average constituency size.
In 2017, the Conservatives achieved at least 50% of the vote in 243 seats. For Labour it was 222 seats. The Conservatives gained 40-50% of the vote in 135 seats, winning 71. Labour gained 40-50% of the vote in 89 seats, winning 35. The problem for Labour is that their vote is more highly concentrated than the Conservatives. Thus they need a higher share of the national poll, on a uniform swing, to gain a parlimentary majority than the Conservatives under current boindaries. Put another way, on average the Conservatives gained 55.46% of the valid vote in the constituencies they won, whereas Labour gained 59.33%. Of course the greater spread of votes across constituencies works in the Conservatives favour in winning elections, but against them relatively if party support drops below 25%. Conversely the current boundaries work in Labour’s favour in the event of a poll collapse, but it is mostly due to their concentrated support.
The lower chart illustrates the problem for Labour from the boundary changes. Whereas the average constituency size where the Conservatives recieved > 50% of the vote in 2017 is 75,400, for Labour it is 70,500. Under the 600 seat Parliament, whereas the Conservatives would retain 243 such seats, Labour would expect to only recieve 208 seats, a loss of 14. For the seats gained with less than 50% of the vote the Conservatives would expect to go from 74 to 71, whilst Labour from 40 to 38. Thus in a 600 seat parliament the Conservatives would expect to have 314 seats, as against 317 seats in a 650 seat Parliament. Labour would go from 40.3% of the seats to 41.0% on the same rough calculation.
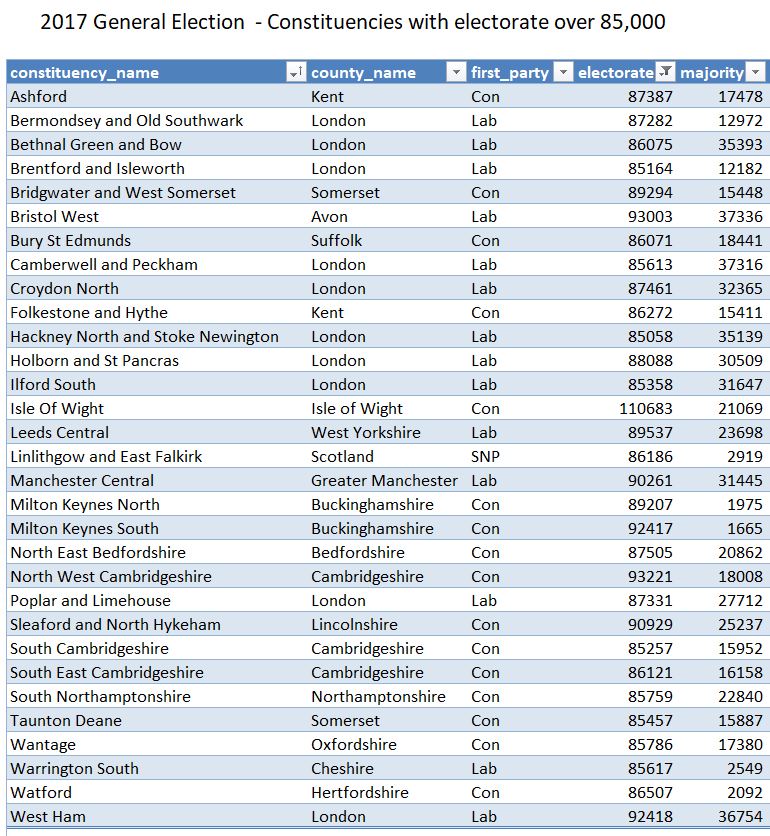
Finally, there is another paradox. Although, on average, Labour constituencies have a smaller electorate than Conservative ones, of the 31 seats with an electorate over 85,000, 14 are Labour. There are three Labour seats with over 90,000 voters – Bristol West, West Ham and Manchester Central. It is not an even picture across the country.
Concluding Remarks
It is now eight years since legislation was passed to reduce the number of constituencies from 650 to 600, along with making them more equal in size. Had the 2017 election been faught on this more level playing field it is most likely that the Conservatives would have been returned with a small majority rather than losing that majority. The impact of enacting the changes would be to counter the relative discrimination that much of the South and East of England has in general elections due to having larger average constituencies. Most of all it would be of benefit to those in the 31 constituencies with over 85,000 voters, listed below.
Fig 8 : The gemeral election 2017 results for the 31 constituencies with electorate of over 85,000.
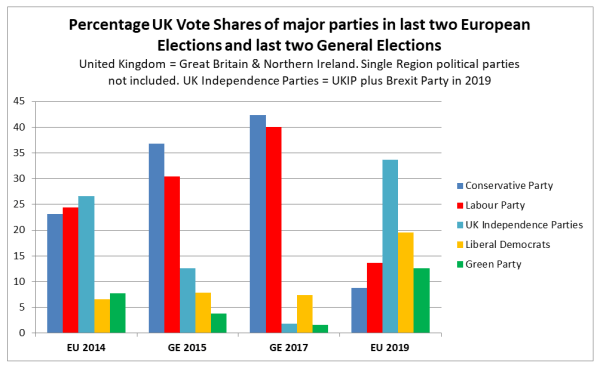
My previous post looked at the implications of the May European Election Results for a future General Election. At Capx Matt Singh takes a similar approach in Does first past the post still favour Labour and the Tories? https://capx.co/does-first-past-the-post-still-favour-labour-and-the-tories/ The conclusions are slightly different to my own but it is worth comparing and contrasting Singh’s analysis and my own.
Matt Singh just looks at the May results, whereas I also look at the 2014 European Election results and the following General Elections in 2015 and 2017. This is my Figure 1
Fig 1 : Vote share of major parties in four recent UK elections
Matt Singh concentrates on the current polling data showing the four parties on roughly equal voter share. I agree with his statement
(O)n current vote shares, no party would be anywhere near an overall majority. If we put all four main parties on 21 per cent, the assumptions detailed above would put Labour on around 180 seats, the Brexit Party on around 160 seats, the Lib Dems on roughly 130, the Conservatives down to about 100 and the SNP in the 50s.
That is on equal vote shares the Labour Party would gain the most seats, with the Conservatives the least. Further, I agree that for the two major parties …..
…. dropping too far into the teens could see Labour or Tories being decimated, with seat numbers dropping into the double digits. Labour would have a degree of protection, because its enormous majorities in its safest seats would save it in many cases. But the Tories really would be staring into the abyss.
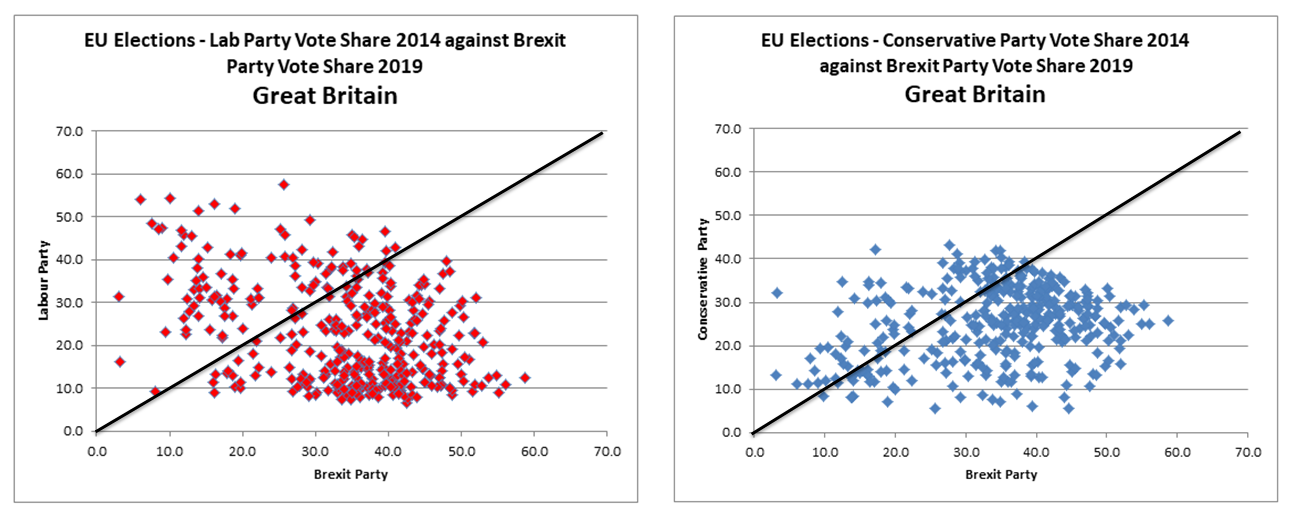
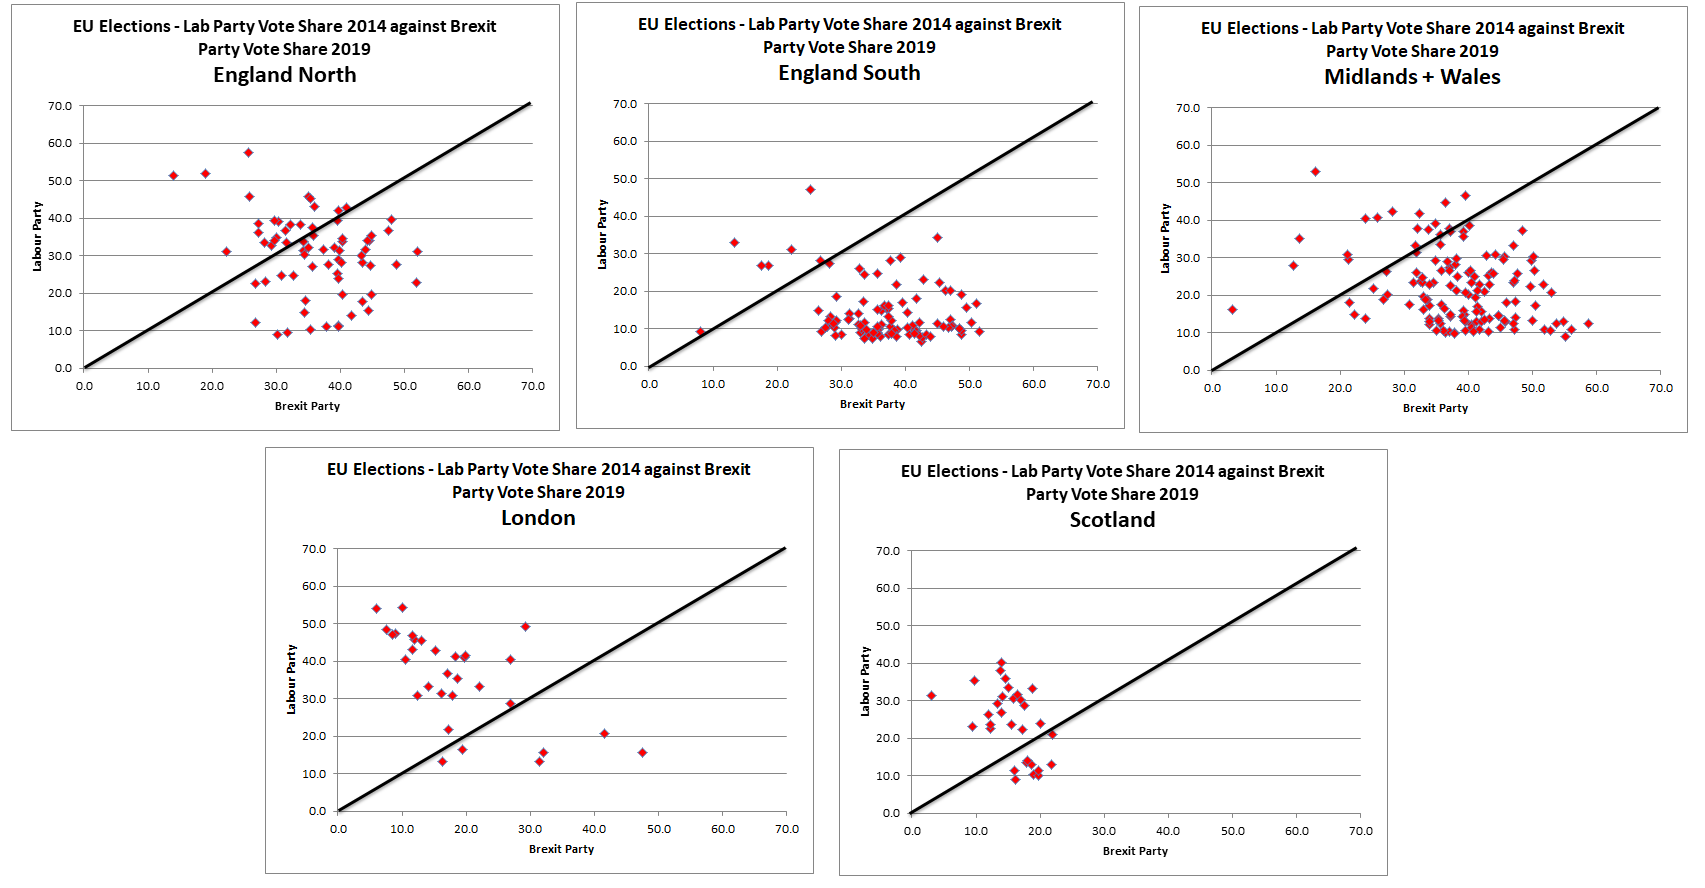
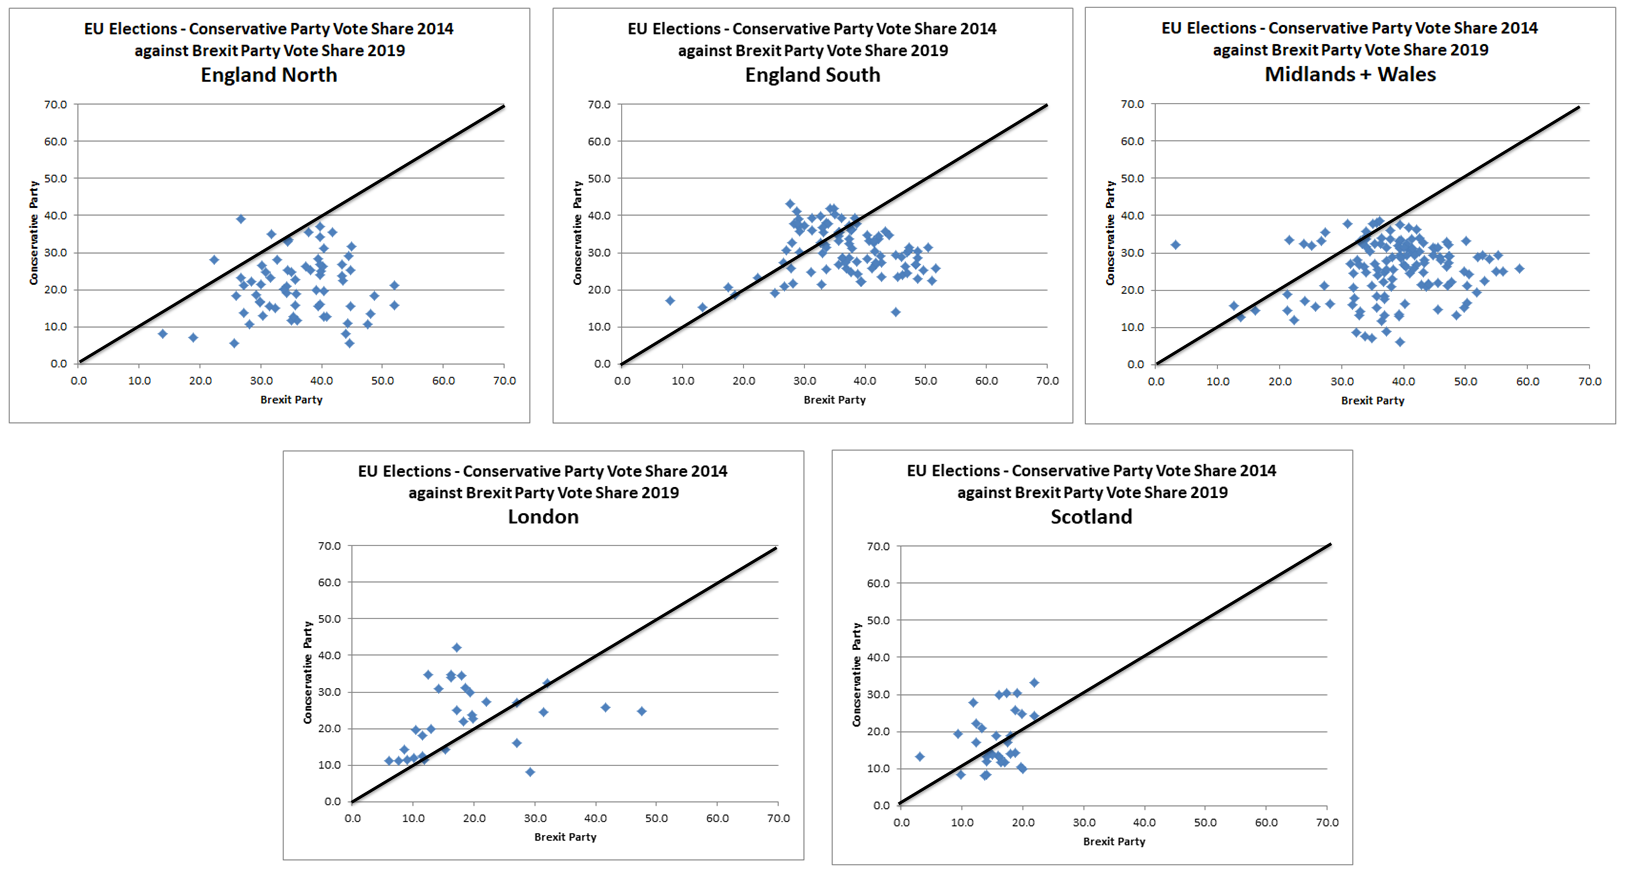
I also looked at the council area results by four or five regions of Great Britain. That is Northern England, Midlands/Wales, Southern England, London, and Scotland. The latter two I lumped together as they had stood as out as sharing opinions on Brexit different from the other regions.
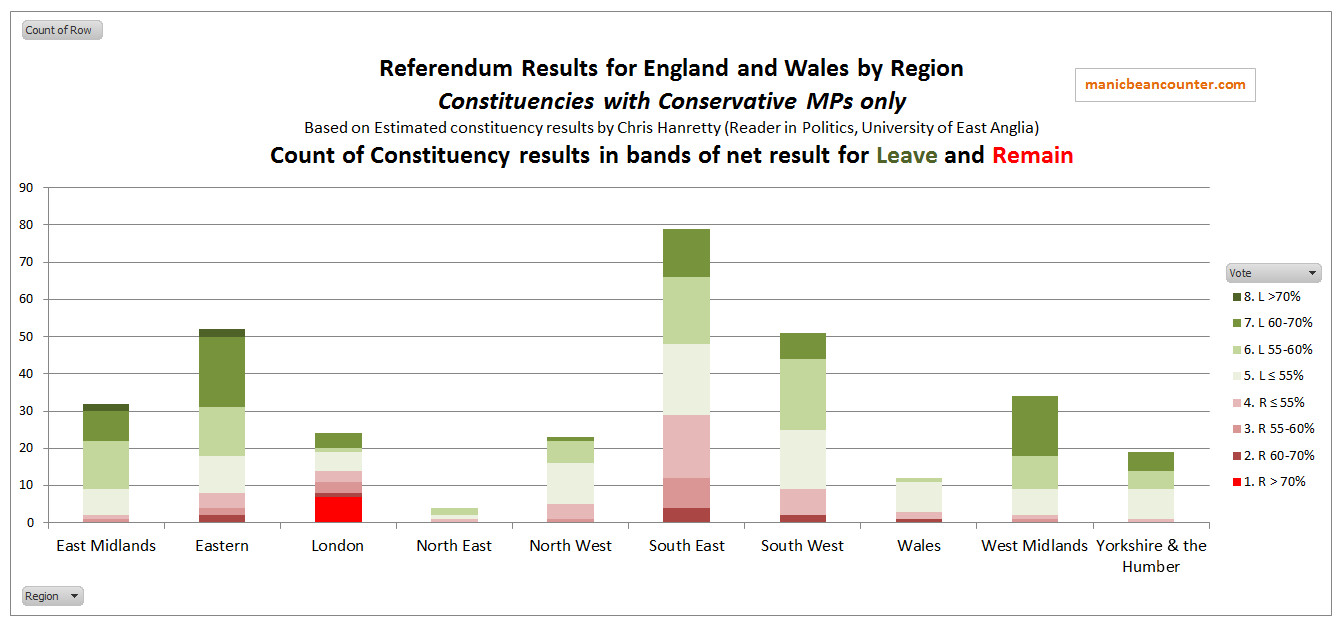
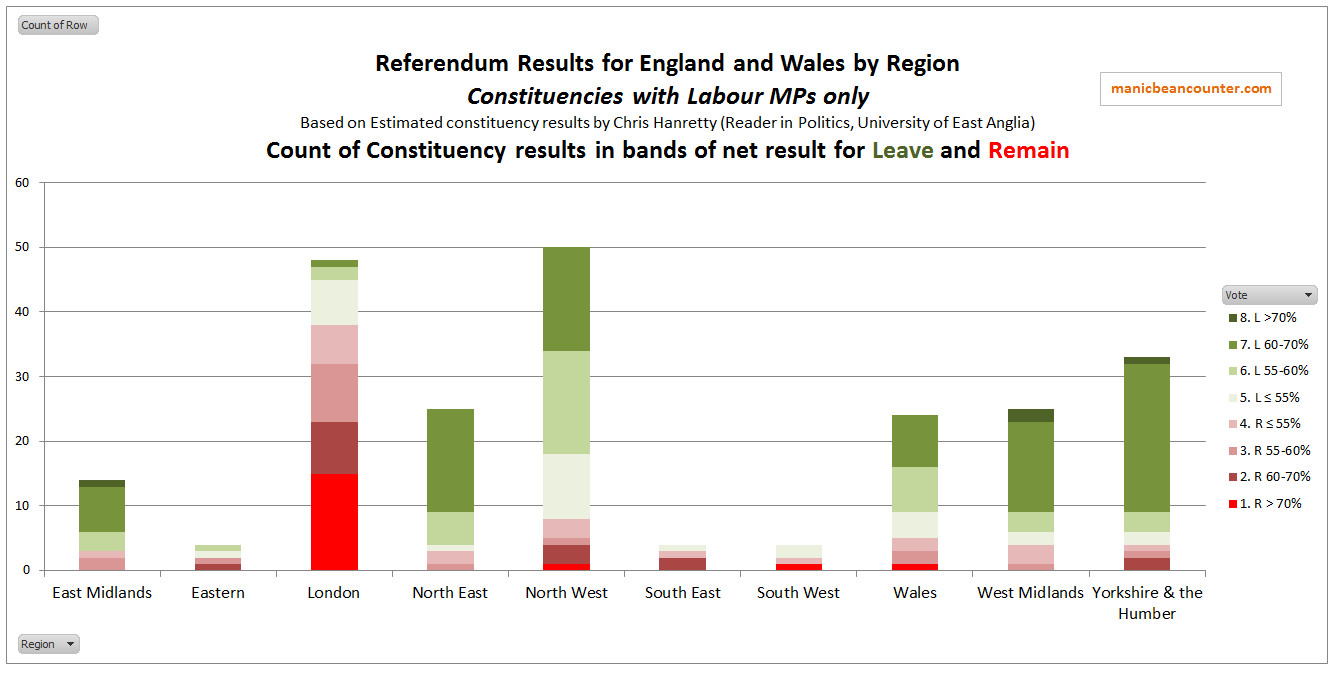
Matt Singh used data from Professor Chris Hanretty, who has estimated the European election results by constituency from the results by council. The two key tables, (under the banner of Number Cruncher Politics) are as follows
Fig 2 : From the Capx.co article
Fig 3 : From the Capx.co article
These two charts show why the Tories are more vulnerable to a complete meltdown than Labour, as the latter have much stronger support in the ninth and tenth deciles. Singh does not draw the corollary conclusion. That is, based in even swings, to form a majority Government the Tories need to achieve a lower national vote share than Labour to achieve an overall Parliamentary majority. This is important. Hanretty’s charts are with 2019 UK vote shares of 9.1% for Conservative and 14.1% for Labour. To win a General election majority it is important to be ahead of the major opposition in the 5th and 6th deciles. In these areas, Labour were behind the Conservatives in the EU elections despite the 5 point lead overall. In addition, I attempted to go beyond the numbers to look at the impact of positions on Brexit. Both the Conservatives and Labour were punished in the Euro Elections for their vague positions on Brexit. The Conservatives for failing to exit the EU due to the failure to obtain anywhere near majority on the Withdrawl Agreement. Labour for being nominally pro-Brexit, but putting on onerous conditions that would see Britain end up remaining in the EU. Both parties lost out to those Parties with much more strident positions on Brexit. The Conservatives lost out mostly to the Brexit Party. Labour lost out to the Pro-Remain Liberal Democrats and the Green Party, along with the Plaid Cymru in Wales and the SNP in Scotland. The Conservatives lost out to Remain parties less than Labour lost out to the Brexit Party. In the last week, Boris Johnson – likely the next Prime Minister – has come out with a strong pro-Leave position that would grab votes from the Brexit Party in a General Election. Conversely, the Labour Party leadership is divided over whether to make Labour a Pro-Remain Party. If it did, Labour might gain some votes from a number of Remain parties but would lose votes to the Brexit Party, or the Conservatives. The Tories are thus in a much better position to achieve the 30% vote share / 10 point lead to win an election than Labour.
In the May 2019 European Elections the Brexit Party were clear winners, with the Liberal Democrats a respectable second with near 20% of the vote. The two major parties were both punished by the voters – the Conservatives for failing to deliver Brexit and Labour for sitting on the fence. Analysis of the results by council area indicate
Labour Party support is more concentrated that the Conservative support and has huge divides in terms of support for Brexit.
Conservative support is more thinly spread and concides with both Brexit Party and Lib Dem areas.
Strong anti-Brexit vote split between Lib Dems, Greens, SNP and Plaid Cymru, whilst pro-Brexit support concentrated in the Brexit Party.
Change UK and UKIP had low support and have faded since.
The data strongly suggests that the Conservative Party are the most vulnerable to complete annihilation as a major player, but are the one’s who will be the net gainers with a clear Brexit policy. A No-Deal Brexit platform could see the Tories win a landslide, even with little over a third of the popular vote. A clear Remain platform for Labour could improve their current poll ratings, but is both unlikely under the current policy and would be insufficient overtake a Tory Party with a clear Brexit Policy.
Introduction
The United Kingdom of Great Britain & Northern Ireland is anything but united. The country as a whole and Parliament is deeply divided over Brexit, with a majority unable to be reached for any outcome. Prime Minister Theresa May has resigned the leadership of the Conservative Party with a large field of candidates vying to replace her.
The Prime Minster, and others, have tried to patch together a majority through some compromise formula. The Withdrawal Agreement negotiated with the European Union will does not satisfy either the majority who voted to Leave the European Union, nor those who want to cancel the Brexit process. The new Conservative Leader will have a form a majority around a position, with a large highly disatified minority. In my view that will only happen after another General Election where one of the two major parties establishes a clear Parliamentary majority either on their own or in coalition. From my analysis of the data – mostly from the EU Elections in May – the only stable Parliamentary outcome is for the Conservatives to win on a platform of a no-deal Brexit. Under the current circumstances, the Labour Party cannot come close to a majority, primarily due to a revived Liberal Democrats, but also from the Green Party and the nationalists in Scotland and Wales.
Four recent UK elections & Failing to Deliver Brexit
The current context should be understood in the light of four recent UK-wide elections.
Fig 1 : Vote share of major parties in four recent UK elections
The European Election in 2014 resulted in the United Kindom Indpendance Party (UKIP) achieving 26.6% of the vote and almost a third of the 73 UK seats in the European Parliament. The Conservative Party under David Cameron won the General Election in the following year with a promise of a referendum. Compared with the European Election of the previous year, the Conservative vote share increased 13.7% and the UKIP vote share decreased 14.0%.
The resultant European Union Referendum Act 2015 was supported by all major parties with the exception of the SNP. In the subsequent referendum on 23rd June 2016 the UK voted to leave the European Union, despite the vast majority of politicians and the greater financial resources being devoted to remain. Early the following day Prime Minister David Cameron accepted the result and resigned. Leader of the Opposition Jeremy Corbyn called on the Government to trigger Article 50 immediately. A few days later, Theresa May launched her leadership campaign with a key statement on Brexit.
Brexit means Brexit. And we’re going to make a success of it. There will be no attempts to remain inside the EU, no attempts to rejoin it by the back door, and no second referendum. The country voted to leave the European Union, and as Prime Minister I will make sure that we leave the European Union.
On 29th March 2017 Prime Minister Theresa May notifys the EU of the UK’s intention to leave. The time period is two years, implicitly making the withdrawal date 29th March 2019.
On 18th April 2017 the Prime Minister calls a snap General Election to for 8th June, to capitalise on the Tories clear lead in the opinion polls. The outcome is the Tories lose their majority. Yet compared to the 2015 General Election, the Conservatives vote share increases 5.6% to 42.4% and the UKIP vote share is down 10.8% to just 1.8%.
A House of Commons Timeline extracted the commitments of the two major parties in their 2017 manifestos. The Conservative manifesto stated
As we leave the European Union, we will no longer be members of the single market or customs union but we will seek a deep and special partnership including a comprehensive free trade and customs agreement.
The final agreement will be subject to a vote in both houses of parliament. To agree the terms of our future partnership alongside our withdrawal, reaching agreement on both within the two years allowed by Article 50 of the Treaty on European Union. Once EU law has been converted into domestic law, parliament will be able to pass legislation to amend, repeal or improve any piece of EU law it chooses, as will the devolved legislatures, where they have the power to do so.
The Labour Party Party Manifesto stated
Labour accepts the referendum result and a Labour government will put the national interest first. We will prioritise jobs and living standards, build a close new relationship with the EU, protect workers’ rights and environmental standards, provide certainty to EU nationals and give a meaningful role to Parliament throughout negotiations. To scrap the Conservatives’ Brexit White Paper and replace it with fresh negotiating priorities that have a strong emphasis on retaining the benefits of the Single Market and the Customs Union. A Labour government will immediately guarantee existing rights for all EU nationals living in Britain and secure reciprocal rights for UK citizens who have chosen to make their lives in EU countries.
Both parties have commitments to leave the EU, but have quite different intepretations. The Conservatives guaranteed to leave on 29th March 2019, whilst Labour makes leaving conditional on obtaining certain guarantees. Neither Party has changed these commitments. It can be argued that neither Party respects the perception of leaving as exiting the single market and other institutions, as projected by both the Leave campaign and the Government’s Pro-Remain booklet sent to every household as part of the referendum campaign.
The EU withdrawal agreement does not contradict the Conservatives manifesto, but does contradict the perception of what leaving the EU means.
On 15th January 2019 the EU Withdrawal Agreement is defeated “by a majority of 230 (with 202 voting in favour of the Prime Minister’s Brexit deal and 432 against).” Despite this, the Government won a no confidence vote the next day by 325 to 302. In a second “meaningful vote” on 12th March, the Government loses by 149 votes.
On the 13th March, “Dame Caroline Spelman’s amendment (moved by Yvette Cooper) – ruling out a ‘no-deal Brexit’ at any time – is passed by 312 votes to 308.” On the same day a motion “to seek permission from the EU to delay Brexit beyond 29 March 2019” is passed by 413 votes to 202.
On 14th March “Dr Sarah Wollaston’s amendment – requesting an extension of Article 50 in order for a second referendum to take place – is rejected by 335 votes to 85.” This is delayed first to 12th April, then to 31st October.
It is interesting to note that during March the Conservatives were mostly leading in the opinion polls, but after 29th March Labour were leading. In April, after the launch of the Brexit Party and the announcement of European Parlimentary elections, both parties lost support.
In the European elections the Brexit Party was the clear winner. The Brexit Party and UKIP combined reached 33.7% of the vote (30.5% and 3.2%), up 31.9% on GE 2019, whilst the Tories had 8.8% of the vote, down 33.6%. The Liberal Democrats and the Green, with their clear policies to stop Brexit,improved by 12.2% and 11.0% to 19.6 and 12.6%, whilst the Labour Party’s vote share declined 26.3% to 13.7%. Whilst not all the vote movement from the Tories to no-deal Brexit parties, or from Labour to the stop Brexit parties, a massive poll published by Lord Ashcroft on 27th May confirms that this was the majority case. The Tories saw greater losses to the Brexit Party, whilst Labour saw losses to both the Liberal Democrats and the Greens. The poll also showed that the Labour Party of who retained more supporters from the General Election 2017.
The EU Election 2017 as a General Election opinion poll
Although there are clear differences in voting patterns between the European Elections and the General Elections, it is clear that from the above analysis for either the Conservative or Labour Parties to stand a chance of getting a majority, they must regain voters lost to other parties in the European Elections. Some voters will move back anyway, and much higher turnout in General Elections will have a role to play. But opionion polls in the last two weeks show that we may have four UK-wide parties in play, with the Greens making up a significant fifth. Fig 2, extracted from Britain Elects, summarizes these polls.
Fig 2 : Westminster Opinion polls in the three weeks following the European Elections 2019. Source Britain Elects
Britain Elects also summarized the EU Election Results 2019 by council area, with the change on 2014. For Great Britain (i.e. the UK excluding Northern Ireland) I have summarized these results by the YouGov opinion poll regions. That is (with number of MEPs) England North (17), England South (16), Midlands + Wales (23), London (8) and Scotland (6). This is only indicative as council areas vary considerably in number of voters. In the EU Referendum of 2016, the electorates for the Isles of Scilly, Orkneys and Shetlands were respectively 1,800, 16,700 and 17,400. At the other end of the scale Leeds had 543,000 voters and Birmingham 707,000. Also I have only covered just over 90% of councils. Due to re-organisations in areas like Suffolk and Dorest comparisons between 2014 and 2019 are not available.
Independence Parties Vote increase from 2014 to 2019
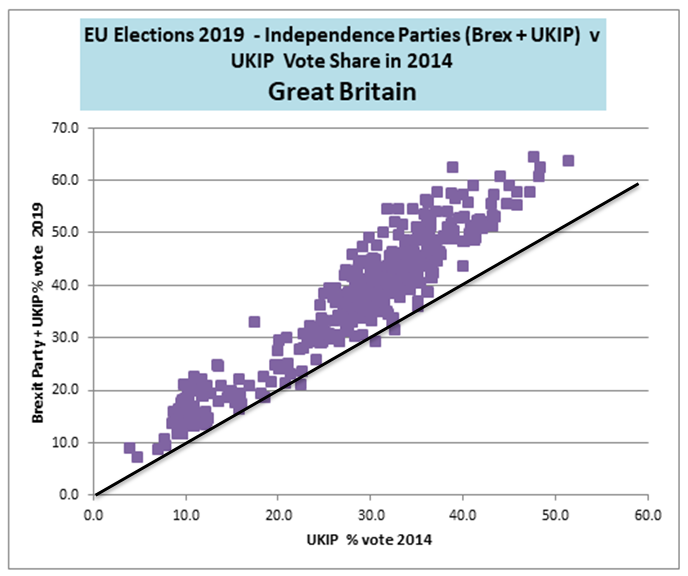
If the May European Elections had been a General Election I estimate the Brexit Party would have won a parliamentary majority of around 170 seats with just under one third of the vote. Combined with the UKIP vote, the two Independance Parties achieved a considerably higher share of the vote than UKIP did on its own in 2014. This is common across virtually every council area, as shown in Fig 3
Fig 3 : UKIP vote share by council in European Elections 2014 compared to Brexit Party plus UKIP vote share in European Elections 2019. Black line denotes no change.
There are very few council areas where the Independence vote did not increase. The variation by YouGov region is noticeable.
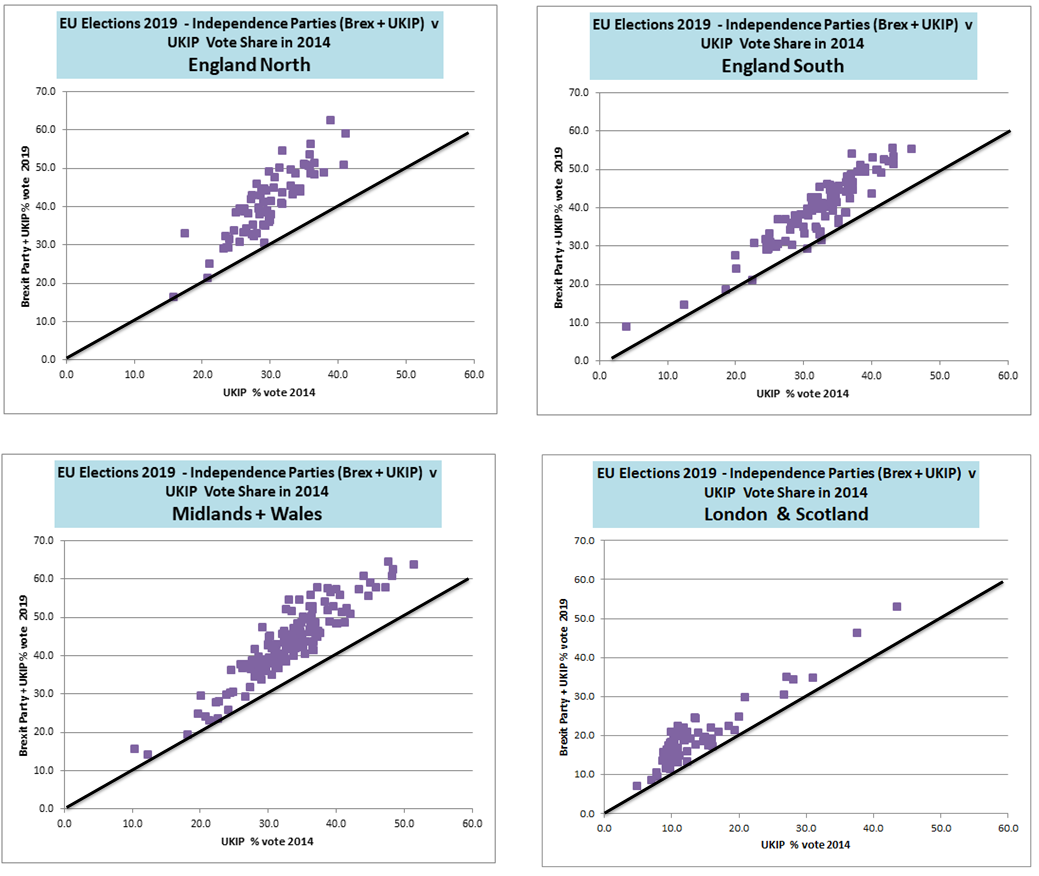
Fig 4 : Regional split of UKIP vote share by council in European Elections 2014 compared to Brexit Party plus UKIP vote share in European Elections 2019. Black line denotes no change.
It is in the North of England, the Midlands and Wales where some of the largest increases in the Indpendence party votes have occured. In the South of England the increase is more moderate. In both London and Scotland support for Independance parties is generally less than in the rest of the UK, with the outliers being in outer London. In 2014 the call was for a Referendum on the European Union. In 2019 the failure to implement the result of that referendum resulted in an even greater vote for the Independence Parties. In the sample councils in 2014 the unweighted average for UKIP was 29% of the vote. In 2019 the Brexit Party had an unweighted average of 33.9%. The Lib-Dems on a “block Brexit” platform achieved a more substantial gain, from 7.2% in 2014 to 19.9% in 2019. The Conservatives lost ground, from 25.0% average vote share in 2014 to 9.0% in 2019. The Labour Party also lost ground from 22.9% to 12.6%.
Countering the Lib-Dems and the Brexit Party in a GE2019
In the 2014 Euro Elections both Labour (under Ed Miliband) and the Conservatives (under David Cameron) lost votes to UKIP, but both maybe gained votes from the Liberal Democrats. In 2019 the Conservatives and Labour Parties both lost more ground, this time to the Brexit Party, the Lib Dems, and to lesser parties like the Greens. In this section I look at the vote shares of the two major parties in 2014 Euro Elections with those of the Brexit Party in 2019.
Fig 5 : Labour and Conservative vote share by council in European Elections 2014 compared to Brexit Party vote share in European Elections 2019. Black line denotes equal share. To the lower left is where Brexit Party has larger share in 2019 than Labour or Conservative Parties in 2014.
In Figure 5 in the vast majority of councils the Brexit Party achieved a greater share of the vote in 2019 than either the Labour or Conservative Parties did in 2014. The scatter is somewhat different. The Labour party has a fair number of councils where their 2014 vote share far outstripped the Brexit Party’s 2019 vote share, but a far greater number of councils where they did badly in 2014 (i.e. much less than 20% vote share) and where the Brexit Party achieved over 30% vote share in 2019. For the Conservatives the biggest cluster is where they achieved greater than 20% vote share in 2014 and the Brexit Party achieved greater than 30% vote share in 2019. This indicates that the Conservatives have far more to gain from adopting the Brexit Party’s no deal Brexit position than Labour. The regional split largely confirms this.
Fig 6 : Regional split of Labour Party vote share by council in European Elections 2014 compared to Brexit Party vote share in European Elections 2019. Black line denotes equal share. To the lower left is where Brexit Party has larger share in 2019 than Labour Party in 2014.
Figure 6 looks at the regional fight between the Labour Party and the Brexity Party. Given that the current Labour leadership is dominated by London-based MPs (Jeremy Corbyn, John McDonnell, Emily Thornberry, Diane Abbott) the perspective could be that there is little to be gained electorally from adopting a strong “Leave” position. Labour are strong where the hardline Brexiteers are weak. There are also councils in other parts of England (e.g. Liverpool, City of Manchester, Oxford, Bristol) where this pattern also applies. Conversely there are many councils in the Midlands and the South where the Labour Party has a very weak presence, but the Brexit Party gained over 30% of the vote in 2019. There are also quite a few councils where the Labour Party has considerable competition from the Brexit Party. This includes many marginal areas in the Midlands and North that Labour would need to win to form a Government. These include Barrow-in-Furness, Broxtowe, Bolsover, Dudley and Wrexham.
Fig 7 : Regional split of Conservative Party vote share by council in European Elections 2014 compared to Brexit Party vote share in European Elections 2019. Black line denotes equal share. To the lower left is where Brexit Party has larger share in 2019 than the Conservative Party in 2014.
Figure 7 shows a quite different position for the Conservative Party compared to Labour. They are strongest in the South and much of the Midlands. In these key areas the Tories have strong competition from the Brexit Party.
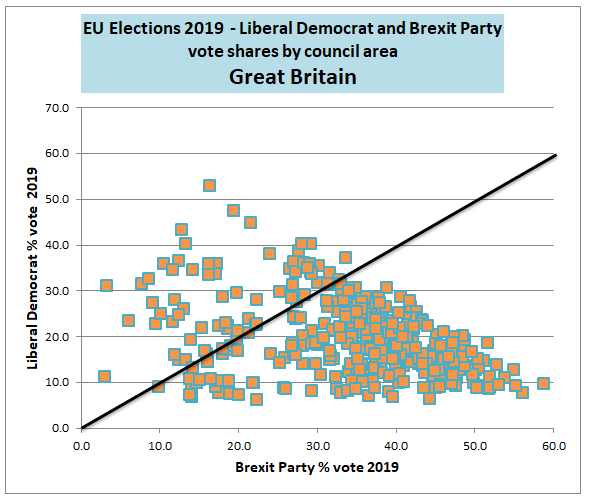
Lib Dems and Brexit Party Head-to-Head 2019
In the Euro Elections the Liberal Democrats also made a strong showing, achieving second place behind the Brexit Party. Their “Stop Brexit” policy is the antithesis of the Brexit Party’s “No Deal Brexit” stance. There were other Parties with similar hardline positionsin the May elections. In Figure 1 the Green Party made a strong showing, as did the nationalist parties in Sotland and Wales. Change UK had a similar small share of the vote to UKIP. It is unlikely either will figure in a General Election.
The problem for both Labour and the Tories is that winning votes from either the Lib-Dems or the Brexit Party will mean losing votes to the other. Their attempts at straddling the polar opposites last month meant losing to both sides. In this context it is worth examining the vote shares of the Lib-Dems and the Brexit Party by council.
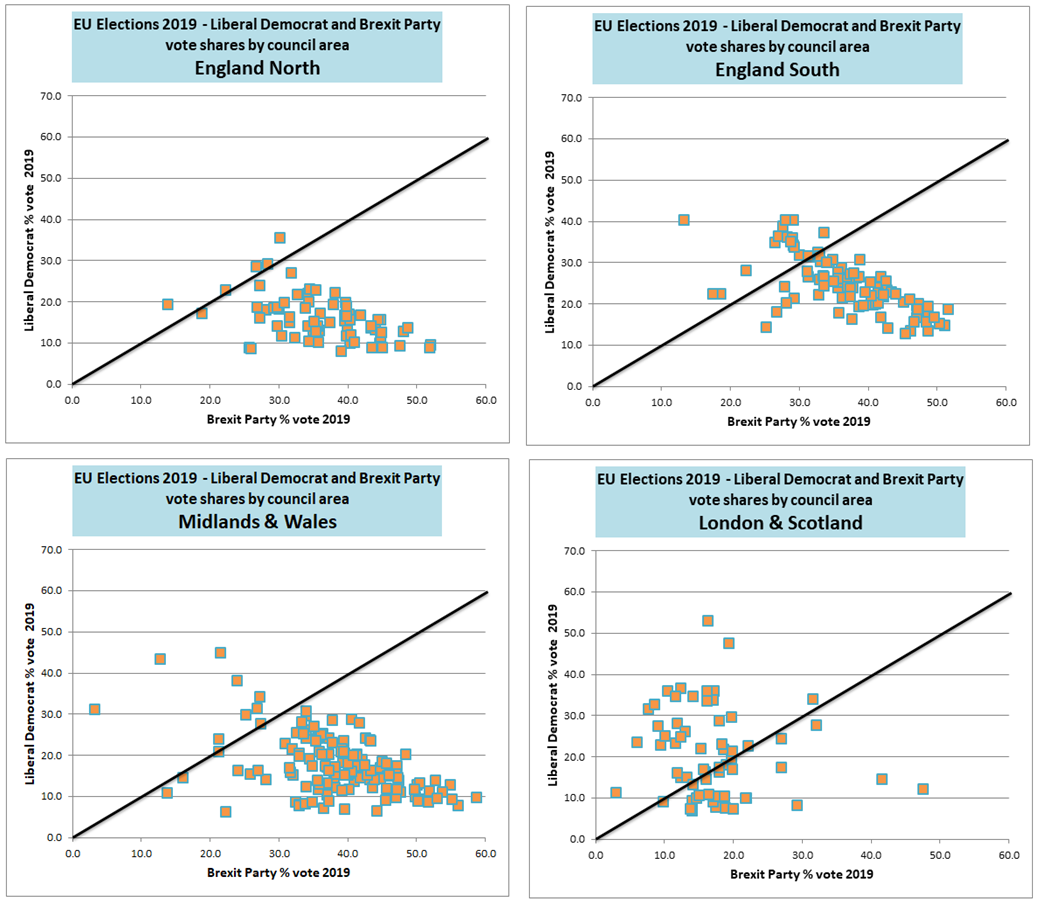
Fig 8:Liberal Democrat and Brexit Party vote shares in European Elections 2019 for Great Britain. The black line denotes equal share. London and Scotland combined.
Of the 365 councils covered, the Brexit Party had a greater share of the vote in 297. The regional split gives more information.
Fig 9: Regional split of Liberal Democrat and Brexit Party vote shares in European Elections 2019. The black line denotes an equal share. London and Scotland combined.
In Figure 9 I have combined London and Scotland as they show a similar picture that is quite different from the rest of Great Britain. The North of England has a less widespread Lib-Dem support than in the combined South East and South West Regions. In the central belt from Wales to East Anglia there is quite strong Lib Dem support in a minority of places. In a good proportion of that minority Brexit Party support is stronger. In London and Scotland it is the Lib-Dems that are stronger. Scotland has most of the instances where combined Lib Dem and Brexit Party Support was less than 40% due to the SNP being the leading party.
Lord Ashcroft Polls
Lord Ashcroft published a massive Euro-election post-vote poll on 27th May looking the shift in vote from the General Election 2017 and the Euro Elections. With respect to the loss of votes from the two major parties the article states
More than half (53%) of 2017 Conservative voters who took part in the European elections voted for the Brexit Party. Only just over one in five (21%) stayed with the Tories. Around one in eight (12%) switched to the Liberal Democrats. Labour voters from 2017 were more likely to stay with their party, but only a minority (38%) did so. More than one in five (22%) went to the Lib Dems, 17% switched to the Greens, and 13% went to the Brexit Party.
That is, for every one of the 2017 Conservative voters who voted Liberal Democrat last month, more than four voted for the Brexit Party. For the Labour it is the other way round. For every one of the 2017 Labour voters who voted for the Brexit Party, three voted for the either the Liberal Democrats or the Greens.
If this is cast into the above analysis, a no-deal Brexit strategy for the Tories will draw back votes from the Brexit Party, but not lose them a whole lot more votes to the Liberal Democrats. On the other hand for Labour, a clear Remain strategy to win back voter share is less pronounced, as in May they retained a larger share of the 2017 voters, and have a less one-sided loss parties with a clear Brexit standpoint. From today’s announcement, the adoption of a clear Pro-Remain strategy is not likely to happen whilst Jeremy Corbyn is the leader.
Conclusions
In the South of England, much of Central England and in parts of Northern England and Wales the Conservatives were the strongest party in 2017 and where the Brexit Party support is considerably stronger than the Liberal Democrats. A clear No-Deal Brexit policy as the way of respecting democracy would, therefore, win more votes than it lost. It would mean losses of a number of constituencies such as Winchester and Richmond-on-Thames. On the other hand, it could mean winning constituencies from the Labour Party, particularly where the Liberal Democrat and Green share increased on 2017. For the Conservatives, it means a will to win a majority in the knowledge that fair number of existing seats would be lost in the process.
The Labour Party is unlikely to clarify its position on Brexit, despite many in the party such as Emily Thornberry and Tom Watson wanting this change. The reason is the danger of losing seats through betraying the Leave voters in the North, Midlands and Wales, with substantial numbers of Labour MPs being against the move. Yet sitting on the fence will lose votes to four parties, or for traditional Labour voters to stay at home. The Conservatives will the biggest winners here.
In the year following the EU Referendum, I wrote a number of posts utilizing Chris Hanretty’s estimates of the vote split by constituency for England and Wales. Hanretty estimates that 421 of the 573 constituencies in England and Wales voted to leave. These estimates were necessary as the vote was counted by different – and mostly larger – areas than the parliamentary constituencies.
Politically, my major conclusion was that it was the Labour Party who could potentially suffer more from Brexit. There are two major reasons for this situation.
First, is that the Labour constituencies had a far greater spread of views than the Conservative constituencies. This is in both the divergence between regions and the disproportionate numbers of constituencies that are were either extreme Remain or extreme Leave in the referendum. Figure 1 is for the result for constituencies with Conservative MPs in 2016, and Figure 2 for constituencies with Labour MPs.
Figure 1: Constituencies in England and Wales with Conservative MPs in 2016, by estimated Leave or Remain Band.
Figure 2: Constituencies in England and Wales with Labour Party MPs in 2016, by estimated Leave or Remain Band.
In particular, London, where much of the current Labour Leadership are based, has views on the EU diametrically opposed views to the regions where most of the traditional Labour vote resides. Further analysis, from July 2016, is here.
Second, is the profile of the Leave supports. Based on an extensive poll conducted by Lord Ashcroft on EU Referendum day, Leave support was especially strong on those retired on a State Pension, council and housing association tenants, those whose formal education did not progress beyond secondary school, and the C2DEs. That is, groups that traditionally disproportionately vote Labour. Further details, from May 2017, are here.
Yet, the results of the snap General Election in June 2017 suggest that it was the Conservatives that suffered from Brexit. Despite their share of the popular vote increasing by over 5%, to the highest share in 25 years, they had a net loss of 13 seats and lost their majority. Labour increased their share of the vote by 10%, but only had a net gain of 30 seats.
Do the positions on Brexit appear to have had an influence? The Conservatives were seeking a stronger mandate for the Brexit negotiations, whilst Labour strongly avoided taken a firm position one way or the other. Chris Hanretty has revised his estimates, with the number of Leave-majority constituencies in England and Wales reduced from 421 to 401. The general picture is unchanged from the previous analysis. I have taken these revised figures, put them into the eight bands used previously and compared to the full election results available from the House of Commons Library.
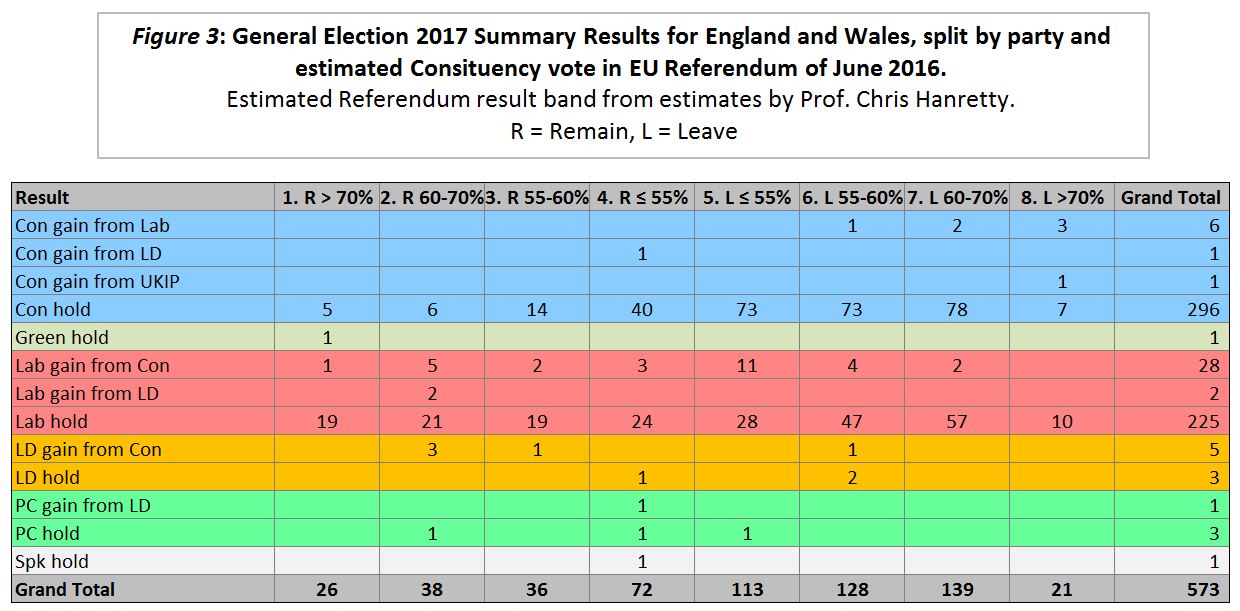
The main seat results are in Figure 3.
Main points from Figure 3 (for England and Wales) are
Conservatives had a net loss of 25 seats, 14 of which likely voted Remain in the EU Referendum and 11 likely voted Leave. Remain seats reduced by 18% and Leave seats by 4%.
All 6 gains from Labour were in strongly Remain constituencies. This includes Copeland, which was gained in a by-election in early 2017 and retained in the General Election.
Labour had a net gain of 24 seats, 13 of which likely voted Remain in the EU Referendum and 11 likely voted Leave. Remain seats increased by 16% and Leave seats by 7%.
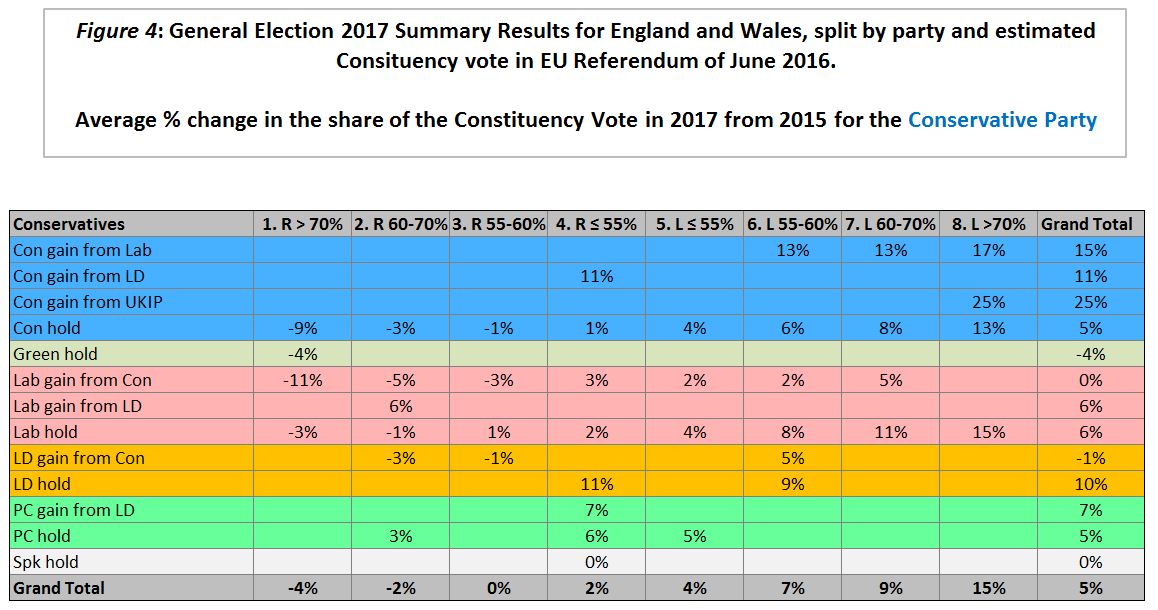
Figure 4 is the average percentage change in the constituency vote from 2015 to 2017 for the Conservative Party.
Main point from Figure 4 for the Conservative Party is
The estimated Referendum vote is a strong predictor of change in Conservative Party vote share from 2015 to 2017 General Election.
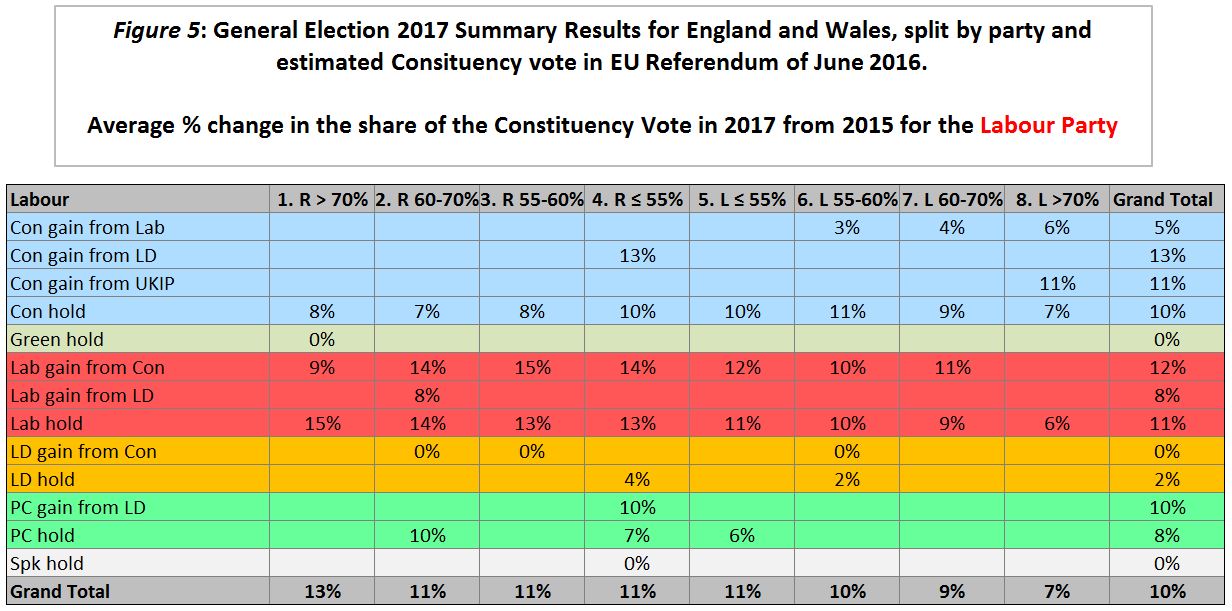
Figure 5 is the average percentage change in the constituency vote from 2015 to 2017 for the Labour Party.
Main points from Figure 5 for the Labour Party are
Overall average constituency vote share increased by 10% on the 2015 General Election.
In the 6 seats lost to the Conservatives, Labour’s share of the vote increased.
In every area, Labour increased its share of the constituency vote with one exception. In the 6 seats that the Liberal Democrats gained from the Conservatives, the Labour share of the vote was on average unchanged. This suggests some tactical voting.
In Conservative “hold” seats Labour’s increase in vote share did not have a “Remain” bias.
In Labour “hold” seats Labour’s increase in vote share had a strong “Remain” bias.
In summary, it would appear that the Conservatives in implementing Brexit have mostly suffered at the ballot in Remain areas. Labour, in being the Party of Opposition and avoiding taking a clear position on Brexit, benefited from the Remain support without being deserted by the Leave vote. I will leave it for another day – and for others – to draw out further conclusions.
Kevin Marshall
Update 23rd May
Whilst writing the above, I was unaware of a report produced by political pundit Prof John Curtice last December Has Brexit Reshaped British Politics?
Key findings
In the 2017 election the Conservatives gained support amongst Leave voters but fell back amongst Remain supporters. Labour, in contrast, advanced more strongly amongst Remain than amongst Leave voters.
That is pretty much my own findings by a different method. Both methods can produce different insights. My own approach can give regional analysis.
My General Election forecast made less than 12 hours before the polls opened yesterday morning was rubbish. I forecast a comfortable majority of 76 for the Conservatives, when it now looks like there will be a hung Parliament. That my central estimate was the same as both Lord Ashcroft‘s and Cerburus at Conservative Women is no excuse. In fact it is precisely not following general opinion, but understanding the real world, that I write this blog. What I have learnt is that the social media was driving a totally different campaign that was being reported in the other media. The opinion polls started to pick this up, and all sensible people did not believe it. Personally I was partly blind to the reality, as I cannot understand why large numbers of people should vote in numbers for an extreme left political activist who has over many years has sided with terrorists. Or a prospective Home Secretary who once voiced support for terrorism, and is unrepentant about that support. But then, in Paris 2015 leaders of the Western World voted for a Climate Agreement to cut global emissions, when that very Agreement stated it would do no such thing. The assessment of achievement was in the enthusiasm of the applause for the world leaders, rather than comparing objectives with results. That means comparing the real data with what is said.
Similarly in this election, we had all parties saying that they would spend more on things that have very marginal benefit compared to the cost. This included improving the NHS by giving staff a pay rise, or increasing the numbers of police “in every ward” to combat terrorism. It also includes trying to retain the structures of the European Union when we are leaving it, without defining recognizing the issues of a half-way house or the real benefits of those institutions There was also the gross hypocrisy of blaming problems caused, in part or in full, of past policies on something or someone else. This includes
Blaming austerity on the Tory Government, when the current structural deficit is a legacy of Gordon Brown’s Golden Rule. Given that Gordon Brown is a Scottish Progressive, it something that the SNP needs to confront as well.
Blaming rise energy bills on the Energy Companies, when it is a result of the Climate Change Act 2008. When Ed Miliband launched the policy at the Labour Party Conference in 2013, it was seen as something of the left extremism. But the Conservatives put such controls in their manifesto as well.
Blaming the rising cost of pensions on increased longevity, when a major part of the reason is near zero interest rates on savings.
Part of that blame is for the rise is the spin doctors, who only put out messages that will be well received by the target voters, and keep in the background areas where the target voters are split in their views. The Conservative manifesto and Theresa May’s election campaign could be seen as the inheritors of these 1990s New Labour doctrines. The Labour Party, however have rejected New Labour Blairism. In one sense Labour have retrogressed, with mass rallies that hark back to era when the British socialist party was in the ascendancy. But in another way Labour grassroots have embraced the new technology. We have a new way of communicating ideas based on a picture and 140 characters that takes power away from a few professional manipulators of public opinion. That power now rests with alpha trolls or non-entity celebs with their shallow views supported by isolated facts. It is a sphere where excluding other opinions by changing the subject; or having the last word; or taking offence for upsetting their false perceptions; or claiming those with other opinions are either outright lying or are blinkered; or getting fanciful claims repeated thousands of times until they are accepted as though they were fact.
There is a way out of this morass, that is the exact opposite of the Donald Trump method of out-trolling the trolls. It is by better understanding the real world, so that a vision can be developed that better serves the long-term interests of the people, rather than being lead by the blinkered dogmatists and alpha trolls. I believe that Britain has the best heritage of any country to draw upon for the task. That is a country of the mother of all Parliaments and of the country that evolved trial by a jury of one’s peers. It is a country where people have over the centuries broken out of the box of current opinion to produce something based on a better understanding of the world, without violent revolution. That was the case in science with Sir Issac Newton, Charles Darwin and James Clerk Maxwell. This was the case in economics with Adam Smith and in Christianity with John Wesley. But there are dangers as well.
It is on the issue of policy to combat climate change that there is greatest cross-party consensus, and the greatest concentration of alpha trolls. It is also where there is the clearest illustration of policy that is objectively useless and harmful to the people of this country. I will be providing some illustrations of this policy nonsense in the coming days.
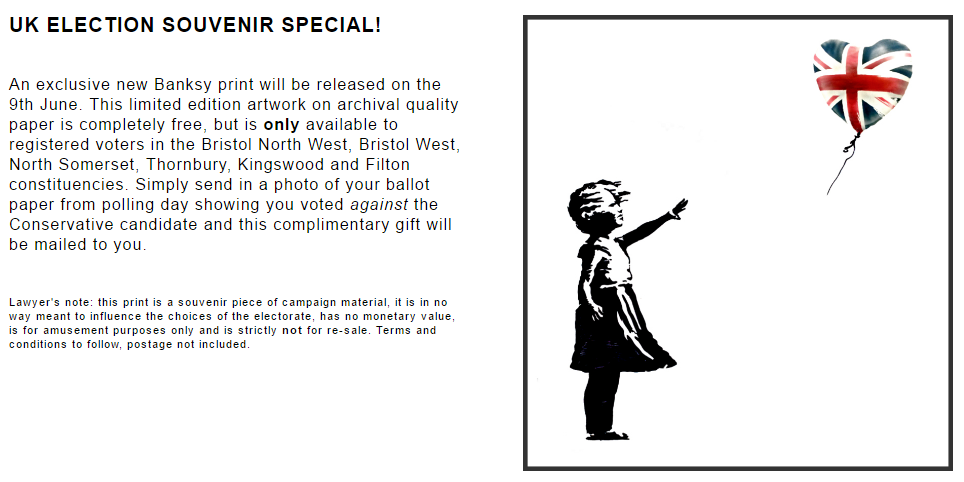
The BBC has an article Banksy makes election print-for-vote offer.
Secretive artist Banksy has offered fans a free print if they vote against the Conservatives in a move which could land him in legal trouble.
The political graffitist posted on his website offering a print to voters in six Bristol area constituencies.
Applicants have to send him a ballot paper photo showing a vote against the Tories to get the limited edition work.
This would contravene laws designed to ensure votes remain secret, and could break rules against bribery.
The small print is
Lawyer’s note: this print is a souvenir piece of campaign material, it is in no way meant to influence the choices of the electorate, has no monetary value, is for amusement purposes only and is strictly not for re-sale. Terms and conditions to follow, postage not included.
I will leave it up to the Electoral Commission to decide the legality of Bansky’s offer. But the terms in the small print shows a delusion of the left. Simply by declaring that something “has no monetary value” and is “for amusement purposes only” does not mean that the print is not valuable to the recipient. For instance, experiences in my life have no monetary value, but I value them highly. In this respect the offer of a print for not voting Conservative could be viewed the same as a similar offer of being able to meet a famous person that the voter admires. What most people would agree upon is that some of the most valuable things in life have no monetary value, such as love, friendship or the bonds of family. The left have always been keen to emphasize that by creating monetary values, capitalism distorts these real values. It is therefore somewhat hypocritical for someone of the left to circumvent the law on bribing voters by offering a reward for voting in a non-monetary way, That is by trying to legally demonstrate that there is no bribe by declaring it has no monetary value, when to the genuine left-wing voters it is more valuable due to declared monetary value. The only defense if that those of the genuine left would never vote Conservative anyway. But that means that any offers for sale on Ebay of the prints are evidence that someone maybe changed their vote to get a print.
Alternatively, as most people agree that some things without monetary value are still valuable, including Conservative voters it could still be valuable. The intellectual left view Tories as being of lower morals, particularly looking after their selfish interests. In this respect maybe someone who would normally vote Conservative will vote for a non-Conservative outsider, to get the print. I am sure that Banksy feel able to stand up in court, under his real name, and proclaim under oath that no Conservative would stoop to such an action. I am just as sure that Corbinysta twitter trolls will be queuing up with their Twitter histories to affirm that they have never implied anything other than that Conservatives were on a similar level of morals to themselves.
Just to clear, Banksy might be within the law. But it would appear to be rank hypocrisy from a left-winger to offer something that is declared without a monetary value, but clear non-monetary value, when most people agree – particularly of the left – that many things with a non-monetary value are in fact valuable to them.
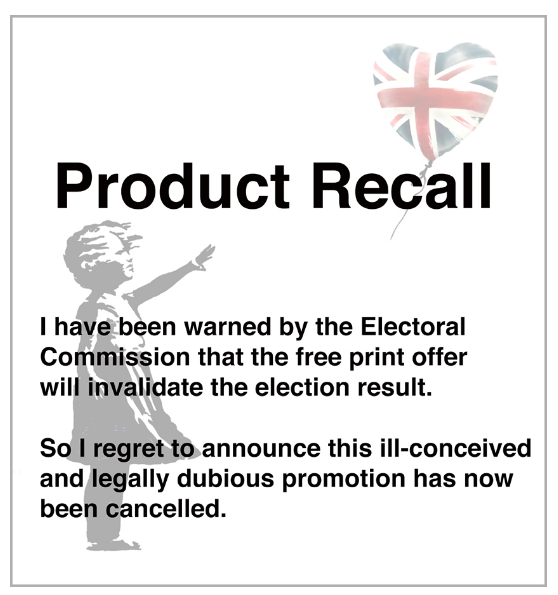
Update 07/06/17
Guido Fawkes reported yesterday that Banksy has withdrawn this “bribe”.
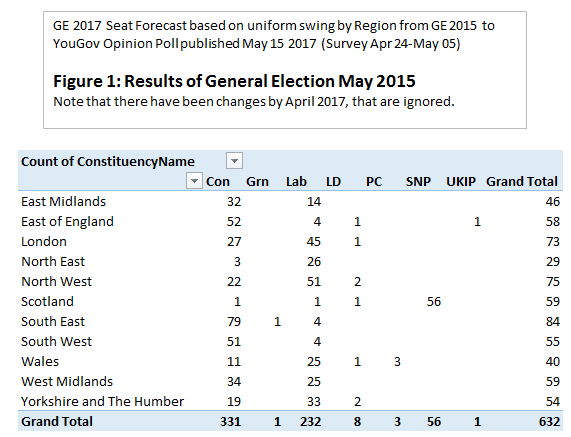
On May 15, YouGov produced a General Election opinion poll broken down by the eleven Regions of Great Britain. It seems impressive with 14395 GB Adults, plus 1040 London Adults, 1017 Scottish Adults and 1018 Welsh Adults. However, with fieldwork on 24 April to 05 May, it might be a little out of date. By combining this with the General Election Results by Constituency (available for the British Election Study) I have been able to produce a crude forecast for the General Election on June 8th.
The starting point in the General Election Results of May 2015, shown in Figure 1. Since then Con has gained 1 seat from Lab (Copeland), and lost a seat to LD (Richmond). The sole UKIP MP, Douglas Carswell, left the Party in March to become an Independent. These are ignored.
Note that the 18 Northern Ireland constituencies are not included. The 331 Con seats are against 326 for a majority in the House of Commons.
I made the following assumptions.
Within each constituency, for each Party I have assumed the change in the vote is the difference between the regional share of the vote in 2015 and the opinion poll share from YouGov.
If the constituency vote share in 2015 was less than the regional drop in vote share between 2015 and current opinion poll, then the vote is nil.
A party may have a predicted vote despite not having a candidate. There are two instances where this is possible. First is that UKIP are not standing candidates in every constituency. Second is that the Progressive Alliance of Lib Dems, Greens, Labour and the SNP are standing down candidates to maximize the impact of the anti-Tory vote. Guido Fawkes’ summary of 16th May is here.
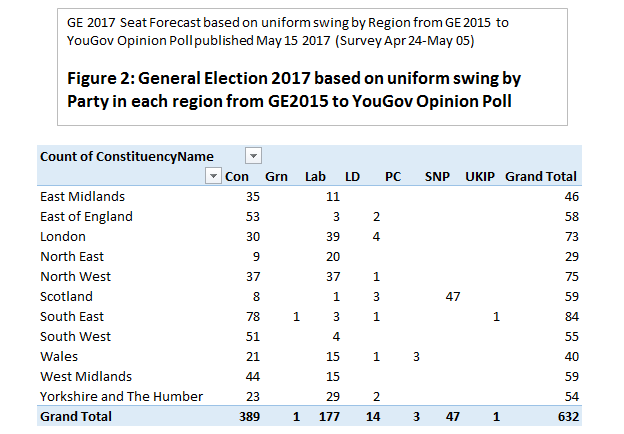
This simple model produces the forecast in Figure 2.
Implied Conservative majority is 128, up from 12 in the previous Parliament. The Lib-Dems also increase there number of seats, whilst SNP lose 9. UKIP’s “gain” is in Buckingham, the seat of the Speaker. This is due to a flaw in the crude model.
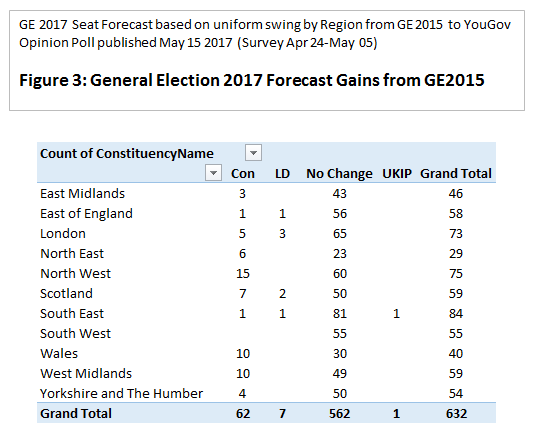
The Party gains by region are in Figure 3
Of note is that Labour do not gain a single seat, as YouGov estimate that their popularity has dropped in all but two regions. In the South East and the South West Labours’ presence is quite low. The SNP in Scotland lose seats to both the Conservatives and the Lib-Dems, but the loss of 9 seats is would still mean they have 47 of 59 seats.
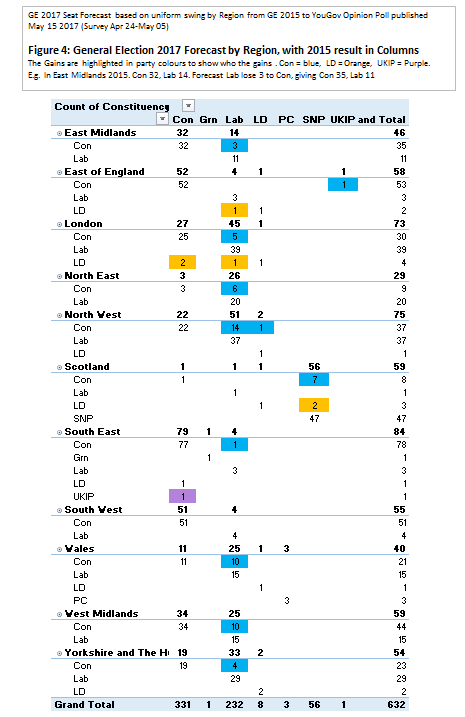
These switches in seats are shown in detail in Figure 4.
My very crude forecast can be compared to the current forecast by Martin Baxtor at Electoral Calculus of Con 409, Lab 167, LD 7 & SNP 46. The Conservative majority is 168, 40 more than my own.
Another comparison is the mid-point of the spread betting at Sporting Index. This Con 399, Lab 159, LD 15.5, SNP 45.5. The implied Conservative majority is 148, bang in the middle of my own and Martin Baxters’.
In subsequent posts I intend to
Clear up the obvious errors.
Refining the forecast for Scotland based on the local election data of May 5th.
Look at the forecast for Wales, where I believe YouGov might be out of line with popular opinion.
Update in relation to more recent, but National, polling. For instance the recent strengthening of the Labour poll share and the fall in the UKIP share.
Since the EU referendum, the Labour Party has been split asunder. Most Labour constituencies voted to leave the EU. But the current leadership, and many of the supporting activists, are from very pro-Remain areas, particularly London. The draft Labour Manifesto, that was widely “leaked”, shows how this split in its support has been circumvented. First, the key issue of the the country at present is downplayed. The section Negotiating Brexit is only the ninth item in the manifesto. Second, is to stop some laws being passed from EU control to UK control. Third, is to give Parliament the final say at the end of the process, including the possibility of remaining in the EU, or applying for re-admission. In so doing, Labour is alienating the majority of its traditional core support.
The Impact of EU Referendum on Labour Constituencies
On the day of the EU Referendum, Lord Ashcroft “surveyed 12,369 people after they had voted to help explain the result – who voted for which outcome, and what lay behind their decision.”
In terms of voting, the groups with the biggest proportions voting to Leave were
60% of those aged 65+
two-thirds of those retired on a state pension
two-thirds of council and housing association tenants
more than half of those retired on a private pension
a large majority of those whose formal education ended at secondary school
64% of C2DEs
That it is the poorer and more marginalized in society – where traditionally the Labour Party draws its major vote – that disproportionately voted to leave the EU.
Lord Ashcroft then asked for people to rank in order a number of factors in people’s decision. His graphic is reproduced below.
For both Conservative and Labour voters, the principle reason for voting for Leave was
The principle that decisions about the UK should be taken in the UK
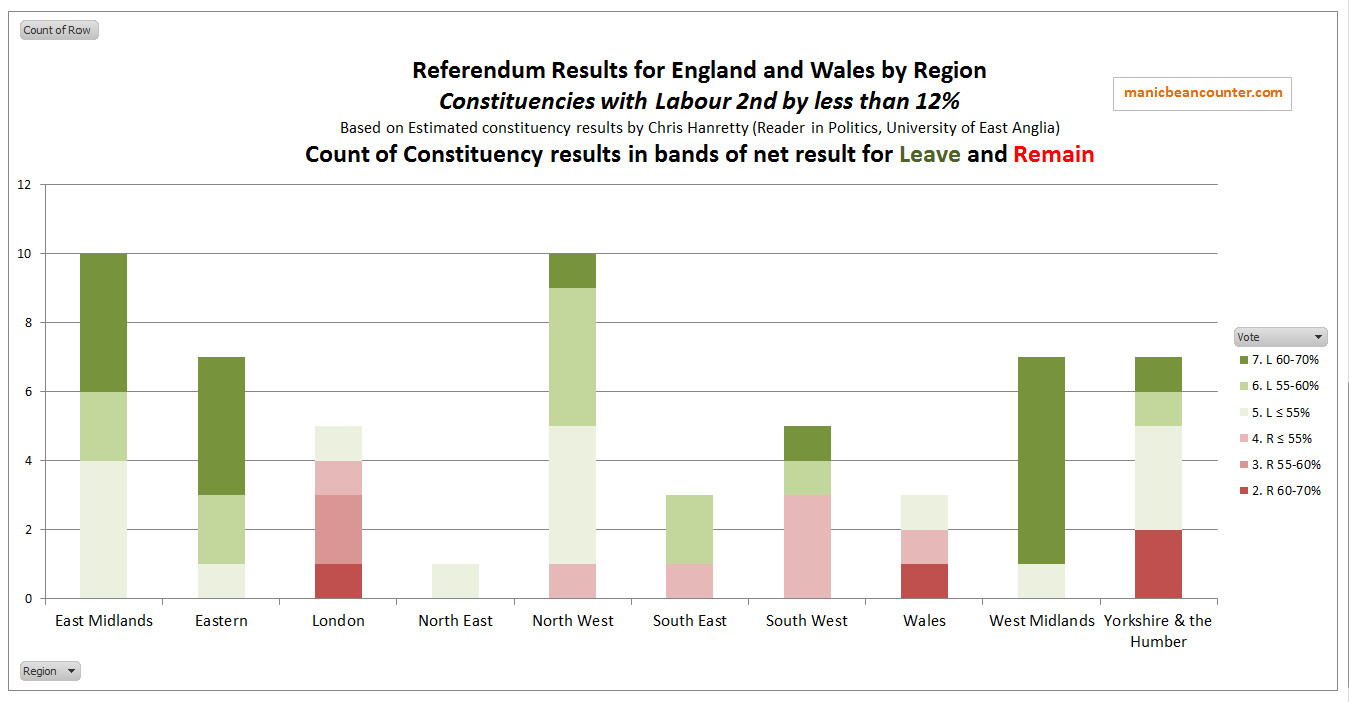
An analysis of the Leave vote by political party shows that of around two-thirds of those voted Labour in 2015 a year later voted to Remain in the EU. Yet around two-thirds of those who traditionally formed the bedrock of the Labour vote voted for Leave. This is not a contradiction in the figures, but the fact that the Labour Party is no longer reaching most of the core group that it has traditionally represented. Geographically this is illustrated in by my breakdown from last July of Chris Hanretty’s estimates of the EU referendum results by constituency. With respect to Labour-held seats the proportions by region were as follows.
In London, Labour constituencies included some of the most pro-Remain areas of England. Yet Labour seats elsewhere included a disproportionate number of some of the most pro-Leave constituencies in the country. In terms of proportions, 40% (231 of 574) constituencies in England and Wales were Labour after the 2015 General election. Yet over half of the constituencies with a greater than 60% Remain vote (34 of 54) were Labour. Also over half of the constituencies with a greater than 60% Leave vote in England and Wales (89 of 168) were Labour. But, for the Labour party the extreme “Leave” seats are over 2.5 times the extreme “Remain” seats. To tip the balance even further, for Labour to progress on their poor showing in the last election, they must win target seats. Of those seats where Labour came second by less than 12% of the vote, there are 17 seats that were over 60% “Leave” and just 4 seats over 60% “Remain”.
Since the EU Referendum, opinion has changed. The most recent poll by YouGov on Brexit, published at the end of March, found that overall the public think Brexit should go ahead by 69% to 21%. This includes people who voted Remain, but think that the expressed will of the British people should be enacted.
So, if the Labour Party is really wanting to maximize votes, it would provide a manifesto that provided
an emphasis on Brexit.
an emphasis on its core voters.
an emphasis on returning decision-making powers back to the UK.
a geographical targeting of the Midlands, the North and Wales, where its power base lies.
trying to represent the opinion of the vast majority.
discrimination towards the people the Labour Party was formed to serve (the working class and the marginalized) over the middle class intellectuals.
The Draft Labour Manifesto on Brexit
The draft manifesto was widely circulated. The best available format is at Guido Fawkes.
The title of the manifesto slogan – “For the many not the few” – seems to be a good start. If Labour is looking towards the vast majority, it will surely not favour the opinions of the minority over the much larger majority? This is not the case. Despite being the major issue facing Britain today, and the major reason the General Election was called, the section Negotiating Brexit is only ninth. The authors give greater priority to Industrial Strategy, A National Investment Bank and Sustainable Energy. So rather than concentrate on the pressing issues of the day, we are taken back to the disastrous ideas of the 1970s, along with a country unilaterally trying to save the planet from fictitious threat of catastrophic anthropogenic global warming.
The content is worse.
They manifesto proposes changing the approach to Brexit, despite the tight timetable. Further, in talk of protecting certain laws, the manifesto is of activist protesters wanting to stop changes in the post-Brexit process. The Great Repeal Bill is inaccurately named as it is just quickly converting EU law into British law within a tight timetable. It is afterwards that laws deemed harmful to Britain by the democratically-elected Government will be scrapped or radically altered. Maybe crackpot Marxist conspiracy theorists, or those who view reality through the distorted prism of received collective opinion, think otherwise. But then in a truly independent United Kingdom, there is the opportunity to win power and reenact laws and policies that have been scrapped. That is no different from many areas today, as is seen by the draft manifesto sections on Nationalisation and Industrial Strategy. But the draft manifesto is implying that certain contentious areas of law that the Labour leadership value highly should remain beyond the remit of UK lawmakers.
However, the most important is final sentence in the section.
A Labour approach to Brexit also means legislating to guarantee that Parliament has a truly meaningful vote on the final Brexit deal.
This means that it is Parliament who have the final say on that deal. But what if the majority of MPs decide to reject the deal negotiated at the end of the budget process? Well that will mean either leaving the EU without a deal; or trying to stay in the EU; or reapplying for membership. This latter option will not in the real world actually happen, but neither the manifesto, nor Labour leader Jeremy Corbyn in a recent interview with the BBC’s Laura Kuessenberg, have categorically excluded this scenario.
Indeed, given Labour would slow down the process, there would be insufficient tine for meaningful negotiations to take place. The “deal” will be little altered from the negotiating stance the EU starts out with. This will be unacceptable to Parliament, and the WTO terms are clearly unacceptable to Jeremy Corbyn. Therefore, there would be a hurried reversal of the process, with the UK having to grovel to be re-admitted on worse terms than before.
Why not state Britain is leaving the EU?
The reason for Labours’ evasions is that the leadership of the Party, the activists that support it and the unions that finance the Labour Party all want to remain in the EU. The strongest support for Remain in England and Wales is concentrated in London. This is also where the disproportionate number of hard left activists reside and where the key four leaders – Jeremy Corbyn, John McDonnell, Diane Abbot and Emily Thornberry – were MPs in the last Parliament. By leaving open the possibility of remaining in the EU, despite the vast majority now accepting the opposite, Labour are trying to have it both ways. They can both appear to be opposing Brexit to their core supporters and appear to be enacting Brexit to their traditional base. But in so doing abandoning most of their traditional core supporters in Wales, the Midlands and the North, the people will either not vote, or (if the latest opinion polls are anything to go by) vote Conservative.
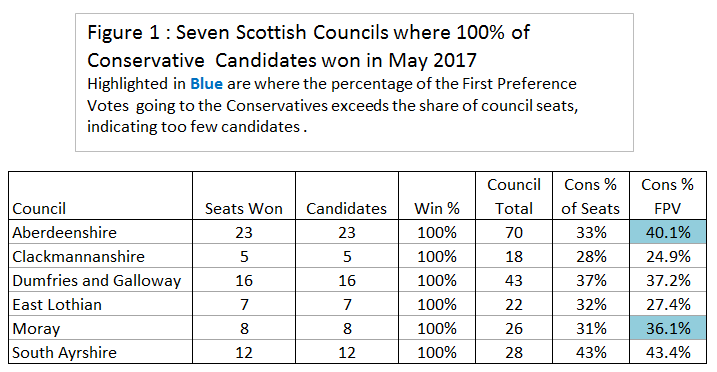
A couple of weeks ago posted Will Ruth Davidson be Apologizing to Voters After the Scottish Local Elections on May 4th? My contention was that the Conservatives has underestimated the strength of their growing support, so had fielded too few candidates. Under the Single Transferable Vote System, if a Party fields too many candidates in a ward then they will compete against each other. So I believed that the Conservatives, unsure of where their vote might lie, played safe. This was on the basis of my forecasting, before the General Election announcement the Conservatives gaining 150 extra seats, and achieving 21% of the First Preference vote. I was then seeing signs further improvement in the opinion polls, but with no extra candidates to achieve extra seats. In the event, the Conservatives gained 161 more council seats than in 2012, with 25.3% of the FPVs. Part of the reason for this was the other major parties. The Labour Party did much better than I expected and the SNP did worse. But there is still evidence that the Conservatives fielded too few candidates.
Figure 1 shows the seven Scottish Councils where all the Conservative Candidates won seats. Given that (a) of the 337 wards with Conservative candidates 296 had only one candidate, and (b) that support for any Party tends to vary across wards, the fact that every candidate one suggests too few candidates. Aberdeenshire and Moray stand out most clearly in this respect, as the total FPV vote was well in excess of the percentage of seats won. But South Ayrshire Council was possibly the most significant, as with three more seats and the Conservatives would have had a majority on the 28 seat council. In five of these councils they were also the largest party.
It should be noted that the Conservatives were not the only Party which achieved the feat of 100% of candidates being elected. The Liberal-Democrats saw elected all 6 of their candidates in East Dunbartonshire. Here the Conservatives saw 6 of their 7 candidates elected. The only other example of a party achieving a 100% success rate for a council was the SNP in the Shetland Islands. Their sole council candidate, Robbie McGregor, won the Shetland South seat uncontested.
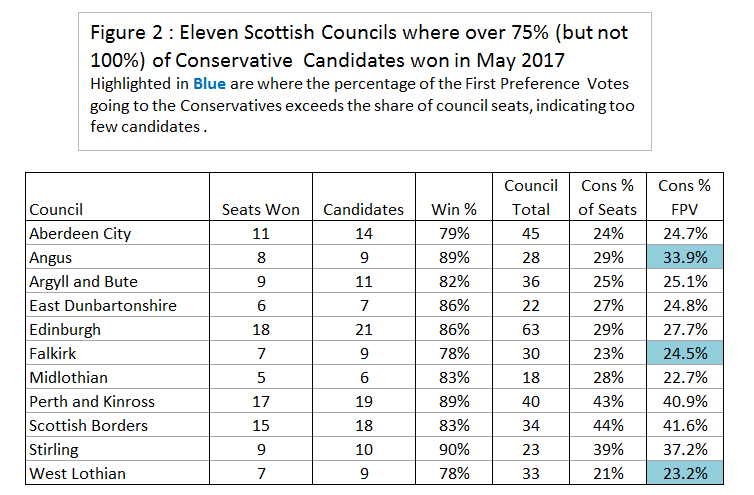
This theme of insufficient candidates is also suggested in the councils where more than 75% of candidates were elected.
There are three councils where the FPV share exceeded the percentage of seats won. Councils like Aberdeen City and Stirling are where the Conservative vote share varies considerably across the wards.
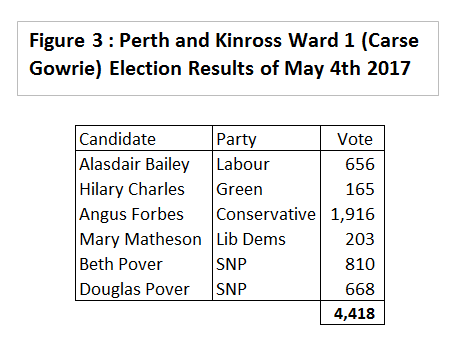
A particular ward that stands out where the Conservatives had too few candidates is Carse Gowrie, Ward 1 of Perth & Kinross Council Area.
After vote allocation, Angus Forbes won more votes than the two SNP candidates combined. The Courier local newspaper did a series of short articles on all the wards in this council and others in the area. For Carse Gowrie they wrote:-
Former scout leader Mr Forbes said: “I knew we would do well, because the Conservatives always have in Carse of Gowrie.
“I was surprised to increase the vote, though.”
He said: “Sadly, what I was finding was that people were voting on national issues, rather than local ones.
“It was all about independence. When I was out canvassing, what I was hearing was: We’ve got to get rid of the SNP, we’re fed up hearing about independence.”
This comment could be highly significant in that First Minister Nicola Sturgeon is trying have another Scottish Independence Referendum just four years after the previous one, despite the 2014 one supposedly being the last one for a generation. This would also explain why the Labour Party achieved 20.2% of the FPV vote, a share significantly above the Labour share of recent Scottish opinion polls. This being a a reversal of the 2012 and 2007 council elections, where the FPV share was significantly behind the FPV share. Mrs Sturgeon’s move could being viewed by a very cynical attempt to win independence on the basis of unfounded scary stories about Brexit, before they are contradicted by the real world evidence after March 2019.
What the results indicate for the General Election
Whilst the Conservatives might have been able to gain a few extra council seats if they could have better predicted the surge in support, the important issue is the indications for the General Election. If it is the case that the General Election swing might be even larger for the Conservatives in the council areas where they did well, and an maybe an improvement for Labour in their traditional Scottish Heartlands. At the Electoral Calculus website, the current Scotland GE forecasts are
CON 12 (+11), LAB 0 (-1), LIB 2 (+1), UKIP 0 (+0), Green 0 (+0), SNP 45 (-11)
For the Conservatives, the council election results are consistent, but for Labour they may win an extra seat, rather than lose their only Scottish seat in Edinburgh South.
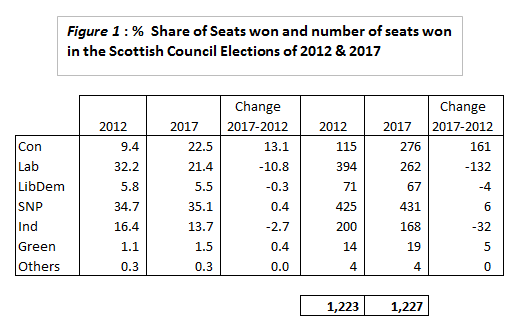
The Council Elections were held last Thursday 4th May, and the results in terms of seats were announced on Friday. It was only today that the Elections Scotland have published the summary details, including the First Preference votes. I have complied three brief summaries. The 2012 data used for comparisons is from the Lincoln Report on Report on Scottish Council Elections 2012.
Figure 1 shows the SNP were way ahead in terms of total seats won, the Conservatives second and Labour in third. In terms of change from 2012, it is the Conservatives that performed best, increasing the number of seats by 161. Labour lost a third of their seats, and the Independents were collectively down by a sixth on the seats won in 2012.
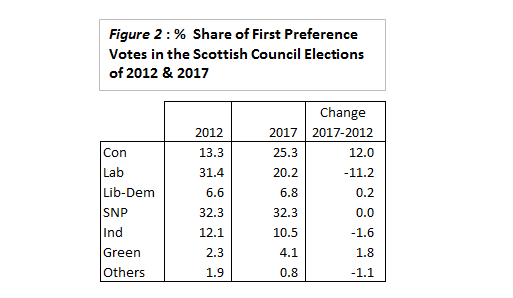
Figure 2 shows the SNP getting again ahead in terms of First Preference Votes, and on the same share as five years ago. The Conservatives are second on 25.3% and Labour third on 20.2%. For comparison, the latest YouGov opinion poll for Scotland of Westminster voting intentions, (of 24-27 April) gave SNP 41, Conservative 28 & Labour 18. People often vote differently in local elections to General Elections, and in Scotland, Independents are quite strong. But the difference is striking, and may indicate where the vote is moving. Compared to the last opinion poll, SNP -9, Conservative -3 and Labour +2. On that basis the Local Elections were bad news for the SNP. The Labour Party appear to have bottomed out, and the Conservatives are doing extremely well.
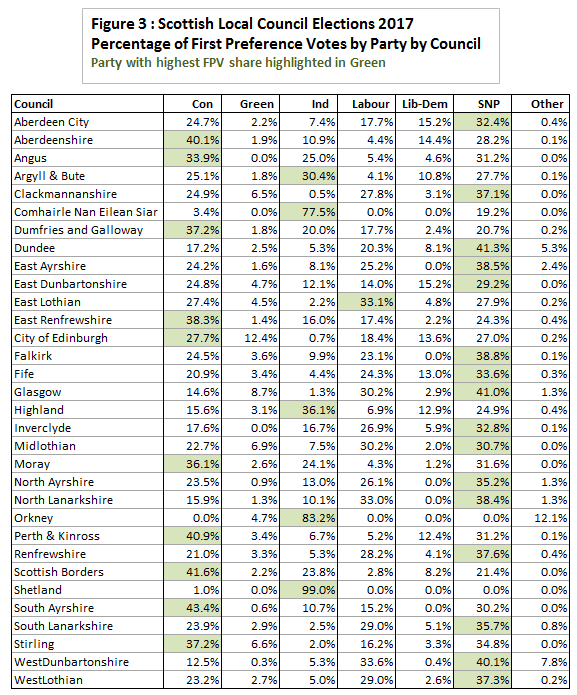
Figure 3 is the most interesting in terms of indications of voting intentions going into the General Election. I have shown the percentage of first preference votes by Party in each of the 34 councils.
I have highlighted the Party that gained the highest shared of First Preference Votes in each Council. They are SNP 16, Con 10, Ind 5, Lab 1.
A quick comparison with the Electoral Calculus General Election seat predictions. The Westminster constituencies are not necessarily the same as the councils.
Labour was only ahead in East Lothian. Electoral Calculus only gives Labour a 14% chance of winning, as against 45% for the SNP and 40% for Conservatives.
At a quick glance the Conservatives are ahead in all their target constituencies.
In the Scottish Borders, the number one target they achieved nearly double the FPV of the SNP. Although there is a strong vote for Independents, the 76% chance of Conservatives winning seems more than justified.
The better news for the Conservatives is in the long shots. Stirling has a 43% chance of winning, against 49% for the SNP, yet were 2.4% ahead in the FPVs. Angus has a 36% chance of winning, against 63% for the SNP, yet were 1.7% ahead in the FPVs. Ayr Carrick and Cumnock has a 32% chance of winning, against 59% for the SNP, yet were 13.2% ahead in the FPVs.