IPCC AR5 Synthesis Report Presentation Miscalculated the Emissions for 2C of Warming

In a previous post I mistakenly claimed that the Ladybird Book on Climate Change (lead author HRH The Prince of Wales) had incorrectly interpreted the AR5 IPCC Synthesis Report in its egg-timer. It is the IPCC that is at fault.
In 2014 the IPCC produced a simplified presentation of 35 slides to summarize the AR5 Synthesis Report Summary for policy makers. A quick summary of a summary of the synthesis report.

Slide 30 on Limiting Temperature Increase to 2C, clearly states that it is global reductions in greenhouse gas emissions that are needed.


The Ladybird egg-timer is adapted from slide 33 of 35.

As a (slightly manic) beancounter I like to reconcile the figures. How are the 1900 GtCO2 and the 1000 GtCO2 arrived at? It could be that it is GtCO2e, like the throughout the synthesis report, where other greenhouse gases are recast in terms of CO2, which accounts for well over half of the warming from trace gases.

Some assumptions for my quick calculations.

1. A doubling of CO2 will lead to a warming of 3C. This was the central estimate of the Charney Report 1979 (pdf), along with all five of the UNIPCC assessment reports.
2. If the pre-industrial level of CO2 was 280ppm, the dangerous 2C of warming will be reached at 445ppm. Rounded this is 450ppm.
3. In 2011 the Mauna Loa CO2 level was 391.63 ppm.
4. Using the CDIAC World CO2 emission figures, gives the following figures for billions of tonnes of CO2 to achieve a 1ppm rise in CO2 levelsin the graph below. In the five years to 2011 on average it took 17.02 billion tonnes of CO2 to raise CO2 levels by 1 ppm. Lets round it to 17.

Now some quick calculations.
Start with 280ppm
Add 111.76 (=1900/17) gives 391.76. Pretty close to the CO2 level in 2011 of 391.63ppm
Add 58.82 (=1000/17) gives 450.58. Given rounding, this pretty close to 450ppm.

There are problems with these calculations.

  • The estimate of 17 GtCO2e is on the high side. The World CO2 emissions from the CDIAC National Emissions spreadsheet gives a sum of 1069.68 GtCO2 from 1960 to 2011, against a rise in CO2 of 74.72 ppm. That is 14.3 GtCO2e over the whole period. Since 2011 there has been a drop towards this long-term average.
  • The Ladybird Book, like the UNFCCC at COP21 Paris December 2015 talks about restraining emissions to 1.5C. If a doubling of CO2 leads to 3.000C of warming then going from 280ppm to 401ppm (the average level in 2015) will eventually 1.555C of warming. This is a tacit admission that climate sensitivity is vastly overstated.
  • But the biggest error of all is that CO2 is only the major greenhouse gas (if you forget about water vapour). It might be the majority of the warming impact and two-thirds of emissions, but it is not all the warming impact according to theory. That alone would indicate that climate sensitivity was 2 instead of 3. But actual warming from 1780 to 2011 was less than 1C, against the 1C from CO2 alone if CS=2. That indicates that CS ≈ 1.3. But not all of the warming in the last 230 years has been due to changes in GHG levels. There was also recovery from the Little Ice Age. Worst of all for climate alarmism is the divergence problem. In this century the rate of warming should have increased as the rate of CO2 levels increased, in turn due to an increase in the rate of rise in CO2 emissions. But warming stopped. Even with the impact of a strong El Nino, the rate of warming slowed dramatically.


Conclusion

The IPCC calculated their figures for 1000 billion tonnes of CO2 emissions for 2C of warming based on CO2 being the only greenhouse gas and a doubling of CO2 levels producing 3C of warming. On that basis 401ppm CO2 level should produce >1.5C of warming. Add in other greenhouse gases and we are in for 2C of warming without any more greenhouse gas emissions. It is only if climate sensitivity is much lower is it theoretically possible to prevent 2C of warming by drastically reducing global CO2 emissions. The IPCC, have concocted figures knowing that they do not reconcile back to their assumptions.

The questions arise are (a) where do the cumulative emissions figures come from? and (b) whether the UNIPCCC has copied these blatant errors in the COP processes?

This is an extended version of a comment made a Paul Homewoods’ notalotofpeopleknowthat blog.

Kevin Marshall

My Amazon Review of Ladybird Book of Climate Change

The following is my Amazon review of Ladybird Book of Climate Change.

The format goes back to the Ladybird Books of my childhood, with text on the left and a nice colour picture on the right. Whilst lacking in figures and references it provides an excellent summary of the current case of climate alarmism and the mitigation policies required to “save the world”. As such it is totally lopsided.
For instance, on page 35 is a drawing of 3 children holding a banner with “1.5 to stay alive”. The central estimate of the climate consensus since the Charney report of 1979 is that a doubling of CO2 levels will lead to 3C of warming. That means a rise from 280 to 400ppm would give 1.54C of warming. With the impact of the rise in other greenhouse gas levels the 2C of warming should already of happened. Either it is somehow hidden, ready to jump out at us unawares, or the the impact of emissions on climate has been exaggerated, so policy is not required.
The other major problem is with policy. The policy proposals are centered around what individuals in the UK can do. That is recycle more, eat less red meat and turn the heat down. There is no recognition that it is global GHG emissions that cause atmospheric GHG levels to rise. If the theory is correct, constraint of global warming means global emissions reductions. That includes the 80%+ of the global population who live in countries exempt from any obligation to constrain emissions. Including all the poorest countries, these countries accounted for all the emissions growth from 1990 to at least 2012.
If people genuinely want to learn about a controversial subject then they need to read different viewpoints. This is as true of climate change as history, economics or philosophy.

Ladybird Book on Climate Change

A couple of weeks ago there was a big splash about the forthcoming Ladybird Book for adults on Climate Change. (Daily Mail, Guardian, Sun, Telegraph etc.) Given that it was inspired by HRH The Prince of Wales, who wrote the forward, it should sell well. Even better, having just received a copy in a format that harks back to the Ladybird Books I grew up with. That is on each double page words on the left and a high quality coloured picture filling the right hand page. Unlike, the previous adult Ladybird series, which was humorous, this is the first in a series that seeks to educate.

The final paragraph of the forward states:-

I hope this modest attempt to alert a global public to the “wolf at the door” will make some small contribution towards requisite action; action that must be urgently scaled up, and scaled up now.

The question is whether there is enough here to convince the undecided. Is this is founded on real science, then there should be a sufficient level of evidence to show

(a) there is a huge emerging problem with climate.

(b) that the problem is human caused.

(b) that there are a set of potential steps that can be taken to stop constrain this problem.

(c) that the cure is not worse than the disease.

(d) that sufficient numbers will take up the policy to meet the targets.

My approach is is to look at whether there is sufficient evidence to persuade a jury. Is there evidence that would convict humanity of the collective sin of destroying the planet for future generations? And is there evidence that to show that, through humanity collectively working for the common good, catastrophe can be averted and a better future can be bequeathed to those future generations? That presumes that there is sufficient quality of evidence that an impartial Judge would not throw the evidence out as hearsay.

Evidence for an Emerging Problem with Climate.

Page 8 on melting ice and rising sea levels starts with the reduced Arctic sea ice. The only quantifiable estimate of the climate change other than the temperature graph on page 6, in claiming at the end of the 2016 melt season the sea ice levels were two-thirds that of at the end of the end of the twentieth century.

Any jury would hear that there has only been satellite data of sea ice extent since 1979; that this was the end of a period known as the “sea ice years“; that the maximum winter ice extent in April was likely less in the eighteenth century than today; that ships log books suggest that general sea ice extent was the roughly the same one hundred and fifty years ago as today; and that in the Antarctic average sea ice extent increase has largely offset the Arctic decrease.

The rest about sea levels correctly state both that they have risen; that the reasons for the rise are a combination of warming seas and melting ice caps. It is also correct that flooding occurs in storm surges. But there is no quantification of the rise in sea levels (about 8-12 inches a century), nor of the lack of evidence of the predicted acceleration.

Page 10 on heatwaves, droughts, floods and storms states that they can cause disruption, economic damage and loss of life. there are also recent examples, and speculation about future trends. But no evidence of emerging trends, particularly increasing loss of life. This lack of evidence is because the evidence of the harms of extreme weather appear on the decrease. Indur Goklany has been a rich source of the counter-evidence over many years.

Page 12 begins

Threats to food and water supply, human health and national security, and the risk of humanitarian crises are all potentially increases by climate change.

The rest is just padding out this speculation.

Page 14 is on disappearing wildlife. One quote

The polar bear has come to symbolize the threats posed to wildlife by climate change….

You can probably find many images of starved dead polar bears to back this up. But the truth is that this creatures live by hunting, and as they get older slow down, so are no longer fast enough to catch seals, their main food source. Zoologist Susan Crockford has a blog detailing how polar bear numbers have increased in recent years, and far from being threatened the species is thriving.

The climate change problem is mostly human caused

The book details that emissions of greenhouse gas levels have gone up, and so have the levels of greenhouse gases. The only quantities is for CO2, the major greenhouse gas. (Page 20) There is simple diagram explaining how CO2 emissions impacts on atmospheric CO2 levels, before explaining the major sources of the net increase – fossil fuel emissions and clearing forests. There is no actual testing of the theory against the data. But Page 20 begins

The scientific evidence shows that dominant cause of the rapid warming of the Earth’s climate over the last half century has been the activities of people…

The relevant quote from UNIPCC AR5 WG1 SPM section D3 says something slightly differently.

It is extremely likely that more than half of the observed increase in global average surface temperature from 1951 to 2010 was caused by the anthropogenic increase in greenhouse gas concentrations and other anthropogenic forcings together.

The extremely likely phrase is a Bayesian estimate. It is a belief that should be updated on the best available evidence. Lack of evidence, after much searching, suggests the original guess was wrong. Therefore true Bayesians would downgrade their certainties if they cannot refine the estimates over time. But this was written in 2013. Since the Carney Report of 1979 and the previous four IPCC reports of 1990 to 2007, there has been no refinement in the estimate of how much warming will eventually result from a doubling of CO2.

But how does the evidence stack up? On page 6 there is a chart of global surface temperature anomalies. That increase in temperatures can be tested against the doubling effect of CO2. Since around the turn of century the rate of rise in CO2 emissions and atmospheric CO2 levels has accelerated. But global warming stopped  for over a decade until 2014, only to restart due to a natural phenomena. Comparing the actual data to the theory, fails to support the strong beliefs that GHG emissions are the dominant cause of recent warming. 

Policy to contain the problem

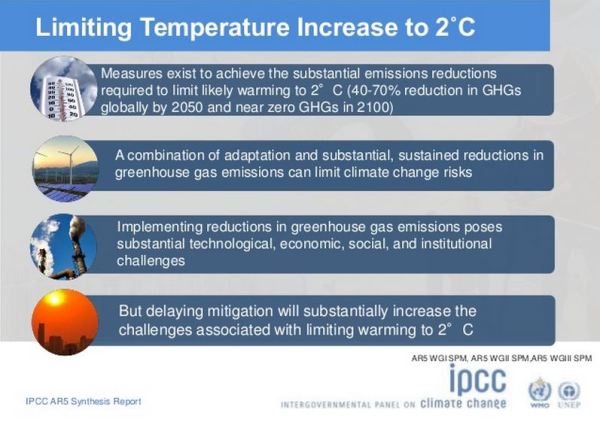
Page 34 go into the benefits of containing warming to 1.5C. Given that the central estimate from the climate community since 1979 has been that a doubling of CO2 will lead to and eventual rise in average temperature of 3C, a rise in CO2 levels from the pre-industrial levels of 280ppm to 400ppm reached in 2015 would give 1.544C of warming. With other greenhouse gases it should be nearer to 2C of warming. Either it is way too late (and the warming is lurking like the Loch Ness monster is the dark and murky depths) or the central estimate is exaggerated. So the picture of three young people holding a banner with 1.5 to stay alive is of the doomed who we can do nothing about, or false alarmism.

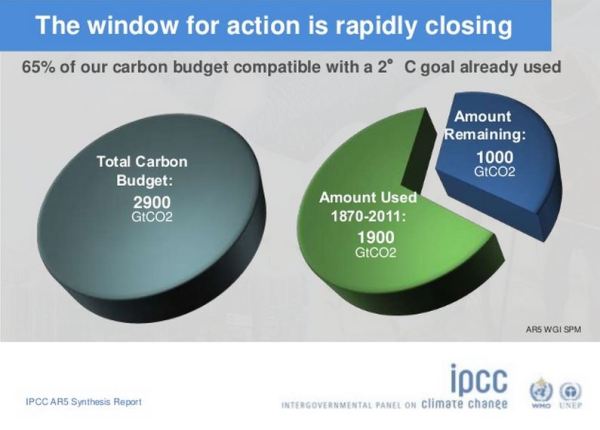
Page 36 has a nice graphic adopted from the IPCC Synthesis Report of 2014, showing the liquid dripping through an egg-timer. It shows the estimate that 2000 billion tonnes of CO2 have been emitted so far, 1000 billion tonnes can be emitted before the 2 C of warming is breached. This was from a presentation to summarize the IPCC AR5 Synthesis Report of 2014. Slide 33 of 35.

Problem is that this was the data up to 2011, not five years later to 2016; it was for GHG emissions in billions of tonnes of CO2 equivalents; and the 40 billions tonnes of CO2 emissions should be around 52-55 billion tonnes CO2e GHG emissions. See for instance the EU Commission’s EDGAR figures, estimating 54GtCO2e in 2012 and 51GtCO2e in 2010 (against the IPCCs 49 GtCO2e). So the revised figure is about 750GtCO2e of emissions before this catestrophic figure is breached. The Ladybird book does not have references, to keep things simple, but should at least properly reflect the updated numbers. The IPCC stretched the numbers in 2014 in order to keep the show on the road to such extent that they fall apart on even a cursory examination. The worst part is at the very top of the egg-timer, coloured scarlett is “Coal, oil and gas reserves that cannot be used“. These are spread across the globe. Most notably the biggest reserves are in China, USA, Russia, Canada, Australia, Middle East and Venezuela, with the rest of the World have a substantial share of the rest.

The cure is worse than the disease

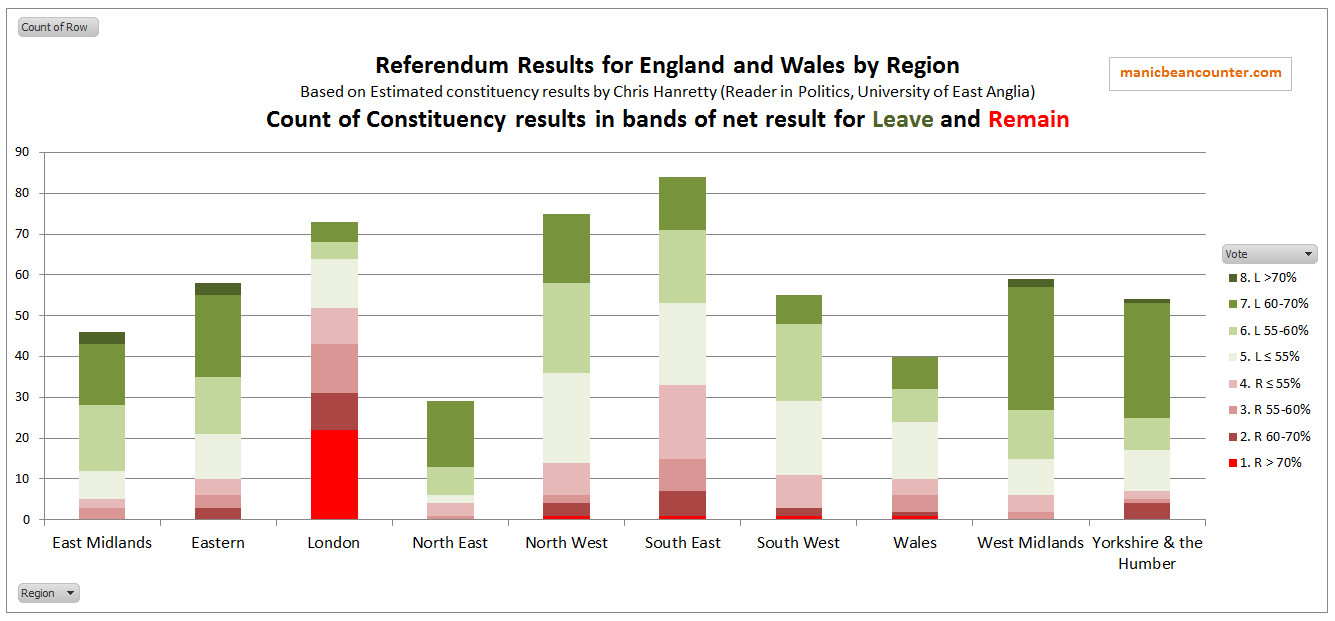
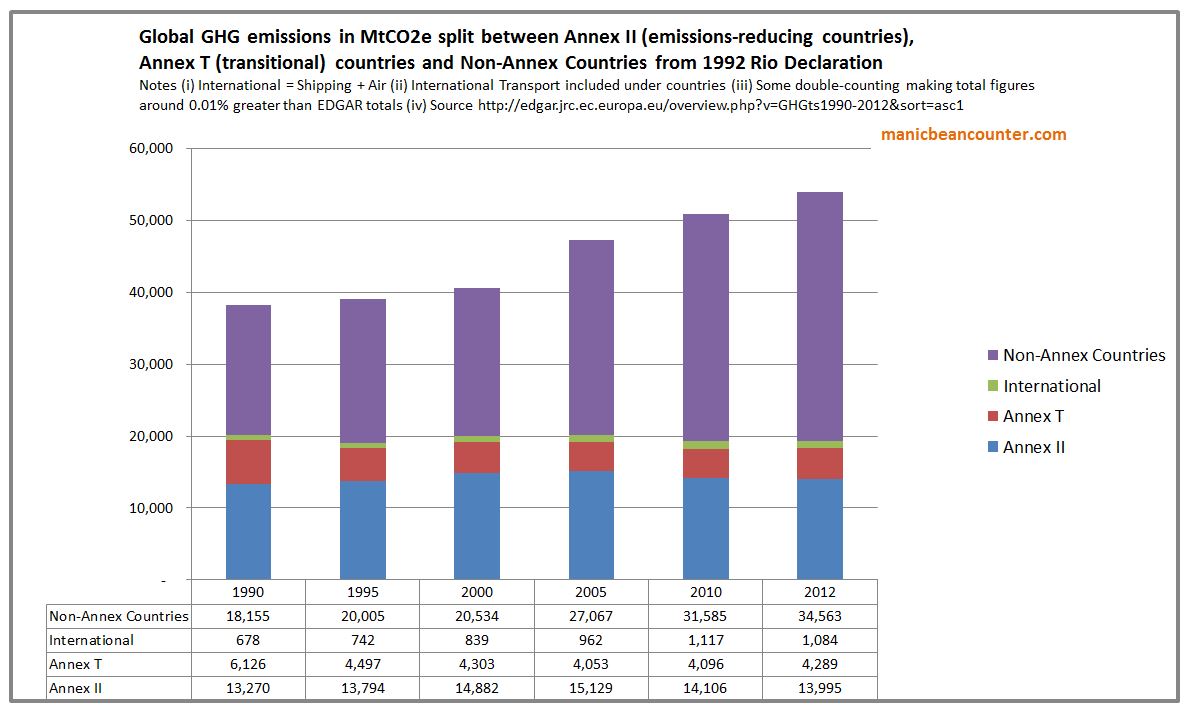
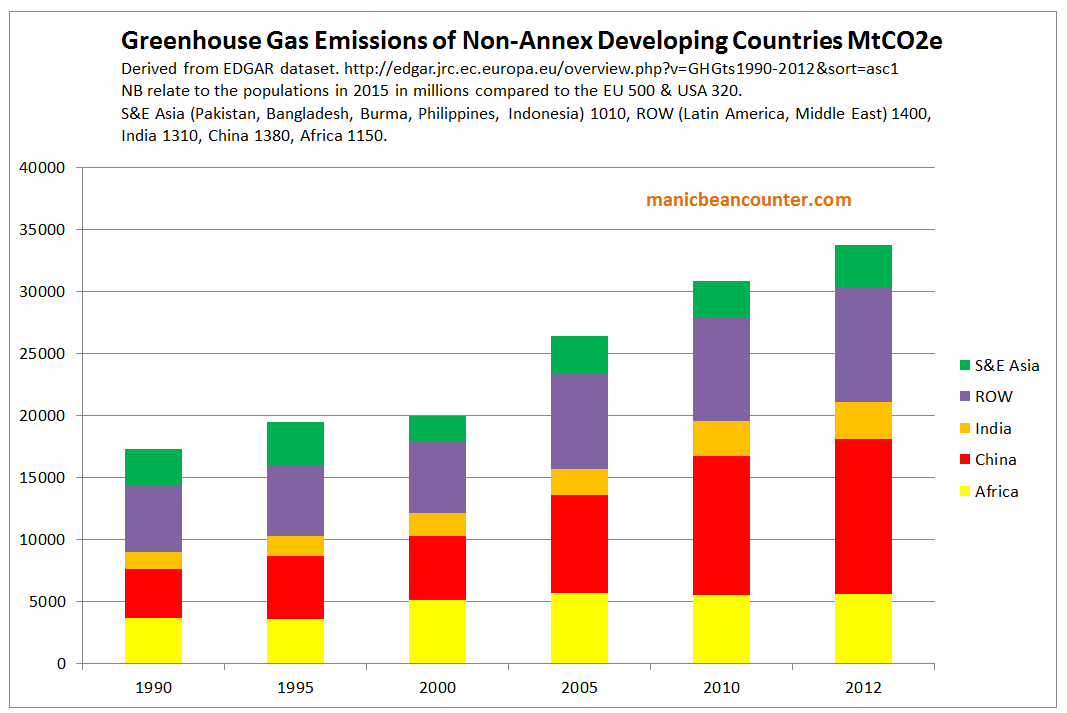
For the rest of the book to suggest European solutions like recycling, eating less red meat, turning down the heating to 17C and more organic farming, the authors write about making very marginal differences to emissions in a few countries with a small minority of global emissions. Most of those reserves will not be left in the ground no matter how much the first in line to the Throne gets hot under the collar. The global emissions will keep on increasing from non-policy countries with over 80% of the global population, two-thirds of global emissions and nearly 100% of the world’s poorest people. Below is a breakdown of those countries.

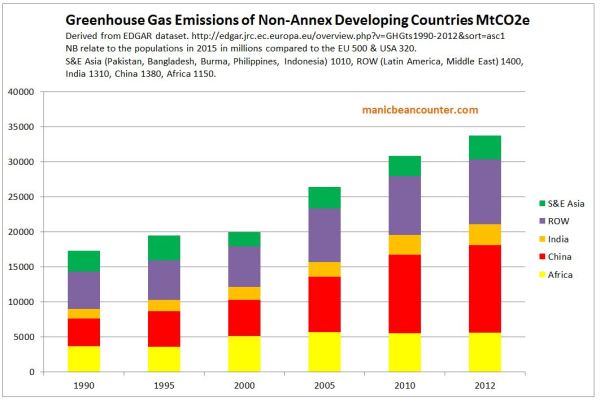
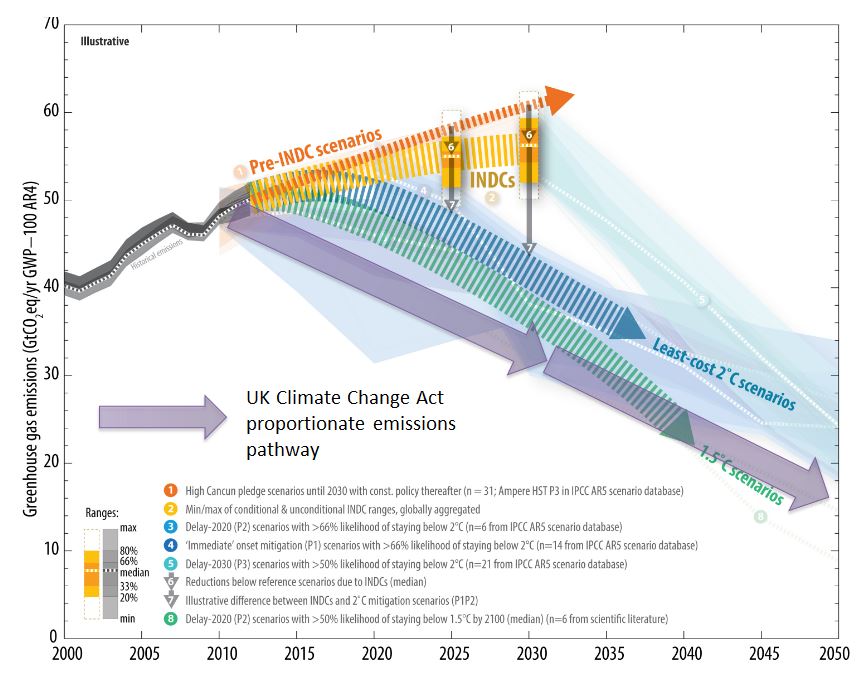
These countries collectively produced 35000 MtCOe in 2012, or 35 GtCO2e. That will increase well into the future short of inventing a safe nuclear reactor the size weight and cost of a washing machine. Now compare to the global emissions pathways to stop the 1.5C  or 2C of warming prepared by the UNFCCC for the 2015 Paris talks.


The combined impact of all the vague policy proposals do not stop global emissions from rising. It is the non-policy developing countries that make the real difference between policy proposals and the modelled warming pathways. If those countries do not keep using fossil fuels at increasing rates, then they deprive billions of people of increasing living standards for themselves and their children. Yet this must happen very quickly for the mythical 2C of warming not to be breached. So in the UK we just keep on telling people not to waste so much food, buy organic, ride a bike and put on a jumper.

There is no strong evidence would convict humanity of the collective sin of destroying the planet for future generations. Nor is there evidence that to show that a better future can be bequeathed to those future generations when the policies would destroy the economic future of the vast majority. The book neatly encapsulates how blinkered are the climate alarmists to both the real-world evidence and the wider moral policy perspectives.

Kevin Marshall


Carbon Capture and Storage Loses another £100m but saves up to £10bn

Last week the National Audit Office published a report Carbon Capture and Storage: the second competition for government support. The main headline was

“The Department has now tried twice to kick start CCS in the UK, but there are still no examples of the technology working. There are undoubtedly challenges in getting CCS established, but the Department faced an uphill battle as a result of the way it ran the latest competition. Not being clear with HM Treasury about what the budget is from the start would hamper any project, and caused particular problems in this case where the upfront costs are likely to be high. The Department must learn lessons from this experience if it is to stand any chance of ensuring the first CCS plants are built in the near future.”

Amyas Morse, head of the National Audit Office, 20 January 2017

Key elements

  • Two Projects in the Competition.
  • When project cancelled £100m had already been spent.
  • The first competition running from 2007 to 2011.
  • Full subsidy from the Treasury (i.e. Taxpayers) would have been £1 Billion
  • Over 15 years, subsidy from consumers would have been £3.9 Billion to £8.9 Billion
  • Would have captured 1Mt to 2 Mt of CO2 a year.
  • Consumer subsidy between £105 and £172 Mwh, on top of the current wholesale price of around £45 Mwh.

The BBC carried the story, correctly citing many of the costs, as did the Express, which stated

At the time it was cancelled, the competition had two preferred bidders: the White Rose consortium in North Yorkshire which planned to build a new coal plant with the technology, and Shell’s scheme in Peterhead, Aberdeenshire, to fit CCS to an existing gas plant operated by SSE.

The NAO report said the department initially estimated it would cost consumers – who would subsidise electricity from the schemes – between £2 billion and £6 billion over 15 years, but by 2015, this estimate had risen to as much as £8.9 billion.

The report found the Treasury was concerned over the costs to consumers, and that the competition was aiming to deliver CCS before it was cost-efficient to do so.

Joanne Nova points to a July 2015 post on the subject of CCS by Anton Lang. He stated

CCS artificially raises the costs of coal fired power in two ways

First, it raises the initial construction cost for any new large scale coal fired plant by around 60%.

Second, the CCS process is hugely energy intensive — consuming up to 40% of the electricity generated by the plant. So  the plant can only sell 60% of the actual power it produces.

As a (slightly manic) beancounter, I like to put the costs in context.

  1. How much would the cost have been if the Treasury had not pulled the plug per tonne of CO2 saved?
  2. What is the value of the subsidy be if China and India adopted the plan?

In the full NAO report (a 389kb pdf) Figure 6 gives details of the two schemes shortlisted in the competition.

It is the Peterhead scheme that would incur the lower subsidy of £105 Mwh. The £3.9 billion works out at an average 290 Mw production, or 76% of capacity over 15 years. It is cheaper due to adapting old plant. The disadvantage is that there is only 30 Mt of CO2 storage capacity in the area, so the area does not have the facility to develop much more unless further infrastructure development is made to pump the CO2 offshore into old oil wells.

The White Rose scheme has higher subsidy of £172 Mwh. The £8.9 billion works out at an average 394 Mw production, or 88% of capacity over 15 years. It is new plant, but has the advantage of 520 Mt of CO2 storage capacity in the area.

If we add in the £1bn subsidy without interest, over 15 years the cost per tonne of CO2 saved is about £264 (US$330, A$435) for the Peterhead project and £300 (US$374, A$490) for the White Rose project.

The NAO report in figure 12 that the subsidy could come down to £94 Mwh with scale.

Let us see what would be the cost if India and China adopted CCS for the current coal-fired power stations, but increasing capacity by 25% to cover the efficiency losses. Assume subsidy is just $100 Mwh.

According to Greenpeace (could be unreliable), China has about 900,000 MW of capacity. Add in 25% and assume 70% capacity, gives around $700bn a year subsidy. This is about 6% of current GDP.

From Wikipedia, India had 310 000 MW of capacity in 2015.  Add in 25% and assume 70% capacity, gives around $240bn a year subsidy. This is about 12% of current GDP.

I am sure that China and India will want to follow the UK’s lead. The only slight issue is finding a hole big enough. Maybe instead they could build some big greenhouses and grow tomatoes very rapidly.

Kevin Marshall


Bernie Saunders demonstrates why he was not fit to be President

Senator Bernie Saunders of Vermont was for a while running a close second to Hillary Clinton in the Democrat Primaries. Had his extreme left views, advanced years and the fact that he is the junior Senator from the 49th most populous State, he might have stood a chance against a former First Lady and Secretary of State. But Senator Sanders’ recent questioning of Scott Pruitt shows why he is unfit for high office. Ron Clutz has transcribed more of the dialog, by I think two statements encapsulate this.

At 0.45

As you may know, some 97% of scientists who have written articles for peer-reviewed journals have concluded that climate change is real, it is caused by human activity, and it is already causing devastating problems in the US and around the world. Do you believe that climate change is caused by carbon emissions from human activity?

There is no 97% survey of scientists which conclude these things. As Ron Clutz observes the nearest to definite questions was Examining the Scientific Consensus on Climate Change – Doran and Zimmerman 2009, where the second question was

2. Do you think human activity is a significant contributing factor in changing mean global temperatures?

One could answer “yes” if you thought that 10% of the rise in the was due to land use changes, and the rest due to natural factors. It does not ask about fossil fuel emissions, and the question allows for belief in other factors other than human activity whether known or unknown. Neither does it ask if temperature rise is net harmful, with huge devastating impacts already evident.

There is also the Cook et. al survey of peer-reviewed academic papers that I looked after listening to a lecture Cook gave at Bristol University in late 2014. The survey just looked to the assumption that humans cause some warming, whether explicit or implied. Like the Doran and Zimmerman survey it is just hearsay. This Sen. Sanders presents as good evidence that there is already a clear catastrophic problem caused by changes in the climate. If there is real and overwhelming evidence, why does Sen. Sanders not refer to that instead of misrepresenting bogus opinion polls?

Senator Sanders then goes even further.  At 1.50

While you are not certain, the vast majority of scientists are telling us that if we do not get our act together and transform out energy system away from fossil fuel there is a real question as to the quality of the planet that we are going to be leaving our children and our grandchildren. So you are applying for a job as Administrator at the EPH to protect our environment. Overwhelming majority of scientists say we have to act boldly and your’re telling me that there needs to be more debate on this issue and that we should not be acting boldly.

Sanders now says a majority of scientists are telling us we must change our energy systems. Aside from the fact that only a very small minority of scientists have any sort of competency in the field of climate, (and there is evidence a lot of demonstrated incompetency within the small group e.g. here), they have no expertise in the economic or moral cases for policy. For policy the interpretation of the moral imperatives and the practical possibilities should be the realm of politicians. For those who sit on specialist committees, they should at least have their own developed views on the field.

Senator Bernie Saunders has taken some very dodgy opinion polls, grossly exaggerated the findings, and then ascribed statements to the climatologists that are far removed, and way beyond, any competencies they might have. As I see it, the role of President of the United States, as a leader, is to critically interpret what they are given in order to make decisions for the nation. That is the exact opposite of what Sanders did last week.

Kevin Marshall 


Tristram Hunt MP confirms the Labour split on Brexit

In July, following the Brexit vote, I made a couple of posts looking at Chris Hanretty’s has estimated EU referendum vote split for the 574 parliamentary constituencies in England and Wales. In the The Democratic Deficit in the Referendum Result, I concluded

The results show two things.
First is that there is a huge divergence in Referendum vote across the English and Welsh constituencies.
Second is that a disproportionate number of the constituencies with strong votes either for remaining in the EU or leaving the EU have a Labour Party MP.

The divergence is shown by two graphs of the Leave / Remain constituency split by region  – the overall result and the 231 constituencies with a Labour MP

The second post looked at the seats that Labour must win if it is to become the largest party at the next General Election. In England and Wales most of the target seats voted to leave the EU. But in Scotland, where Labour lost 40 seats to the SNP, every single constituency likely voted to remain in the EU. Further in London, which was strongly remain, reside about 40% of Labour members. There is a fundamental split.

One of the most Pro-Leave constituencies is Stoke on Trent Central. Pro-Remain Labour MP Tristram Hunt is resigning to take up the prestigious post of Director of the V&A Museum. Guido Fawkes had a post this afternoon TRISTRAM HUNT ON LABOUR’S EXISTENTIAL CRISIS.

Guido’s comment concurs with what I have concluded:-

In other words, Labour is increasingly irrelevant in Brexit Britain, and Tristram doesn’t have the answer…

Kevin Marshall

Tim Farrons false claims on the EU Referendum Vote

Yesterday, in reaction to Prime Minister Theresa May clearly laying out the Brexit means leaving the European Union, Liberal Democrat leader Tim Farron was vocal in denouncing what was said. On the positive side, despite having just 9 seats in Parliament and getting 8% of the vote, Farron was acting as an opposition spokesperson (an intentional aim) instead of the Leader of the Opposition who is nominally the Parliamentary leader of a Party that got nearly 4 times the number of votes and 29 times the number of seats as the Lib Dems in 2015. This attempted takeover of the role of Opposition is intentional.   However, Farron misrepresents those who, like me, voted leave.

Is it the case that Theresa May is opting for a hard Brexit that the vast majority of leave voters did not want? The primary reference source is a glossy pro-EU Government booklet that was delivered to every household in Britain. The Stronger Economy page is below.

This seems clearly to state that remaining in the EU means leaving the Single Market. What it implies – quite wrongly in my view – is that leaving that single market will mean the loss of lots of UK jobs that depend on EU trade.

On page 8 in bold, was stated:-

No other country has managed to secure significant access to the Single Market, without having to:

• follow EU rules over which they have no real say

• pay into the EU

• accept EU citizens living and working in their country

As immigration was a bit issue, people who voted leave as a way of controlling immigration were clear that this meant leaving the single market. Anyone who thought that an independent UK could pick and choose was clearly ignoring the statements from both sides.

But the worst part is that Tim Farron is claiming that Theresa May is acting undemocratically as the specific Brexit deal will not be put to a referendum. On June 23rd the British people voted to gain our Independence from the EU institutions. The major decision-making body of the EU is not democratically-elected; the budget is so opaque that nobody can exercise proper control of where the money is spent, and there has been no sign-off of the audited accounts in over 20 years. A half-in half-out deal would be even less democratic, whilst the Hard Brexit would mean that the democratically-elected Government of the United Kingdom of Great Britain & Northern Ireland would gain greater powers.

Kevin Marshall

Trump is wrong on China Global Warming Hoax but right on the policy consequences

Summary

  • Donald Trump’s famous tweet that Global Warming is a Chinese Hoax is false, but the policy implications are correct.

  • Total proposed climate policies under the Paris Agreement will not stop global emissions rising, but the policy aim is to have global emissions falling rapidly after 2020.

  • The Rio Declaration 1992 exempted developing countries from a primary obligation to constrain, let alone reduce, emissions. 

  • By 2012 the exempted countries accounted for 64% of global emissions and over 100% of the global emissions growth since 1990.

  • The exempted, countries will collectively have emissions rising for decades to come.

  • The most efficient policy is a carbon tax, applied globally. But even this is highly inefficient, only working by making fossil fuel use unaffordable to all but the very rich. That is morally unacceptable in developed countries, whilst would stop developing countries developing, likely leading to civil wars.

  • Actual climate mitigation policies are less efficient and more costly than a carbon tax.

  • Pursuing mitigation policies in just the developed countries harms the poor disproportionately and harms manufacturing. Such policies may not even reduce global emissions.

  • Even if catastrophic global warming is true, the policy reality is the same as if it were a hoax. In either case they are net harmful to the policy countries.

  • Like with utterly ineffective drugs that harm the patient, the rational response to climate mitigation policies is to ban them.


President-elect Donald Trump infamously claimed on Twitter

The concept of global warming was created by and for the Chinese in order to make U.S. manufacturing non-competitive.

I believe that statement to be totally false. The Chinese had nothing (or essentially nothing) to do with the climate alarmism that the Western intelligentsia (especially in the Anglosphere) seem to religiously accept as a series of a priori truths. But the policy implications of believing such a false position are pretty much the same for a policy-maker that (a) accepts as truth catastrophic global warming hypothesis, (b) puts their country first (but still values highly people in other countries, with an emphasis on the poor and the oppressed) (c) but understands the realities of global policy-making, along with the full economic impact of mitigation policy.

The Realities of Actual Mitigation Policy

The hypothesis is the basic form is that global human greenhouse gas emissions (mostly CO2) are resulting in rising greenhouse gas levels. This is forecast to cause large increases in global average temperatures, which in turn, many believe, will be catastrophic to the climate system. The major policy is to reduce the global greenhouse gas emissions to near zero.
The UNIPCC AR5 Synthesis Report, Summary for Policymakers 2014 tried to the maths very simple. They only looked at CO2 for the ballpark figures. Using the central assumption of a doubling of CO2 gives 3 degrees of warming, then 2 degrees comes when CO2 levels hit 450ppm. At end of 2016 it levels were about 404ppm, and rising at over 2ppm per year. Only is some warming from other greenhouse gases, so we are well beyond the 420ppm. That gives maybe 15 years tops. Somehow though figures seem to have been stretched a bit to give more time, something I will look at in a later post.
The UNFCCC – the body that brings all the countries together to cut emissions to save the planet – had an all-out bash at COP21 Paris in December 2015. In the lead-up all countries (excluding the EU countries, who let the masters in Brussels take the lead) made submissions on how they would contribute towards saving the world, or at least make a start up to 2030. Many were so vague, it was difficult to decipher the “ambition”. This was done to appear like the countries were doing something substantial, when in fact the proposals were often so insubstantial, that targets could be achieved by doing nothing at all. The UNFCCC put all the INDC submissions together on a global emissions graph.

The graph is very simple. Before the INDCs, emissions were forecast to follow the thin dark orange arrow. With the INDCs, the thick light orange forecast is still tracking upwards in 2030. The least-cost 2C scenarios is the blue arrow. This is going down by 2020, and by 2030 is substantially lower than today. The graph gives a very clear message – the whole exercise is pretty much an expensive waste of time. 40,000 people attended the meeting at Le Bourget airport North of Paris, including the vast majority of World Leaders. Rather than be honest, they went through the usual format with a breakthrough at five past midnight. Then they sent the “experts” away to think up yet more scary scenarios to get better proposals in the future.


Little More Policy will be Forthcoming

If they actually read the 1992 Rio Declaration, like Robin Guenier did in October 2015, they would have found out why. In particular Guenier draws attention to this statement in the declaration.

“The extent to which developing country Parties will effectively implement their commitments under the Convention … will take fully into account that economic and social development and poverty eradication are the first and overriding priorities of the developing country Parties.” [My emphasis]

These non-Annex 1 developing countries have had phenomenal economic growth, with driven by rapid development of cheap energy from fossil fuels. Guenier quotes some CO2 emissions figures. Instead, I have used the broader estimates of greenhouse gas emissions from the European Commissions’ EDGAR database, grouping the figures into the Annex I countries (the rich OECD countries, like the USA, Japan, European Union, Canada, Australia etc.); the Annex I Transitional economies (basically the ex-Soviet bloc in Europe); International air and shipping; and the Non-Annex, rest of the world.


The figures are quite clear. The growth in emissions in 22 years was greater in the Non-Annex developing countries than the world as a whole. But this is just the developing countries starting to catch up. The breakdown of the Non-Annex developing county emissions is below.

This “developing” part of the world now has 84% of the global population, but in 2012 was just 64% of the greenhouse gas emissions. India and China each have more than 4 times the population of the USA, Africa 3.5 times and S&E Asia 3 times. Whilst in China emissions growth will peak soon, in India emissions growth is only recently taken off.  In S&E Asia and Africa emissions growth has yet to really take off. No matter what the USA and a few other developed countries do, it will not make a big difference to the long-term outlook for GHG emissions. Now compare the global emissions to the UNFCCC graph of INDCs of the target emissions reductions for 2030. The UNFCCC scale is in billions of tonnes, whilst the scale I use is in millions. The least cost 2C scenario is lower in 2040 that the total non-Annex countries in 2012. Even without emissions growth in the non-Annex countries, the Annex countries could cut emissions by 100% and still the 2C limit will be breached by the 84% who live in countries with no obligation to cut their emissions.
But maybe the USA should cut emissions anyway? After all it will not cost much, so these developing nations will be brought into line. I only recently realized how wrong this view was. Economics Prof Richard Tol it one of the World’s leading climate economists, who (unlike me) happens to believe in the moral case for cutting greenhouse gas emissions. In a recent paper, “The Structure of the Climate Debate”, Tol explained how a global carbon tax was theoretically the most efficient means to reduce global greenhouse gas emissions. Use regulation, or rationing, or subsidies of renewables, and it will be more expensive – less bang for your bucks. However, I objected. He seemed to be saying that the carbon tax necessary to cut global emissions worked out at less than the taxation on gasoline in Britain. At over $3 (a level that is similar in much of Europe) there are still quite high levels of fuel usage. I can still remember my high school economics teacher, in teaching about elasticity of demand, said that a good example of inelastic demand were the “sin” taxes on booze, alcohol, tobacco and petrol (gasoline). You could have quite high taxes without impacting on demand. Well, after a few exchanges at cliscep blog turns out Tol (in the more technical Tol 2013 paper) was recommending a $210 tCO2 tax to be imposed in 2020 globally, plus an escalator of 5.5% a year forever. It would eventually make fossil-fuelled energy use unaffordable to all but the Hollywood A-listers. I showed British readers in GBP would that would mean, but for the US readers $210tCO2 is about $1.83 per gallon of gasoline. There would be uproar if it was introduced, and people might get more fuel efficient cars. With the escalator that would rise to over $3 a gallon in 2030, $9 2050, $35 in 2075 and$132 a gallon in 2100. There would also be similar hikes in electricity from coal and gas. This might not be fast enough to achieve the reductions required by the UNFCCC, but would not be sustainable in a country with democratic elections every few years.

But actual climate mitigation policies, are far less effective that the carbon tax. This includes subsidies or loan guarantees to speculative and unsustainable businesses, or flash renewable technologies that fail to deliver,

The carbon tax might be harmful to the poor and middle classes in America, but think of what it would do to the living standards of the poorest half of the world. Countries where parents are hoping that their children might enjoy cheap energy for cooking, lighting or heating, would see those hopes dashed. For billions of people their children or grandchildren would never have a family car, or be able to travel by plane. If the Governments of India, China or Indonesia tried to impose such high and escalating taxes there could be economic collapse similar to that of Greece, and likely civil wars.

Should the Rich countries still do something?

So maybe the United States, and other rich countries, should still adopt policies regardless. After all, they should pay for the (alleged) harms that are leading to disaster. But if the proposers had any understanding of the real world, they would know that just as economic growth has been propelled by abundant supplies of cheap, available and reliable energy. In international trade what is “cheap” is a relative concept. In the nineteenth century steam power was very expensive compared to electricity today. But at this point in time, when developing countries are make power more available and driving their unit energy costs down. Steam power was much cheaper, and more available than water power, which in turn was cheaper than human or animal power. Yet implementing emissions reduction policies, the rich countries are driving those unit energy costs up just as developing countries have been driving unit energy costs down and making power more available. The USA and EU countries are generating a comparative disadvantage. But, as the developed nations tend to be more energy efficient, the net effect on global emissions may be to increase them, despite the policy countries decreasing theirs. That net effect is unlikely to be as large as any actual savings in the policy countries. What is more, the costs of policy will fall on the poor, and those areas of employment with high energy usage and that compete internationally.

An argument for climate mitigation is that it is to make small sacrifices now to save future generations from the much larger costs of future catastrophic climate change. That is only true if global emissions are cut significantly, at a cost lower than the actual harmful impacts that would have occurred without policy. As policy to cut emissions will makes very little difference to global emissions, then the sacrifices could be of a small benefit in non-policy countries, but be to the net disadvantage of future generations in the policy countries. The biggest burden of the costs of policy will fall on the poorer sections of society and manufacturing in the policy countries.

The Moral Case Against Climate Mitigatiom

If the medical profession insisted on patients taking drugs that did not work and had harmful side effects, then in litigious America they would be sued for all they had, and likely jailed. But when the climate alarmists, back by the liberal establishment, insist on policy that cannot work and causes substantial harms they are not held to account. Indeed, so pervasive are the beliefs in climate alarmism, it is an act of heresy to even question this false policy. Now the tables are turned.

The first thing that should be done with harmful drugs that cannot work is to ban them from sale. For an incoming President, the first thing to do with harmful and useless policies is to rescind them.

Kevin Marshall


Friends of the Earth distorting the evidence for Fracking in the UK

Summary

Friends of the Earth have a webpage claiming to be “fracking facts”. The key points I make are.

  • The claims of dangers of fracking raise questions, that need to be answered before they can be considered credible.
  • The claim that fracking could affect house prices is totally unsupported.
  • The claim that shale gas will not significantly affect energy prices is based on out of date data. The British Geological Survey has shown that the potential of shale gas is huge. Friends of the Earth has played a major role in preventing that potential being realized.
  • FoE has consequently helped prevent shale gas from relieving the energy crisis brought upon by the Climate Change Act 2008.
  • Claims that pursuing shale gas in Britain will affect global emissions are pure fantasy. Also is a fantasy the belief that Britain is leading the way on emissions reductions. We ain’t leading if collectively the world is not following. The evidence shows clearly shows this.  

In the previous post I looked at how FoE blatantly mislead about an agreement they reached with the Advertising Standards Authority, which caused the unusual step of ASA Chief Executive Guy Parker issuing a strongly worded statement to defend the ASA’s integrity.

In this post I will look at FoE’s position on fracking, from Fracking definition? What does fracking mean? Read our fracking facts

I will look at various statements made (with FoE quotes in purple), showing how well they are supported by the evidence and/or providing alternative perspectives.

From the section What are the dangers of fracking?

Industry statistics from North America show that around 6% of fracking wells leak immediately.

Leaking wells lead to a risk of water contamination. Lord Smith, former chair of the Environment Agency, has said this is the biggest risk posed by fracking.

So it’s particularly concerning that the Government has now said it will allow fracking companies to drill through aquifers which provide household drinking water.

This raises some questions.

  • If leaks are a problem, with respect to fracking in the UK has this been risk assessed, with appropriate measures taken to prevent leaks?
  • Does that statistic of 6% allow for when there is natural leakage in the area of fracking leaking in the water supplies are venting into the atmosphere in the area where fracking is occurring? This was the case in the images of the flaming water faucet in the movie Gasland.
  • Have there been steps taken in the USA to reduce genuine leaks?
  • Has the proportion of wells leaking gas in the USA been increasing or decreasing?
  • Has the average amount of gas leaked been increasing or decreasing?
  • How when extracting gas from well below water aquifers, through a lined tube, that is both water-tight and gas-tight, is that gas (and fracking fluids) meant to leech into the water supply?

Then there is the statement without evidence.

Fracking could also affect house prices.

This was one of the issues FoE in its agreement with the ASA have the assurance not to repeat claims that fracking affects property prices, unless the evidence changes. Legally there might be cop-out where that assurance does not apply to claims made on its website. Literally, the statement is not untrue, just as the claim that a butterfly flapping its wings on the North Downs could lead to a typhoon in the South China Sea.

Would fracking bring down energy bills?

It’s very unlikely. Fracking company Cuadrilla has admitted that any impact on bills would be “basically insignificant”.

Claims that fracking would create a lot of jobs have also been overstated. According to Cuadrilla, each of its proposed 6-year projects in Lancashire that were recently rejected by the council would only have created 11 jobs.

The claim about Cuadrilla is sourced from an Independent article in June 2013.

“We’ve done an analysis and it’s a very small…at the most it’s a very small percentage…basically insignificant,” said Mark Linder, a public relations executive at Bell Pottinger who is also responsible for Cuadrilla’s corporate development.

The article later says

“According to Poyry, Lancashire shale gas production could also reduce the country’s wholesale gas and electricity prices by as much as 4 per cent between 2014 and 2035, which corresponds to an average saving of £810m/year,”

It is not surprising that shale gas developments in Lancashire alone will not have a significant impact on UK energy prices, especially if that is restricted to a few sites by one company. But over three years later the landscape has changed. The British Geological Survey has been publishing estimates of the quantities of shale gas (and oil) that exists beneath the ground.

The figures are at first hard to comprehend. They are large numbers in units of measure that ordinary people (even people with some knowledge of the field) find hard to comprehend, let alone put into some perspective. In my view, the figures need to be related to annual British consumption. Page 8 of the DECC UK Energy Statistics, 2015 & Q4 2015 estimates gas demand at 794 TWh in 2015.

The BGS uses tcf (tera cubic feet) for its’ estimates, which (like a domestic gas bill) can be converted from TWh. The 794 TWh is about 2.7 tcf. Not all shale gas is recoverable. In fact possibly only 10% of reserves is recoverable on existing technology, and depending on the quality of the deposits.

There are also shale oil deposits, measured by the BGS in both barrels and millions of tonnes. Refinery production (a rough estimate of consumption) was 63 million tonnes in 2015. I will again assume 10% recovery, which may be overly prudent.

The biggest shock was published just a few weeks after the Independent article on 27th July 2013. The size of the Bowland shale was truly staggering. The central estimate is 1329 tcf, meaning enough to satisfy 49 years of current UK gas demand. Potentially it is more, due to the depth of deposits in many areas. No significant deposits of oil are thought to be present

On 23rd May 2014 BGS published the results for the Weald Basin, a large area in the South East of England. Whilst there were no significant deposits of gas, the central estimate of 591 million tonnes is enough to supply the UK for one year.

On 25 June 2014 the Welsh Government published the estimates for Wales. The main gas deposits are thought to be in Wrexham/Cheshire and in South Wales and estimated about 65 tcf, or just over two years of UK demand. (Strictly the Welsh estimate is somewhat below this, as Wrexham is on the Welsh border and Cheshire is an English county. )

On 23rd May 2014 BGS published the results for the Midland Valley of Scotland. The central estimate for shale gas was 80.3 tcf (3 years of UK demand) and for shale oil 800 million tonnes (15 months of refinery production).

Most recently on 13th October 2016, BGS published the results for the Jurassic shale of the Wessex area. Central estimate for shale oil was 149 million tonnes, equivalent to three months of UK refinery production.

In all, conservatively there is estimated to be sufficient gas to supply the UK for over 54 years and oil for two and half years. The impact on supply, and therefore the impact on jobs and (in the case of gas) on energy prices, demands on the ability of businesses to profitability develop these resources. As has happened in the USA, the impact on jobs is mostly dependent on the impact on prices, as low prices affect other industries. In the USA, industries that are sensitive to energy prices (or use gas as a raw material) have returned from overseas, boosting jobs. FoE has played no small part in delaying planning applications with spurious arguments, along with generating false fears that could have made regulations more onerous than if an objective assessment of the risks had been made.

Fracking can’t help any short term or medium term energy crisis.

Even if the industry was able to move ahead as fast as it wants, we wouldn’t see significant production until about 2025.

This is actually true and up to date. If it were not for the Climate Change Act along with eco-activists blocking every move to meet the real energy demands in the most affordable and efficient way possible, there would be no prospective energy crisis. In terms of shale gas meeting energy demands (and gas-fired power stations being built) FoE should claim some of the credit for preventing the rapid develop of cheap and reliable energy sources, and thus exacerbating fuel poverty.

Will fracking help us to tackle climate change?

Shale gas and shale oil are fossil fuels. They emit greenhouse gases. Avoiding the worst impacts of climate change means getting off fossil fuels as soon as possible.

Scientists agree that to stop dangerous climate change, 80% of fossil fuels that we know about need to stay in the ground.

Setting up a whole new fossil fuel industry is going in completely the wrong direction, if the UK is to do its fair share to stop climate change.

The hypothesis is that global emissions lead to higher levels of greenhouse gases. In respect of CO2 this is clear. But the evidence that accelerating rate of rise in CO2 levels has led to accelerating average global temperatures is strongly contradicted by real world data. There is no scientific consensus that contracts this conclusion. Further there is no proper scientific evidence to suggest that climate is changing for the worse, if you look at the actual data, like leading climate scientist Dr John Christy does in this lecture. But even if the catastrophic global warming hypothesis were true (despite the weight of real world data against it) global warming is global. Britain is currently emitting about 1.1% of global emissions. Even with all the recently discovered shale gas and oil deposits, under the UK is probably less than 1% of all estimated fossil fuel deposits. Keeping the fossil fuels under British soil in the ground will do nothing to change the global emissions situation.  Britain tried to lead the way with the Climate Change Act of 2008, in committing to reduce its emissions by 80% by 2050. The INDC submissions leading up to COP21 Paris in December 2015 clearly showed that the rest of the countries were collectively not following that lead. The UNFCCC produced a graph showing the difference of the vague policy proposals might make.  I have stuck on the approximate emissions pathway to which the UK is committed.

The FoE is basically objecting to fracking to keep up the appearance that the UK is “doing its bit” to save the world from catastrophic global warming. But in the real world, global warming ain’t happening, neither are the predicted catastrophes. Even if it were, whatever Britain does will make no difference. FoE attempting to deny future jobs growth and stop the alleviation of fuel poverty to maintain the fantasy that Britain is leading the way on climate change.

 Isn’t it better to have our own gas rather than importing it?

…….

If we went all out for shale, our gas imports would stay at current levels as the North Sea supply declines – and imports could increase by 11%.

This claim, without any reference, is based likely based on the same out of date sources as below. If FoE and fellow-travellers kept out of the way with their erroneous legal challenges and distortions then shale gas has a huge potential to cause imports to decline.

Kevin Marshall

Friends of the Earth still perverting the evidence for fracking harms

Yesterday, the Advertising Standards Authority at long last managed to informally resolve the complaints about a misleading leaflet by Friends of the Earth Trust and Friends of the Earth Ltd. This is no fault of the ASA. Rather FoE tried to defend the indefensible, drawing out the process much like they try to draw out planning inquiries. From the Guardian

“After many attempts by Friends of the Earth to delay this decision, the charity’s admission that all of the claims it made, that we complained about, were false should hopefully put a stop to it misleading the UK public on fracking,” said Francis Egan, chief executive of Cuadrilla. …..

According to the BBC

Friends of the Earth (FOE) must not repeat misleading claims it made in an anti-fracking leaflet, the advertising watchdog has said.

The fundraising flyer claimed fracking chemicals could pollute drinking water and cause cancer and implied the process increases rates of asthma.

The charity “agreed not to repeat the claims,” the Advertising Standards Authority (ASA) said.

All pretty clear. As the BBC reports that the eco-worriers are not to be told that they are misleading the public.

Donna Hume, a campaigner for the environmental charity, said it would “continue to campaign against fracking” because it was “inherently risky for the environment”.

……..

Ms Hume said Cuadrilla “started this process to distract from the real issues about fracking” and was trying to “shut down opposition”.

“It hasn’t worked though. What’s happened instead is that the ASA has dropped the case without ruling,” she said.

“We continue to campaign against fracking, alongside local people, because the process of exploring for and extracting shale gas is inherently risky for the environment, this is why fracking is banned or put on hold in so many countries.”

Donna Hume was just acting as mouthpiece to the FoE, who issued a misleading statement about the case. They stated

Last year fracking company Cuadrilla complained to the Advertising Standards Authority about one of our anti fracking leaflets.

But after more than a year, the complaint has been closed without a ruling.

The scientific evidence that fracking can cause harm to people and the environment keeps stacking up. Friends of the Earth is not alone in pointing out the risks of fracking, to the climate, to public health, of water contamination, and to the natural environment.

ASA Chief Executive Guy Parker, took the unusual step of setting the record straight.

But amidst the reports, the public comments by the parties involved and the social media chatter, there’s a risk that the facts become obscured.

So let me be clear. We told Friends of the Earth that based on the evidence we’d seen, claims it made in its anti-fracking leaflet or claims with the same meaning cannot be repeated, and asked for an assurance that they wouldn’t be. Friends of the Earth gave us an assurance to that effect. Unless the evidence changes, that means it mustn’t repeat in ads claims about the effects of fracking on the health of local populations, drinking water or property prices.

Friends of the Earth has said we “dropped the case”. That’s not an accurate reflection of what’s happened. We thoroughly investigated the complaints we received and closed the case on receipt of the above assurance. Because of that, we decided against publishing a formal ruling, but plainly that’s not the same thing as “dropping the case”. Crucially, the claims under the microscope mustn’t reappear in ads, unless the evidence changes. Dropped cases don’t have that outcome.

The ASA, which tries to be impartial and objective, had to take the unusual statement to combat FoE deliberate misinformation. So what is the scientific evidence that FoE claim? This from the false statement that ASA was forced to rebut.

The risks of fracking

In April 2016, a major peer-reviewed study by research institute PSE Healthy Energy was published in academic journal PLOS ONE, which assessed 685 pieces of peer-reviewed scientific literature from around the world over 2009-2015 and found:

  • “84% of public health studies contain findings that indicate public health hazards, elevated risks, or adverse health outcomes”

  • “69% of water quality studies contain findings that indicate potential, positive association, or actual incidence of water contamination”

  • “87% of air quality studies contain findings that indicate elevated air pollutant emissions and/or atmospheric concentrations”

I suggest readers actually read what is said. Hundreds of studies cannot identify, beyond reasonable doubt, that there is a significant large risk to human health. If any single study did establish this it would be world news. It is just hearsay, that would be dismissed by a criminal court in the UK. A suggestion is from what the  PLOS-ONE Journal does not include in the submission criteria, that is normal in traditional journals – that submissions should have something novel to say about the subject area. As an online journal it does not have to pay its way by subscriptions, as authors usually have to pay a fee of $1495 prior to publication.

But this still leaves the biggest piece of misinformation that FoE harps on about, but was not included in the ruling. Below is the BBC’s two pictures of the leaflet.

foe-false-fracking-leaflet-bbc

foe-false-fracking-leaflet-bbc2

It is the the issue of climate change that goes unchallenged. Yet it is the most pernicious and misleading claim of the lot. If fracking goes ahead in the UK it will make not a jot of difference. According to the EU EDGAR data the UK emitted just 1.1% of global GHG emissions in 2012. That proportion is falling principally because emissions are rising in other countries. It will continue to fall as emissions in developing countries rise, as those countries develop. That is China, India, the rest of South East Asia and 50+ African nations. These developing countries, which are exempt from any obligation to constrain emissions under the 1992 Rio Declaration, have 80% of the global population and accounted for over 100% of emissions growth between 1990 and 2012. I have summarized the EDGAR data below.

ghg-ems-annnon

So who does the FoE speak for when they say “We could trigger catastrophic global temperature increases if we burn shale in addition to other fossil fuels“?

They do not speak for the USA, where shale gas has replaced coal, and where total emissions have reduced as a result, with real pollutants falling. There the bonus has been hundreds of thousands of extra jobs. They do not speak for China where half of the global increase (well 53%) in GHG emissions between 1990 and 2012 occurred. They cannot speak for Britain, as if it triggers massive falls in energy costs like in the USA (and geologically the North of England Bowland shale deposits look to be much deeper than the US deposits, so potentially cheaper to extract) then industry could be attracted back to the UK from countries like China with much higher emissions per unit of output.

Even worse, F0E do not speak for the British people. In promoting renewables, they are encouraging higher energy prices, which have lead to increasing fuel poverty and increased winter deaths among the elderly. On the other hand the claims of climate catastrophism from human emissions look to be far fetched when this century global average temperature rises have stalled, when according to theory they should have increased at an accelerated rate.

Kevin Marshall

Update 7th Jan 11am

Ron Clutz has posted a good summary of the initial ruling, along with pointing to a blog run by retired minister Rev. Michael Roberts, who was one of the two private individuals (along with gas exploration company Cuadrilla) who made the complaint to ASA.

The Rev Roberts has a very detailed post on the 4th January giving extensive background history of FoE’s misinformation campaign against shale gas exploration in the Fylde. There is one link I think they should amend. The post finishes with what I believe to be a true statement.

Leaflet omits main reason for opposition is Climate change

https://www.foe.co.uk/page/no-fracking-lancashire

The link is just to a series of posts on fracking in Lancashire. It is one of them is

Lancashire fracking inquiry: 3 reasons fracking must be stopped

The first reason is climate change. But rather than relate emissions to catastrophic global warming, they point to the how allowing development of fossil fuels appears in relation to Government commitments made in the Climate Change Act 2008 and the Paris Agreement. FoE presents their unbalanced case in much fuller detail in the mis-named Fracking Facts.

Update 2 7th Jan 2pm

I have rechecked the post Cuadrilla’s leaflet complaint is closed without a ruling, while evidence of fracking risks grows, where Friends of the Earth activist Tony Bosworth makes the grossly misleading statement that ASA closed the case without a ruling. The claim is still there, but no acknowledgement of the undertaking that F0E made to ASA. F0E mislead the public in order to gain donations, and now tries to hide the information from its supporters by misinformation. Below, is a screenshot of the beginning of the article.