Evangelical Christians and Climate Change Skepticism

Wm Briggs reports on a “forthcoming Bulletin of the American Meteorological Society paper “Making the climate a part of the human world”, in which University of British Columbia geographer Simon Donner argues that religion is the cause of global warming denial. ” (Pre-publication copy here)

Simon Donner’s Views

Donner’s Summary is

“Ongoing public uncertainty about climate change is rooted in a perceived conflict between the scientific evidence for a human role in the climate and a common belief that the weather and climate are controlled by higher powers.”

This is backed up by a number of studies of religions, both ancient and primitive religions from various parts of the world. This includes from Fiji and Papua New Guinea. I can find no reference to the major religions of Islam, Hinduism or Buddhism. There is only one biblical reference, from the Old Testament book of Job, but none from the New Testament – the stories about Jesus and his disciples. Neither is there a distinction between Catholicism and Protestantism, nor a split between evangelical and liberal protestants.

The Religious Sceptics in USA

The majority of the religious sceptics in the USA are the Protestant Evangelicals. Their type of Christianity is centred on biblical study, both individually and corporately, to perceive the revealed word of God and the interpretation for current circumstances. There are the specialists – the ordained pastors – who provide interpretations through sermons. However, this is just the lead for personal study and reflection.

Collectively, these evangelicals are not unified body theologically. For instance, a quick comparison of the Southern Baptist Convention and the Assemblies of God websites will quickly demonstrate the point. Nor are there strong ecumenical links between the major churches, as found in Britain.

This bible-based view of Christianity comes directly from the Reformation. In medieval Europe the Bible was handwritten and only available in Latin. With most people illiterate, reading of the Bible was limited to a few dedicated scholars, with interpretation highly centralised and strictly controlled. Any deviation was treated as heresy, often punishable by death. A combination of the advent of printing and translation into the vernacular suddenly made the word of God accessible to a much wider population. It soon became evident that the established religious orthodoxy was, in many places, unsupported from the sacred text and in some cases fundamentally at odds with that text. It was this need to study that changed public worship so dramatically, with teaching replacing the Mass as the centrepiece.

Politically, access to the Bible democratised understanding and the questioning of authority and centralised power. This gave a scholarly impetus to the development of modern science, and also the Liberal political philosophy of John Locke and the Scottish Enlightenment that in turn heavily influenced the Founding Fathers.

An Alternative Thesis

Evangelicals have as their primary resource the Bible and the interpretation of God’s purpose from within their local congregation. Your average church member will have quite a detailed knowledge of the Bible, being able to quote much of the primary doctrine and some major passages. Generally they also “cherish and defend religious liberty, and deny the right of any secular or religious authority to impose a confession of faith upon a church or body of churches.
(Southern Baptist Convention). The scepticism towards climate change comes from its presentation. It comes across as a core doctrine that is agreed upon by a consensus of leading scientists. But the truth cannot be perceived by the lay person, but only revealed by impenetrable computer models to scientific experts. Any deviation or questioning of core doctrine is treated with contempt and as a heresy. Yet the high scientific standards that these experts are supposed to follow has been found wanting. There are two areas where this is demonstrated most.

First, the poster hockey stick of a decade ago – showing global temperatures were dramatically higher than at an time in the last millennium – was investigated by the Steve McIntyre. He showed the results were as a result of a number of elements including cherry picking data; giving undue weighting to favourable results; excluding some unfavourable data points; failing to apply proper statistical tests. A book charting this episode is found here, and my comparison of an exchange following a savage book review is here.

Second is the Climategate email release, which showed that the core scientists were a fairly small group, that they viewed the science as far from settled, and they adhered to lower standards of scholarship than was the public perception.

The Inferences from the Donner Paper

Donner has either little understanding of mainstream Christianity in the USA, or he deliberately misrepresents what it stands for. In so doing, he not only completely misses the point of why religious Americans are sceptical but does so in such a way that will make them more antagonistic. The fact that peer review should allow through a paper that clearly does not have proper argument to support the thesis shows a failure to of that process. That a person with no qualifications or prior publishing record in the field of sociology or theology should be allowed to publish on the subject in a journal specialising in the weather shows how far climate science is straying beyond its area of competency. For Christians who unsure of the global warming arguments, clear evidence that a climate scientist not knowing what they are talking about will make them more sceptical. They will be more likely to accept the sceptical comments that the science is flawed, whether the theory, the computer models or the statistics.

The Summer Riots – causes and prevention

Whilst I was away on holiday in Pembrokeshire, riots broke out in the cities of London, Birmingham and Manchester. The following comment was just posted to John Redwood’s blog:-

We should look at this in context. All the riots except the first in Tottenham were copycat riots. People saw that with sufficient numbers of people, looting could be carried out without fear of arrest. There was also the adrenalin rush of rioting, just like football hooliganism. The rioting stopped when people started being arrested in large numbers. They also stopped in Manchester when it started raining.

We should not overreact in issuing draconian laws. Rather it is to understand that people react to the opportunities presented to them. We had in the inner cities for a few nights to opportunity to riot and loot in the belief there would be no punishment. Many took that opportunity. This can be gleaned from the work of Prof. Gary S. Becker, who pioneered the study of the economics of crime.

Prevention of the riots in the near future might simply be to show that many of those who rioted had been caught. Therefore the belief that criminal acts in a riot would go unpunished is a false one. Beyond this, there might some minor changes. First, by more rapidly escalating the intensity of Police action in an area and nationally. Second, by instituting temporary powers of arrest in, or near, riot areas for those covering their faces. Third, if riots are in the summer, for helicopters to spray water to simulate a heavy downpour. The water might also contain a harmless dye visible under ultraviolet light (that can be removed with soap and water) to identify those who duck into side streets.

The ideas are minor. They will not quell a serious political riot – but the more serious riots of the 1980s in Brixton & Toxteth were also stopped by the rain. These are superficial “shopping riots“*. They are only a reflection of a breakdown in society insofar as there are large sections of society who lack the moral sense to respect property and other people even when there appears to be no possibility of being caught for breaking the law. The rule of law needs to be respected by vast majority of people for the vast majority of the time for civil society to exist. Otherwise, the peace can be maintained only by draconian laws and thuggish law enforcement. In such authoritarian societies the civil peace is maintained only by fear of arbitrary arrest and restraint of peaceful activities.

*This is not an endorsement of David Starkey’s other comments on the subject.

A note on HADCRUT3 v GISSTEMP

Have just posted to WUWT the following on global temperature anomalies:-

Thanks Luboš for a well-thought out article, and nicely summarised by

“The “error of the measurement” of the warming trend is 3 times larger than the result!”

One of the implications of this wide variability, and the concentration of temperature measurements in a small proportion of the land mass (with very little from the oceans covering 70% of the globe) is that one must be very careful in the interpretation of the data. Even if the surface stations were totally representative and uniformly accurate (no UHI) and the raw data properly adjusted (Remember Darwin, Australia on this blog?), there are still normative judgements to be made to achieve a figure.

I have done some (much cruder) analysis comparing HADCRUT3 to GISSTEMP for the period 1880 to 2010, which helps illustrate these judgemental decisions.

1. The temperature series agree on the large fluctuations, with the exception of the post 1945 cooling – it happens 2 or 3 years later and more slowly in GISSTEMP.

2. One would expect greater agreement with recent data in more recent years. But since 1997 the difference in temperature anomalies has widened by nearly 0.3 celsius – GISSTEMP showing rapid warming and HADCRUT showing none.

3. If you take the absolute change in anomaly from month to month and average from 1880 to 2010, GISSTEMP is nearly double that of HADCRUT3 – 0.15 degrees v 0.08. The divergence in volatility reduced from 1880 to the middle of last century, when GISSTEMP was around 40% more volatile than HADCRUT3. But since then the relative volatility has increased. The figures for the last five years are respectively about 0.12 and 0.05 degrees. That is GISSTEMP is around 120% more volatile that HADCRUT3.

This all indicates that there must be greater clarity in the figures. We need the temperature indices to be compiled by qualified independent statisticians, not by those who major in another subject. This is particularly true of the major measure of global warming, where there is more than a modicum of partisan elements.

These graphs help illustrate the points made. Please note that I use overlapping moving averages, so it is for illustrative purposes only.

NB. Luboš Motl’s article was cross-posted from his blog here

Tamino on Australian Sea-Levels

Tamino attempts a hatchet-job on a peer-reviewed paper on Australian Sea Levels. Whilst making some valid comments, it gives the misleading impression that he has overturned the main conclusion.

The sceptic blogs (GWPF, Wattsupwiththat, Jo Nova) are highlighting a front page article in the Australian about a peer-reviewed paper by P.J. Watson about Australian sea levels trends over the past century.

The major conclusion is that:-

“The analysis reveals a consistent trend of weak deceleration at each of these gauge sites throughout Australasia over the period from 1940 to 2000. Short period trends of acceleration in mean sea level after 1990 are evident at each site, although these are not abnormal or higher than other short-term rates measured throughout the historical record.”

The significance is that Watson shows a twentieth century rise of 17cm +/-5cm in Australia, whilst Government policy is based a sea level rise of up to 90cm by the end of the century. If there is deceleration from an already low base, then government action is no longer required, potentially saving billions of dollars.

Looking for other viewpoints I found a direction from Real Climate to Tamino’s Open Mind blog. Given my last encounter when he tried to defend the deeply flawed Hockey Stick (see my comments here and here) I curious to know if this was another misdirection. I was not disappointed. Tamino manages to produce a graph showing the opposite to Watson. That is rapid acceleration, not gentle deceleration.

How does he end up with this contrary result? In Summary

  1. Chooses just one of the four data sets used. That is the Freemantle data set.
  2. Making valid, but largely irrelevant criticisms, to undermine the scientific and statistical competency of the author.
  3. Takes time to make the point about treating 20 year moving averages as data for analysis purposes. The problem is that it underweights the data points at the beginning and the end. In particular, any recent acceleration will be understated.
  4. Criticizes the modelling method, with good reasons.
  5. Slips in an alternative model that may answer that criticism.
  6. Shows the results of that model output.

Tamino’s choice of the Freemantle data set should be justified, especially as Watson gives the comment in the conclusion.

“There is evidence of significant mine subsidence embedded in the historical tide gauge record for Newcastle and a likelihood of inferred subsidence within the later (after the mid 1990s) portion of the Fremantle record. In this respect, it is timely and necessary to augment these relative tide gauge measurements with CGPS to gain accurate data on the vertical movement (if any) at each gauge site to measure eustatic sea level rise. At present only the Auckland gauge is fitted with such precision levelling technology.”

That is, the Freemantle data shows the largest acceleration towards the end and this extra acceleration might be because land levels are falling, not sea levels rising.

The underweighting of recent data is important and could be dealt with by looking at shorter period moving averages and observing the acceleration rates. That is looking at moving averages for 19, 18, 17 years etc. If the acceleration rates cross the 20cm a century rate with the shortening of the time periods then this will undermine Watson’s conclusion. Tamino does not do this, despite being well within his capabilities. Until such an analysis is carried out, the claim abstract in the abstract that “(s)hort period trends of acceleration in mean sea level after 1990 … are not abnormal or higher than other short-term rates measured throughout the historical record ” is not undermined.

Instead of pursuing the point, Tamino then goes on to substitute Watson’s modelling method for an arbitrary one plucked from the air, with the comment

“Finally, we come to the other very big problem with this analysis: the model itself. Watson models his data as a quadratic function of time:

.

He then uses  
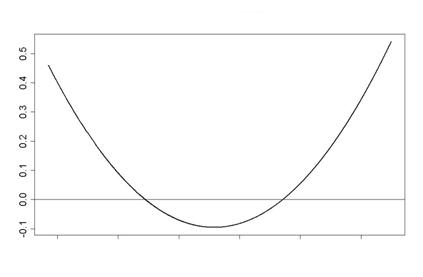
(the 2nd time derivative of the model) as the estimated acceleration. But this model assumes that the acceleration is constant throughout the observed time span. That’s clearly not so. ”

Instead he flippantly inserts a quartic equation, which gives the time-varying acceleration (the second derivation) as a quadratic function against time.

There are some problems with a quadratic functions as a model against time. Primarily it only has one turning point. Extend the graph far enough and it reaches infinity. So at some point in the future sea levels will reach the sun, and later the rate of rise will be faster than the speed of light. More seriously, if this quadratic is the closest fit to all the data series, it will either have, or soon will have, overstated the actual acceleration. If used to project 90 years or more ahead, it will provide a grossly exaggerated projection based on known data.

On this basis I have edited to give all the inferences that can be drawn from rising sea levels in Australasia.

That is, a pure maths exercise in plotting a quadratic equation on a graph, unrelated to any reality.

An alternative to this is to claim simply that there is not sufficient valid data, or the analysis is too poor draw any long-term inferences.

An alternative approach is to relate the sea level rises to the global temperature rises. Try comparing Watson’s graph of rate of change in sea levels to the two major temperature anomalies.


First it should be pointed out that Watson uses a twenty year moving average, so his data should lag the temperature data. The strong warming in the HADCRUT data in the 1920s to 1940s is replicated in Fort Denison and Auckland sea level data. The Lack of warming in the 1945 to 1975 period is replicated be marked deceleration in all four data sets from 1950 to the 1970s. The warming phase thereafter is similarly replicated in all four data sets. The current static phase, according to the more reliable HADCRUT data, should similarly be marked by a deceleration in sea level rise from an already low level. Further analysis of Watson’s data is needed to confirm this.

There is no reason in the existing data to believe that Watson’s conclusions are invalid. It is necessary to play fast and loose with the data and get lost in computer games models to draw alternative inferences. Yet if a member of the Australian Parliament says legislation to cope with sea level rise should be withdrawn due to a new study, the alarmist consensus, (who have just skimmed through Tamino’s debunking), will say that the study has been overturned. As a result, ordinary, coastal-dwelling people in Australia will continue to endure real hardship due to legislation based on alarmist exaggerations. (here & here).