The EU Referendum – The end of the Labour Party or the United Kingdom?

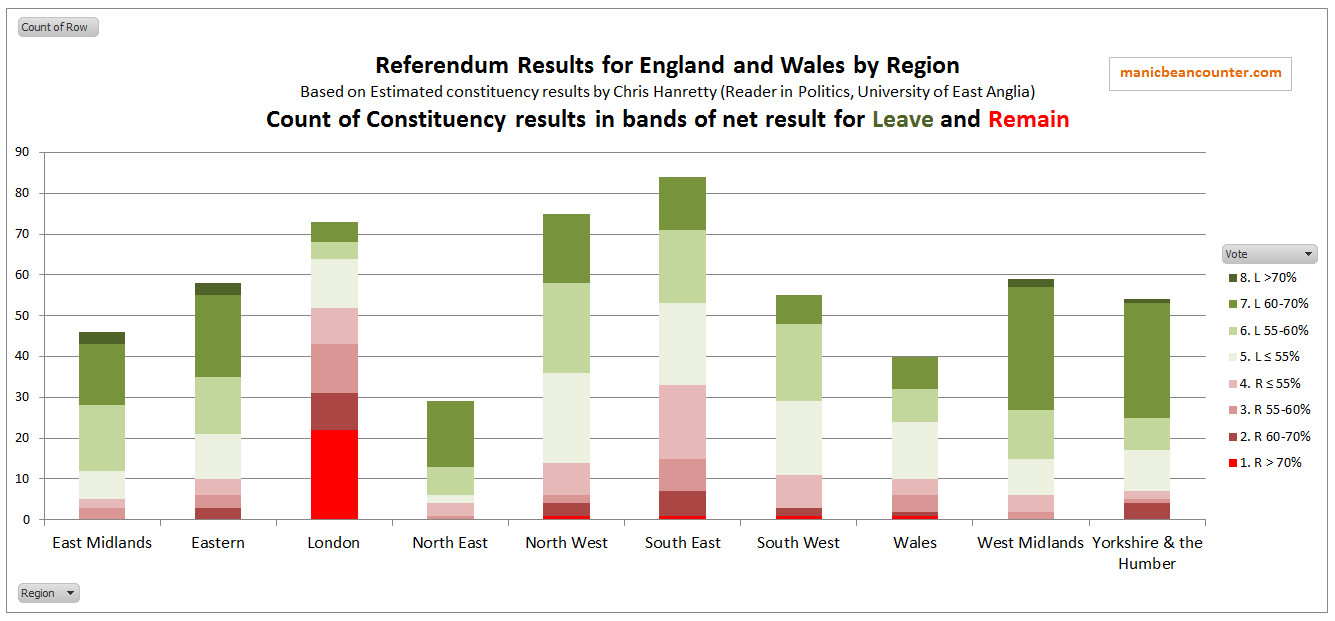
In the previous post I used Chris Hanretty’s estimated the referendum vote split for the 574 parliamentary constituencies in England and Wales to look at the pattern of voting. In particular I found that a disproportionate number of the constituencies with strong votes either for remaining in the EU or leaving the EU have a Labour Party MP.

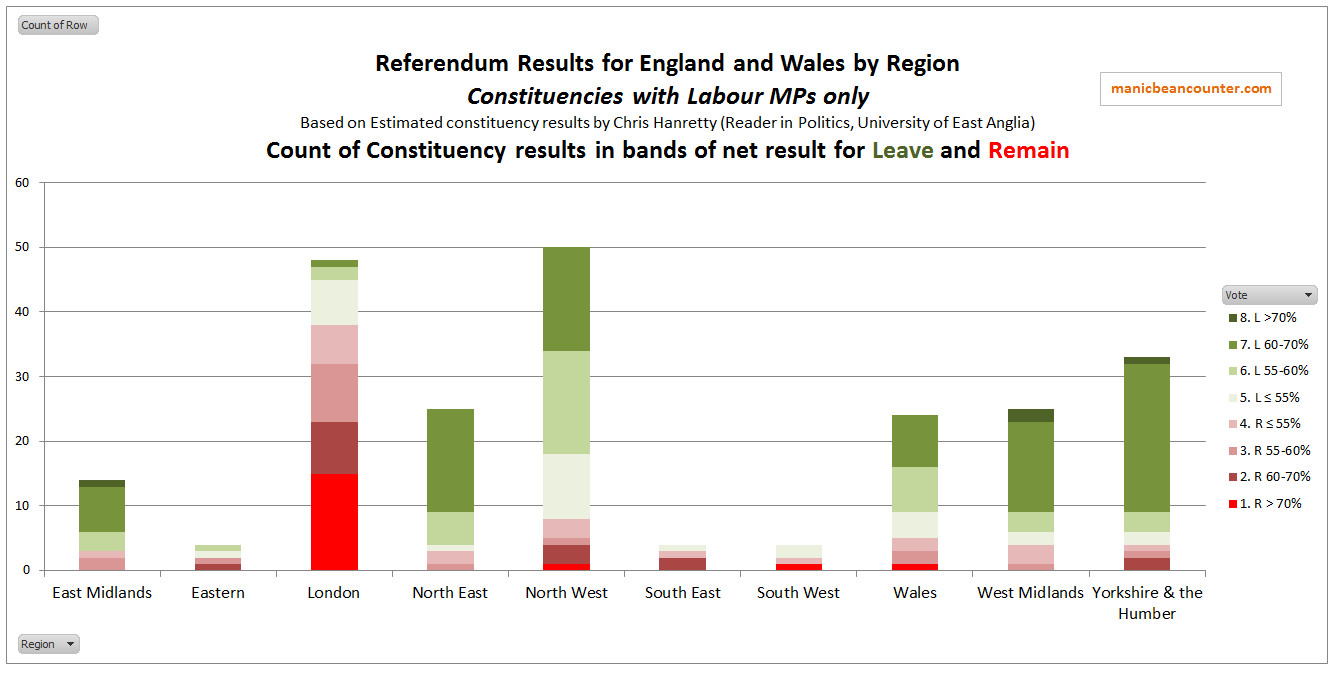
The graphic below shows the split by region for constituencies with Labour MPs. The strongest Remain votes are concentrated in London, whilst the majority of constituencies voted for Leave.

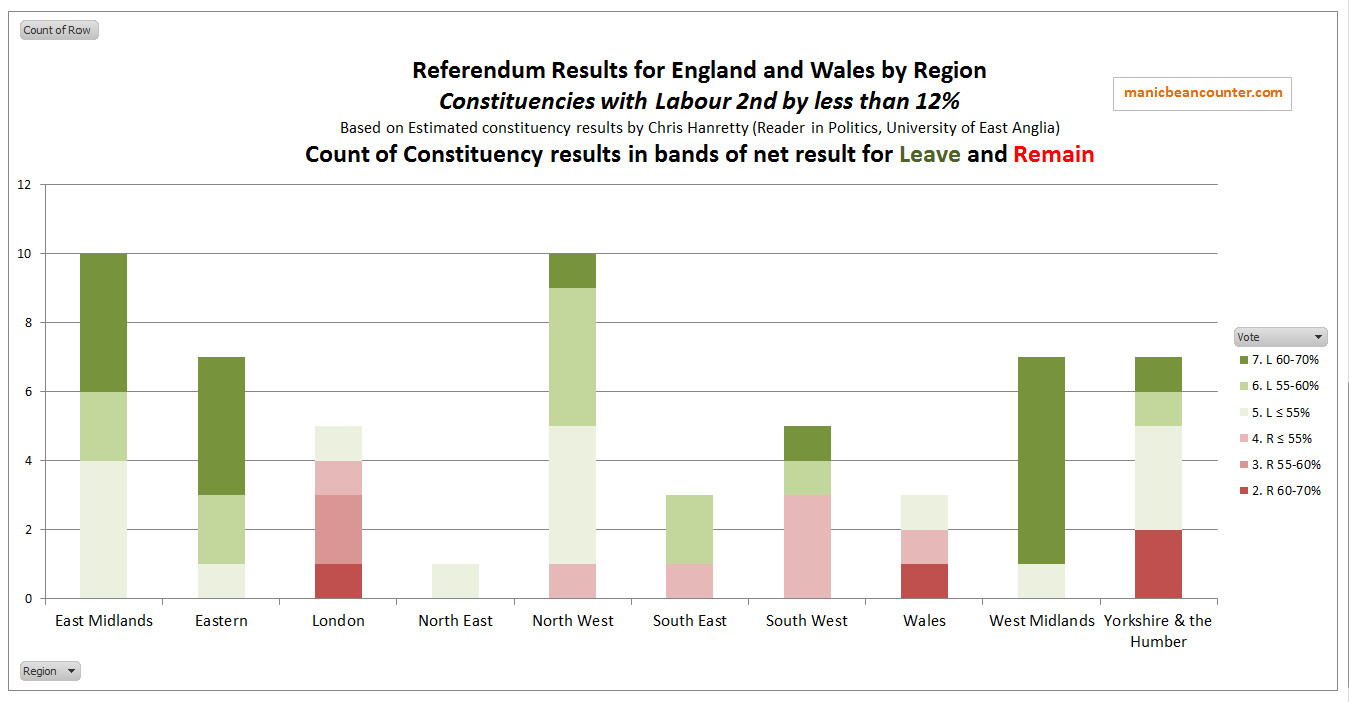
This is not the full picture. Most of the Labour Party MPs still have a desire to become the party of Government. At a minimum, they would have to win enough seats to become the largest party to have a chance of power. Of the 573 parliamentary seats in England and Wales Labour came second in 212. Of these, 58 had majorities of less than 12% of the popular vote. This would mean winning 56 from the Conservatives and 2 from the Liberal Democrats.

The problem for Labour is that these target constituencies exhibit similar patterns to the existing Labour constituencies. That is, there was support for Remain in London, and support for Leave in much of the rest of the country.  The differences between existing and target Labour seats are slight. The proportion of seats that voted Leave is slightly higher (78% against 69%), whilst the constituencies that voted at least 60% Leave is lower (29% against 39%) when compared to existing Labour constituencies.

Adding these target seats to the existing seats makes very little difference to the split between London and the rest of England and Wales, except for downgrading the relative importance of London in relation to the Midlands and the North West of England.

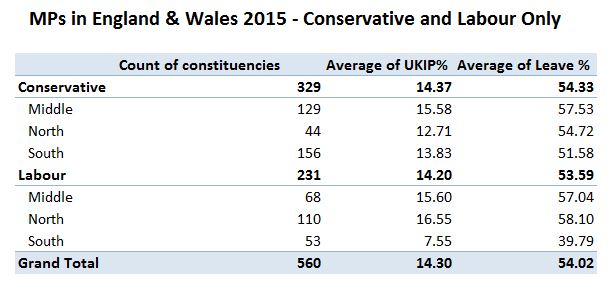
The elephant in the room is Scotland, where Labour lost 40 seats to the SNP. It is likely that every single one of these voted to Remain in the EU. This compares to just 8 Labour losses in England and Wales, everyone to the Conservatives and 7 calculated by Chris Hanretty to have voted for Leave. To make themselves electable in Scotland and maintain support in London where up to 40% of the membership live, Labour must support some policy of opposing Brexit. But this would scupper their chances of winning more seats most of England and Wales, and might help maintain support for UKIP. This is particularly true in the North and Midlands where UKIP are strongest. This is illustrated in the table below.

This gives the biggest issue of them all. If Labour manage to revive from their present turmoil and become the largest party at the next election, then the price of power might be the breakup of the United Kingdom. But this is unlikely to happen if in 2020 Brexit remains the over-riding political issue. If Brexit ceases to be an issue, Jeremy Corbyn, in hanging onto power might be doing the country a service by ensuring the breakup of the Labour Party into two unelectable factions.

Kevin Marshall


The Democratic Deficit in the Referendum Result

During the EU Referendum campaign all the main political parties backed the Remain campaign. The opinion polls predicted a final 52/48 split for the Remain vote. The final vote was 52/48 win for leaving the EU, sending shock waves around the world. This seems quite a narrow win. However, Chris Hanretty, a Reader in Politics at the University of East Anglia, has estimated the referendum vote split for the 574 parliamentary constituencies in England and Wales. The actual vote also covered the 76 constituencies in Scotland and Northern Island, along with Gibraltar. This was not a simple task, as the vote was counted by local Government areas, which rarely coincide with the constituencies. He estimated that 421 of these 574 constituencies likely voted for Leave.
However, there was no geographical split of the figures. I therefore classified the constituencies by region, along with putting the estimated vote into bands, with shades of green for a majority to Leave the EU and shades of pink/red for a majority to Remain in the EU.

There is a huge divergence between the regions. London was the only region to vote Remain in England and Wales, with 71% of constituencies in favour. The next nearest pro-EU region was the South East, with 39% of constituencies in favour. Furthermore London accounted for 22 of the 26 constituencies with greater than 70% of the vote in favour of Remain. What is quite worrying for future political consensus is that in 39% of constituencies the vote was at least 60% for a position for the majority vote.

The split by political party is also revealing. Of the 574 constituencies, 330 have Conservative MPs, 231 have Labour MPs and the remaining 12 seats are split between four other parties.
The Conservative constituency split is as follows.

The Conservative support is mostly in the South of England and the Midlands. The divergence is slightly less extreme than for the total, with 94 of the 330 constituencies having at least 60% for the majority vote.
The Labour Party constituency split is as follows.

The Labour Party support is mostly in the North of England, the West Midlands, London and Wales. The divergence in vote is more extreme than for the total, with 123 of the 231 constituencies having at least 60% Leave vote for the majority vote. Over half of the constituencies with a greater than 60% Remain vote in England and Wales (34 of 54) are Labour. Also over half of the constituencies with a greater than 60% Leave vote in England and Wales (89 of 168) are Labour. Yet Labour have just 40% of the Parliamentary seats. What is worse for the Party, the divergence is regional. The Remain constituencies are concentrated in London. All the other core regions have a strong Leave vote. Even worse, the Party activists are strongly Remain supporters and are behind efforts to annul the Referendum result.

In summary the results show two things.
First is that there is a huge divergence in Referendum vote across the English and Welsh constituencies.
Second is that a disproportionate number of the constituencies with strong votes either for remaining in the EU or leaving the EU have a Labour Party MP.

Kevin Marshall

Guardian Images of Global Warming Part 2 – A Starved Dead Polar Bear

In the Part 2 of my look at Ashley Cooper’s photographs of global warming published in The Guardian on June 3rd I concentrate on the single image of a dead, emaciated, polar bear.
The caption reads

A male polar bear that starved to death as a consequence of climate change. Polar bears need sea ice to hunt their main prey, seals. Western fjords of Svalbard which normally freeze in winter, remained ice free all season during the winter of 2012/13, one of the worst on record for sea ice around the island archipelago. This bear headed hundreds of miles north, looking for suitable sea ice to hunt on before it finally collapsed and died.

The US National Snow and Ice Data Center (NSIDC) has monthly maps of sea ice extent. The Western Fjords were indeed ice free during the winter of 2012/13, even in March 2013 when the sea ice reaches a maximum. In March 2012 Western Fjords were also ice free, along with most of the North Coast was as well.  The maps are also available for March of 2011, 2010, 2009 and 2008. It is the earliest available year that seems to have the minimum extent. Screen shots of Svarlbard are shown below.

As the sea ice extent has been diminishing for years, maybe this had impacted on the polar bear population? This is not the case. A survey published late last year, showed that polar bear numbers has increased by 42% between 2004 and 2015 for Svarlbard and neighbouring archipelagos of Franz Josef Land and Novaya Zemlya.

Even more relevantly, studies have shown that the biggest threat to polar bear is not low sea ice levels but unusually thick spring sea ice. This affects the seal population, the main polar bear food source, at the time of year when the polar bears are rebuilding fat after the long winter.
Even if diminishing sea ice is a major cause of some starvation then it may have been a greater cause in the past. There was no satellite data prior to the late 1970s when the sea ice levels started diminishing. The best proxies are the average temperatures. Last year I looked at the two major temperature data sets for Svarlbard, both located on the West Coast where the dead polar bear was found. It would appear that there was a more dramatic rise in temperatures in Svarlbard in the period 1910-1925 than in period since the late 1970s. But in the earlier warming period polar bear numbers were likely decreasing, continuing into later cooling period. Recovery in numbers corresponds to the warming period. These changes have nothing to do with average temperatures or sea ice levels. It is because until recent decades polar bears were being hunted, a practice that has largely stopped.

The starvation of this pictured polar bear may have a more mundane cause. Polar bears are at the top of the food chain, relying on killing fast-moving seals for food. As a polar bear gets older it slows down, due to arthritis and muscles not working as well. As speed and agility are key factors in catching food, along with a bit of luck, starvation might be the most common cause of death in polar bears.

Kevin Marshall