What would constitute AGW being a major problem?

Ron Clutz has an excellent post. This time on he reports on A Critical Framework for Climate Change. In the post Ron looks at the Karoly/Tamblyn–Happer Dialogue on Global Warming at Best Schools particularly at Happer’s major statement. In my opinion these dialogues are extremely useful, as (to use an old-fashioned British term) are antagonists are forces by skilled opponents to look at the issues in terms of a level playing field. With the back and forth of the dialogue, the relative strengths and weaknesses are exposed. This enables those on the outside to compare and contrast for themselves. Further, as such dialogues never fully resolve anything completely, can point to new paths to develop understanding. 

Ron reprints two flow charts. Whilst the idea is of showing the issues in this way to highlight the issues is extremely useful correct. I have issues with the detail. 


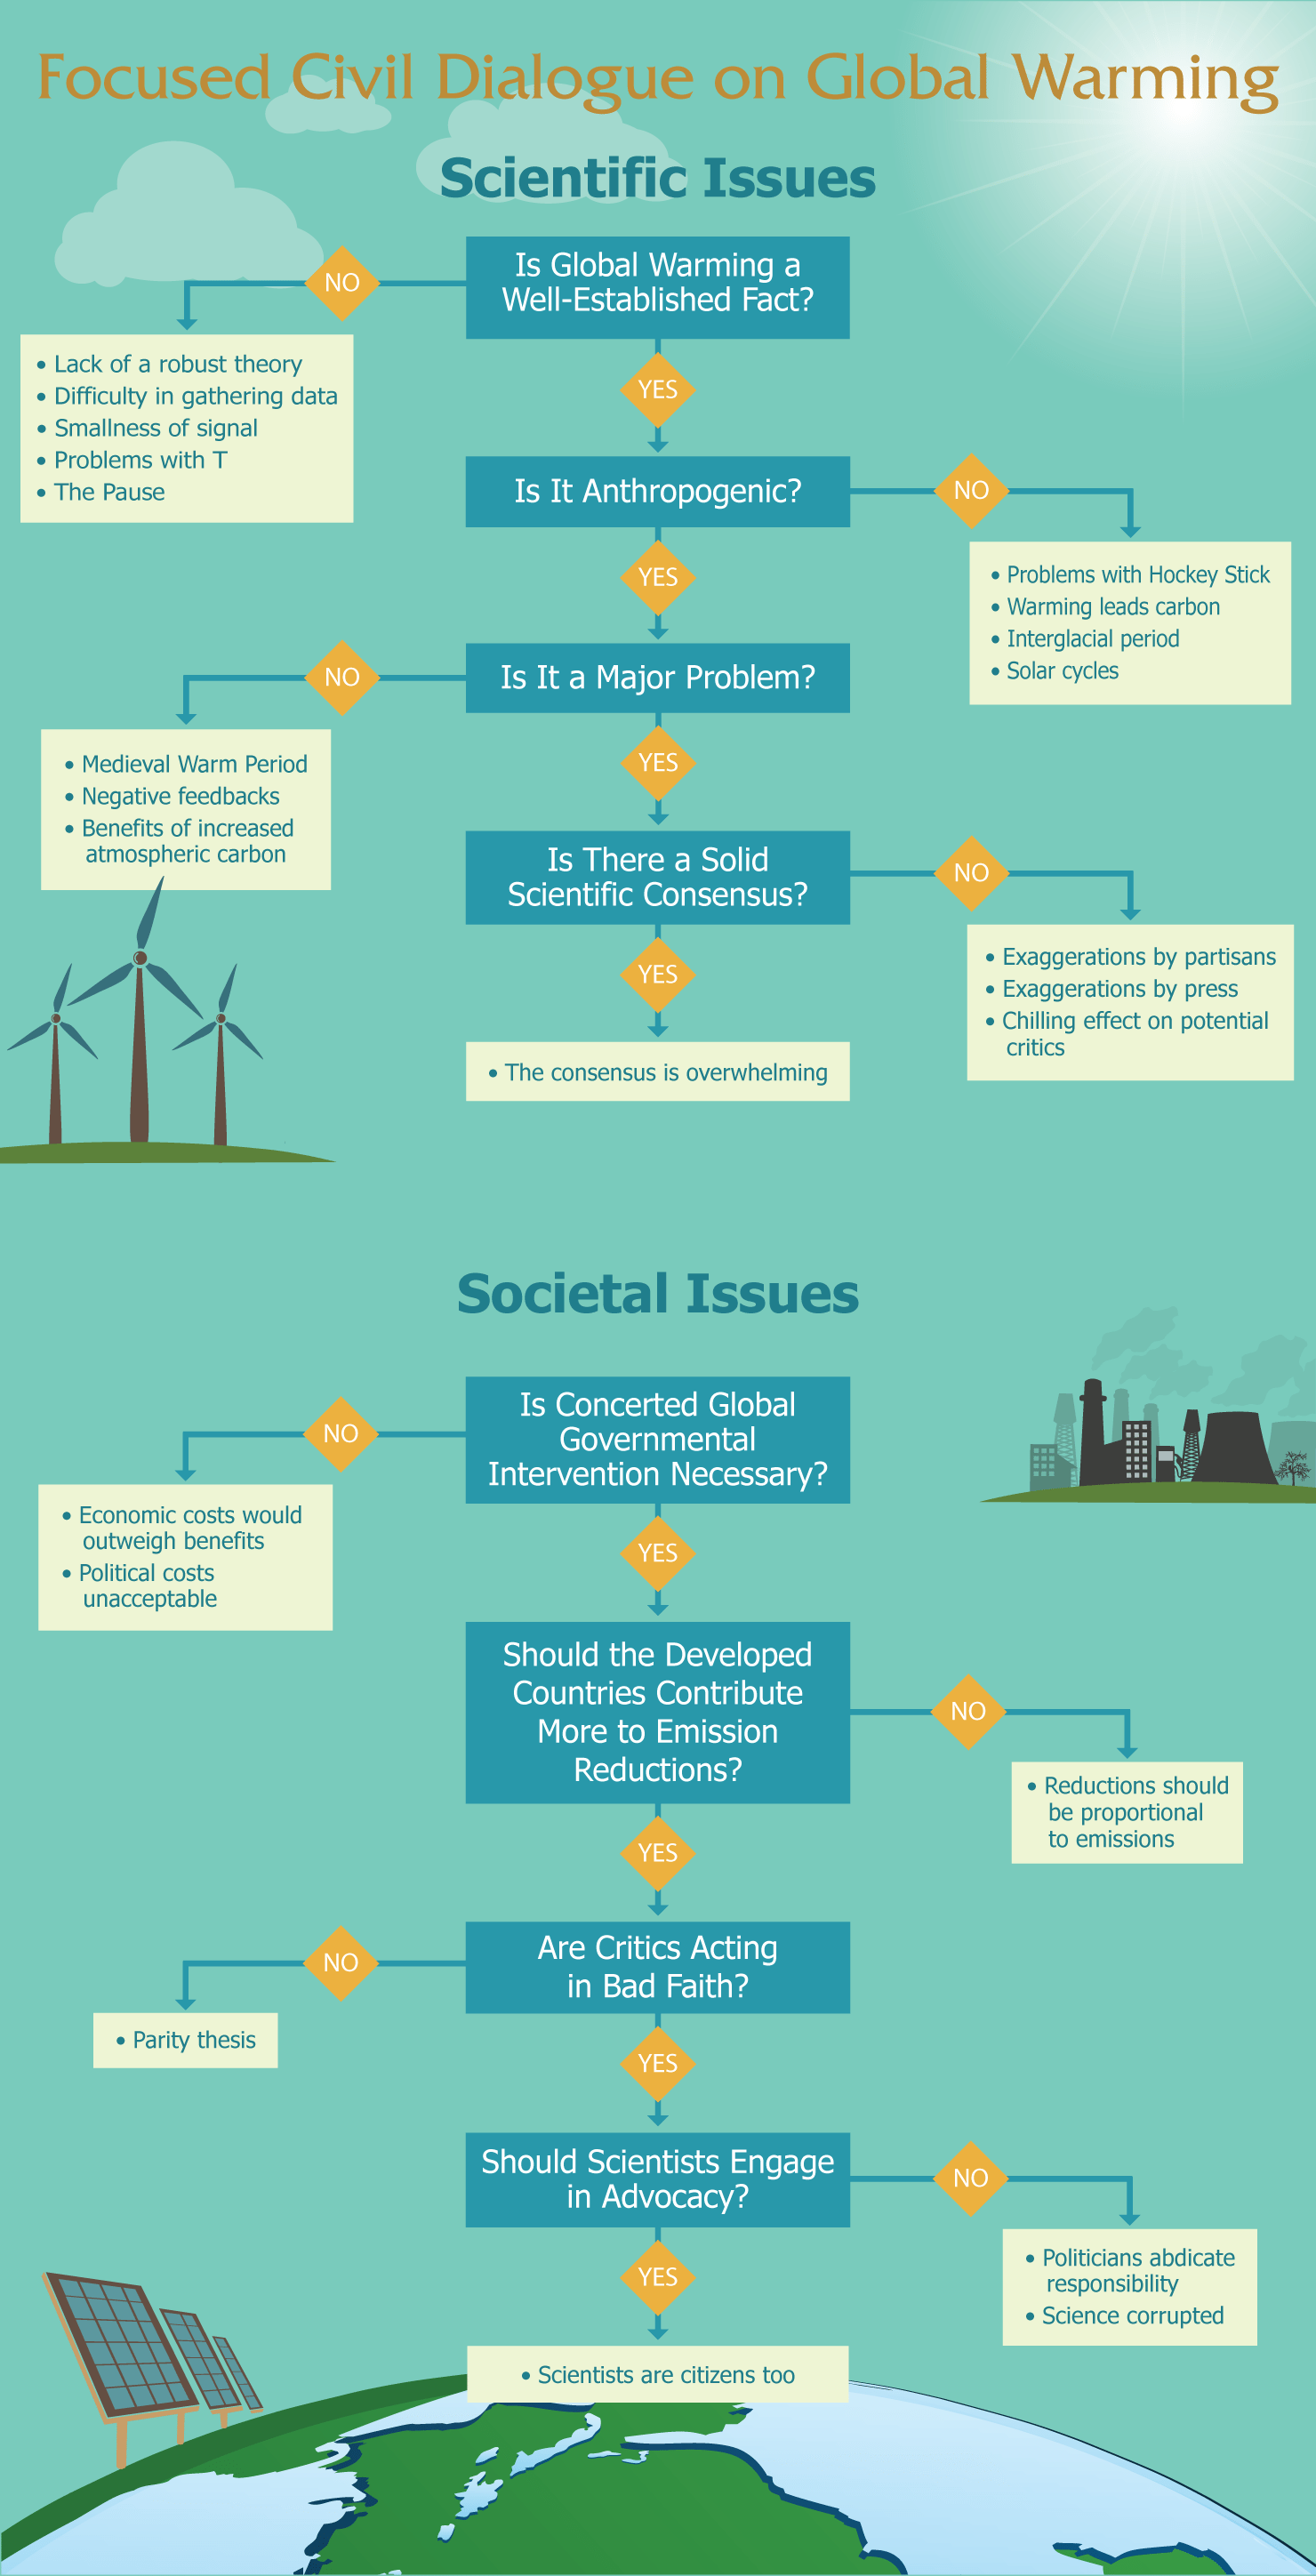
In particular on the scientific question “Is it a major problem?“, I do not think the “No” answers are correct.
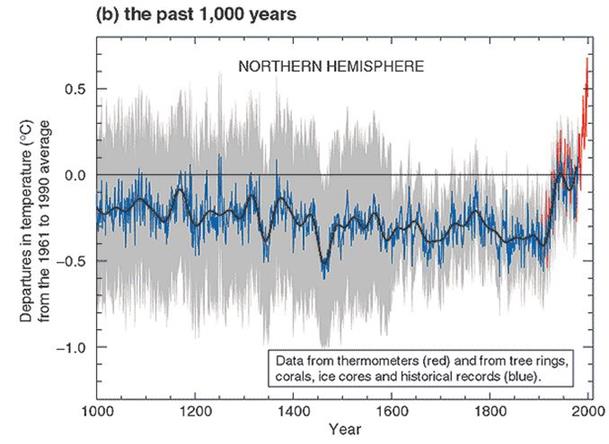
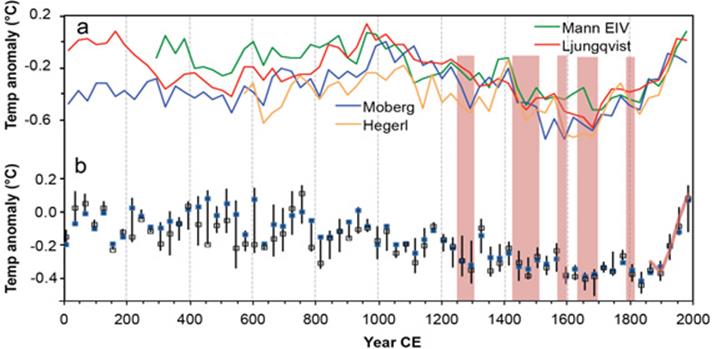
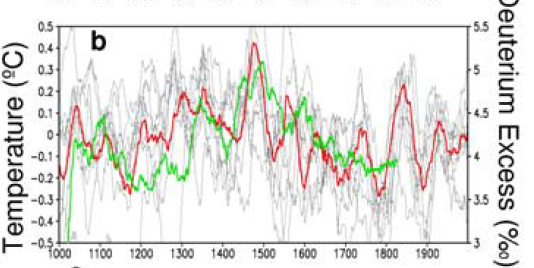
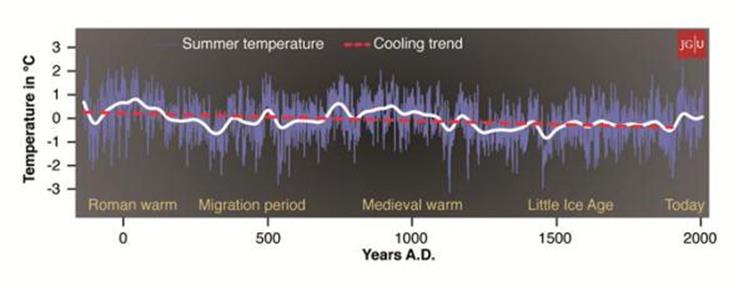
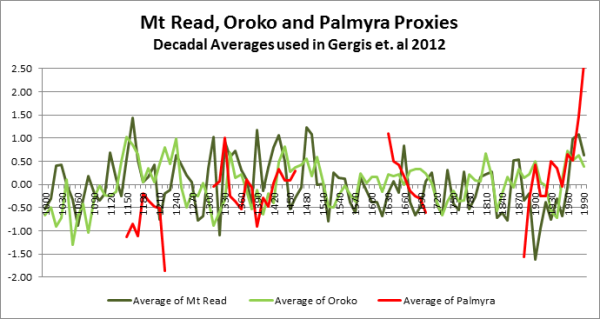
If there was no MWP, Roman warming, or Bronze Age warming then this would be circumstantial evidence for current warming being human-caused. If there has been 3 past warming phases at about  1000, 2000 and 3000 years ago, then this is strong circumstantial evidence that current warming is at least in part due to some unknown natural or random factors. Without any past warming phases at all then it would point to the distinctive uniqueness of the current warming, but that still does not mean not necessarily mean that it is a major net problem. There could be benefits as well as adverse consequences to warming. But the existence of previous warming phases under many studies and only being able to claim by flawed statistics that the majority of warming since 1950 in human-caused (when there was some net warming for at least 100 years before that suggests a demonstrable marginal impact of human causes far less than 100% of total warming. Further there is issues with

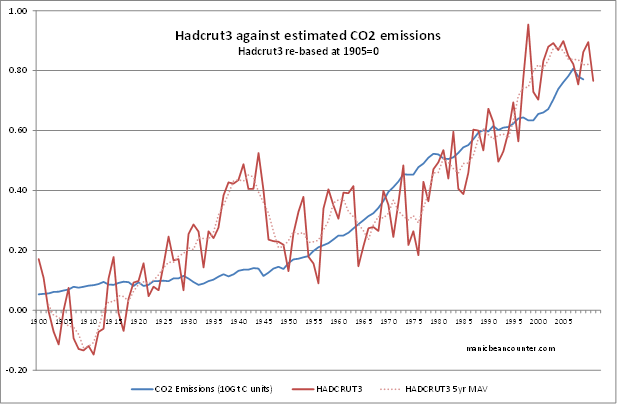
(a) the quantity of emissions a trace gas to raise that the atmospheric levels by a unit amount

(b) the amount of warming from a doubling of the trace gas – climate sensitivity

(c) the time taken for rises on a trace gas to raise temperatures.

As these are all extremely difficult to measure, so a huge range of equally valid answers. It is an example of the underdetermination of scientific theory.

At the heart of the underdetermination of scientific theory by evidence is the simple idea that the evidence available to us at a given time may be insufficient to determine what beliefs we should hold in response to it.

But even if significant human-caused warming can be established, this does not constitute a major problem. Take sea-level rise. If it could be established that human-caused warming was leading to sea level rise, this may not, on a human scale, be a major problem. At current rates sea levels from the satellites are rising on average by 3.5mm per year. The average adjusted level from the tide gauges are less than that – and the individual tide gauges show little or no acceleration in the last century. But if that rate accelerated to three or four times that level, it is not catastrophic in terms of human planning timescales. 

The real costs to humans are expressed in values. The really large costs of climate change are based not so much on the physical side, but implausible assumptions about the lack of human responses to ongoing changes to the environment. In economics, the neoclassical assumptions of utility maximisation and profit maximisation are replaced by the dumb actor assumption.

An extreme example I found last year. In Britain it was projected that unmitigated global warming could lead to 7000 excess heatwave deaths in the 2050s compared to today. The projection was most of these deaths would occur in over 75s dying in hospitals and care homes. The assumption was that medical professionals and care workers would carry on treating those in the care in the same way as currently, oblivious to increasing suffering and death rates.  

Another extreme example from last year was an article in Nature Plants (a biology journal) Decreases in global beer supply due to extreme drought and heatThere were at least two examples of the dumb actor assumption. First was failure by farmers to adjust output according to changing yields and hence profits. For instance in Southern Canada (Calgary / Edmonton) barley yields under the most extreme warming scenario were projected to fall by around 10-20% by the end of the century. But in parts of Montana and North Dakota – just a few hundred miles south – they would almost double. It was assumed that farmers would continue producing at the same rates regardless, with Canadian farmers making losses and those in Northern USA making massive windfall profits. The second was in retail. For instance the price of a 500ml bottle of beer in Ireland was projected to increase under the most extreme scenario in Ireland by $4.84 compared to $1.90 in neighbouring Britain. Given that most of the beer sold comes from the same breweries; current retail prices in UK and Ireland are comparable (In Ireland higher taxes mean prices up to 15% higher); cost of a 500ml bottle is about $2.00-$2.50 in the UK; and lack of significant trade barriers, there is plenty of scope with even a $1.00 differential for an entrepreneur to purchase a lorry load of beer in the UK and ship it over the Irish Sea. 

On the other hand nearly of the short-term forecasts of an emerging major problem have turned out to be false, or highly extreme. Examples are

  • Himalayan Glaciers will disappear by 2035
  • Up to 50% reductions in crop yields in some African Countries by 2020
  • Arctic essentially ice-free in the summer of 2013
  • Children in the UK not knowing what snow is a few years after 2000
  • In the UK after 2009, global warming will result in milder and wetter summers

Another example of the distinction between a mere difference and a major problem is the February weather. Last week the UK experienced some record high daytime maximum temperatures of 15-20C. It was not a problem. In fact, accompanied by very little wind and clear skies it was extremely pleasant for most people. Typical weather for the month is light rain, clouds and occasional gales. Children on half-term holidays were able to play outside, and when back in school last week many lessons were diverted to the outdoors. Over in Los Angeles, average highs were 61F (16C) compared to  February average of 68F (20C). This has created issues for the elderly staying warm, but created better skiing conditions in the mountains. More different than a major problem. 

So in summary, for AGW to be a major problem it is far from sufficient to establish that most of the global warming is human caused. It is necessary to establish that the impact of that warming is net harmful on a global scale.

Kevin Marshall


Shotton Open Cast Coal Mine Protest as an example of Environmental Totalitarianism

Yesterday, in the Greens and the Fascists, Bishop Hill commented on Jonah Goldberg’s book Liberal Fascists. In summing up, BH stated:-

Goldberg is keen to point out that the liberal and progressive left of today do not share the violent tendencies of their fascist forebears: theirs is a gentler totalitarianism (again in the original sense of the word). The same case can be made for the greens. At least for now; it is hard to avoid observing that their rhetoric is becoming steadily more violent and the calls for unmistakably fascist policy measures are ever more common.

The link is to an article in the Ecologist (reprinted from Open Democracy blog) – “Coal protesters must be Matt Ridley’s guilty consience

The coal profits that fill Matt Ridley’s bank account come wet with the blood of those killed and displaced by the climate disaster his mines contribute to, writes T. If hgis consicence is no longer functioning, then others must step into that role to confront him with the evil that he is doing. (Spelling as in the original)

The protest consisted of blocking the road for eight hours to Shotton open cast coal mine. The reasoning was

This was an effective piece of direct action against a mine that is a major contributor to climate disaster, and a powerful statement against the climate-denying Times columnist, Viscount Matt Ridley, that owns the site. In his honour, we carried out the action as ‘Matt Ridley’s Conscience’.

The mine produces about one million tonnes of coal a year out of 8,000 million tonnes globally. The blocking may have reduced annual output by 0.3%. This will be made up from the mine, or from other sources. Coal is not the only source of greenhouse gas emissions, so the coal resulting in less than 0.004% of global greenhouse gas emissions. Further, the alleged impact of GHG emissions on the climate is cumulative. The recoverable coal at Shotton is estimated at 6 million tonnes or 0.0007% of the estimated global reserves of 861 billion tonnes (Page 5). These global reserves could increase as new deposits are found, as has happened in the recent past for coal, gas and oil. So far from being “a major contributor to climate disaster”, Shotton Open Cast Coal Mine is a drop in the ocean.

But is there a climate disaster of which Matt Ridley is in denial? Anonymous author and convicted criminal T does not offer any evidence of current climate disasters. He is not talking about modelled projections, but currently available evidence. So where are all the dead bodies, or the displaced persons? Where are the increased deaths through drought-caused famines? Where are the increased deaths from malaria or other diseases from warmer and worsening conditions? Where is the evidence of increased deaths from extreme weather, such as hurricanes? Where are the refugees from drought-stricken areas, or from low-lying areas now submerged beneath the waves?

The inability to evaluate the evidence is shown by the comment.

Ridley was ( … again) offered a platform on BBC Radio 4 just a week before our hearing, despite his views being roundly debunked by climate scientists.

The link leads to a script of the Radio 4 interview with annotated comments. I am not sure that all the collective brains do debunk (that is expose the falseness or hollowness of (an idea or belief)) Matt Ridley’s comments. Mostly it is based on nit-picking or pointing out the contradictions with their own views and values. There are two extreme examples among 75 comments I would like to highlight two.

First is that Matt Ridley mentioned the Hockey Stick graphs and the work of Steve McIntyre in exposing the underlying poor data. The lack of a medieval warm period would provide circumstantial (or indirect) evidence that the warming of the last 200 years is unprecedented. Gavin Schmidt, responded with comments (5) and (6) shown below.

Schmidt is fully aware that Steve McIntyre also examined the Wahl and Amman paper and thoroughly discredited it. In 2008 Andrew Montford wrote a long paper of the shenanigans that went into the publication of the paper, and its lack of statistical significance. Following from this Montford wrote the Hockey Stick Illusion in 2010, which was reviewed by Tamino of RealClimate. Steve McIntyre was able to refute the core arguments in Tamino’s polemic by reposting Tamino and the Magic Flute, which was written in 2008 and covered all the substantial arguments that Tamino made. Montford’s book further shows a number of instances where peer review in academic climatology journals is not a quality control mechanism, but more a device of discrimination between those that support the current research paradigm and those that would undermine that consensus.

Comment 6 concludes

The best updates since then – which include both methodology improvements and expanded data sources – do not show anything dramatically different to the basic picture shown in MBH.

The link is to Chapter 5 on the IPCC AR5 WG1 assessment report. The paleoclimate discussion is a small subsection, a distinct reversal from the prominent place given to the original hockey stick in the third assessment report of 2001. I would contend the picture is dramatically different. Compare the original hockey stick of the past 1,000 years with Figure 5.7 on page 409 of AR5 WG1 Chapter 5.

In 2001, the MBH reconstruction was clear. From 1900 to 2000 average temperatures in the Northern Hemisphere have risen by over 1C, far more than the change in any of century. But from at least two of the reconstructions – Ma08eivl and Lj10cps – there have been similarly sized fluctuations in other periods. The evidence now seems to back up Matt Ridley’s position of some human influence on temperatures, but does not support the contention of unprecedented temperature change. Gavin Schmidt’s opinions are not those of an expert witness, but of a blinkered activist.

Schmidt’s comments on hockey stick graphs are nothing compared to comment 35

The Carbon Brief (not the climate scientists) rejects evidence that contradicts their views based on nothing more than ideological prejudice. A search for Indur Goklany will find his own website, where he has copies of his papers. Under the “Climate Change” tab is not only the 2009 paper, but a 2011 update – Wealth and Safety: The Amazing Decline in Deaths from Extreme Weather in an Era of Global Warming, 1900–2010. Of interest are two tables.

Table 2 is a reproduction of World Health Organisation data from 2002. It clearly shows that global warming is well down the list of causes of deaths. Goklany states in the article why these figures are based on dubious assumptions. Anonymous T falsely believes that global warming is curr

Figure 6 for the period 1990-2010 shows

  • the Global Death and Death Rates per million Due to Extreme Weather Events
  • CO2 Emissions
  • Global average GDP Per Capita

Figure 6 provides strong empirical evidence that increasing CO2 emissions (about 70-80% of total GHG emissions) have not caused increased deaths. They are a consequence of increasing GDP per capita, which as Goklany argues, have resulted in fewer deaths from extreme weather. More importantly, increasing GDP has resulted in increased life expectancy and reductions in malnutrition and deaths that be averted by access to rudimentary health care. Anonymous T would not know this even if he had read all the comments, yet it completely undermines the beliefs that caused him to single out Matt Ridley.

The worst part of Anonymous T’s article

Anonymous T concludes the article as follows (Bold mine)

The legal process efficiently served its function of bureaucratising our struggle, making us attempt to justify our actions in terms of the state’s narrow, violent logic. The ethics of our action are so clear, and declaring myself guilty felt like folding to that.

We found ourselves depressed and demoralised, swamped in legal paperwork. Pleading guilty frees us from the stress of a court case, allowing us to focus on more effective arenas of struggle.

I faced this case from a position of relative privilege – with the sort of appearance, education and lawyers that the courts favour. Even then I found it crushing. Today my thoughts are with those who experience the racism, classism and ableism of the state and its laws in a way that I did not.

That reflection makes me even more convinced of the rightness of our actions. Climate violence strikes along imperialist lines, with those least responsible, those already most disadvantaged by colonial capitalism, feeling the worst impacts.

Those are the people that lead our struggle, but are often also the most vulnerable to repression in the struggle. When fighting alongside those who find themselves at many more intersections of the law’s oppression than I do, I have a responsibility to volunteer first when we need to face up to the police and the state.

Faced with structural injustice and laws that defend it, Matt Ridley’s Conscience had no choice but to disobey. Matt Ridley has no conscience and neither does the state nor its system of laws. Join in. Be the Conscience you want to see in the world.

The writer rejects the rule of law, and is determined to carry out more acts of defiance against it. He intends to commit more acts of violence, with “climate” as a cover for revolutionary Marxism. Further the writer is trying to incite others to follow his lead. He claims to know Matt Ridley’s Conscience better than Ridley himself, but in the next sentence claims that “Matt Ridley has no conscience“. Further this statement would seem to contradict a justification for the criminal acts allegedly made in Bedlington Magistrates Court on December 16th
that the protesters were frustrated by the lack of UK Government action to combat climate change.

It is not clear who is the author of this article, but he/she is one of the following:-

Roger Geffen, 49, of Southwark Bridge Road, London.

Ellen Gibson, 21, of Elm Grove, London;

Philip MacDonald, 28, of Blackstock Road, Finsbury Park, London;

Beth Louise Parkin, 29, of Dodgson House, Bidborough Street, London;

Pekka Piirainen, 23, of Elm Grove, London;

Thomas Youngman, 22, of Hermitage Road, London.

Laurence Watson, 27, of Blackstock Road, Finsbury Park, London;

Guy Shrubsole, 30, of Bavent Road, London;

Lewis McNeill, 34, of no fixed address.

Kevin Marshall

Michael Mann’s bias on Hockey Sticks

Two major gripes of mine with the “Climate Consensus” are their making unsubstantiated claims from authority, and a total failure to acknowledge when one of their own makes stupid, alarmist comments that contradict the peer-reviewed consensus.

An example is from Professor Michael Mann commenting on his specialist subject of temperature reconstructions of the past for a Skeptical science “97% Consensus” spin-off campaign.


I will break this statement down.

“There are now dozens of hockey sticks and they all come to the same basic conclusion”

His view is that warming is unprecedented, shown by dozens of hockey sticks that replicate his famous graph in the UNIPCC Third Assessment Report of 2001.

Rather than look at the broader picture warming being unprecedented on any time scale1, I will concentrate on this one thousand year period. If a global reconstruction shows a hockey stick, then (without strong reasoned arguments to the contrary) one would expect the vast majority of temperature reconstructions from actual sites by various methods to also show hockey sticks

CO2Science.com, in their Medieval Warm Period Project, have catalogued loads of these reconstructions from all over the world. They split them into two categories – quantitative and qualitative differentials in the average temperature estimates between the peak of the medieval warm period and now.

It would seem to me that Mann is contradicted by the evidence of dozens of studies, but corroborated by only a few. Mann’s statement of dozens of hockey sticks reaching the same basic conclusion ignores the considerable evidence to the contrary.

“The recent warming does appear to be unprecedented as far back as we can go”

Maybe, as Mann and his fellow “scientists” like to claim, that the people behind this website are in “denial” of the science. Maybe they have just cherry-picked a few studies from a much greater number of reconstructions. So let us look at the evidence the SkS team provide. After all, it is they who are running the show. Under their article on the medieval warm period, there is the following graph of more recent climate reconstructions.


It would seem the “Mann EIV” reconstruction in green does not show a hockey stick, but flat (or gently rising) temperatures from 500-1000 AD; falling temperatures to around 1800; then an uptick starting decades before the major rise in CO2 levels post 1945. The twentieth century rise in temperatures appears to be about half the 0.7oC recorded by the thermometers, leading one to suspect that reconstructions understate past fluctuations in temperature as well. The later Ljungqvist reconstructions shows a more pronounced medieval warm period and a much earlier start of the current warming phase, in around 1700. This is in agreement with the Moberg and Hegerl reconstructions. Further the Moberg reconstruction has a small decline in temperatures post 1950.

Even worse, the graphic was from the Pages2K site. On temperature reconstructions of the last two millennia Pages2K state:-

Despite significant progress over the last few decades, we still do not sufficiently understand the precise sequence of changes related to regional climate forcings, internal variability, system feedbacks, and the responses of surface climate, land-cover, and bio- and hydro-sphere.

Furthermore, at the decadal-to-centennial timescale we do not understand how sensitive the climate is to changes in solar activity, frequency of volcanic eruptions, greenhouse gas and aerosol concentration, and land cover.

So Michael Mann’s statement if warming being unprecedented is contradicted by peer-reviewed science. Skeptical Science published this statement when it was falsified by Mann’s own published research and that of others.

“But even if we didn’t have that evidence, we would still know that humans are warming the planet, changing the climate and that represent a threat if we don’t do something about it”

There is no corroborating evidence to the climate models from temperature reconstructions. In fact, empirical data shows that the models may be claiming as human-caused temperature increases that are naturally-caused, but for reasons not fully understood. So the “knowing” must be assumed to be from belief, just as the threat and the ability of the seven billion “us” to counter that threat are beliefs as well.

Kevin Marshall


Notes

  1. The emergence from the Younger Dryas cooling period 11,500 years ago was at least 10 times the warming of the past 100 years, and was maybe in a period of less than 300 years. See WUWT article here, or the emerging story on the causes here.

Was the twentieth century warming mostly due to human emissions?

There has been no statistically significant warming for at least 15 years. Yet some people, like commentator “Michael the Realist”, who is currently trolling Joanne Nova’s blog, are claiming otherwise. His full claims are as follows

Again look at the following graph.

Now let me explain it to the nth degree.
# The long term trend over the whole period is obviously up.
# The long term trend has pauses and dips due to natural variations but the trend is unchanged.
# The current period is at the top of the trend.
# 2001 to 2010 is the hottest decade on the record despite a preponderance of natural cooling trends. (globally, ocean, land and both hemispheres)
# Hotter than the previous decade of 1991 to 2000 with its preponderance of natural warming events.
# Every decade bar one has been hotter than the previous decade since 1901.

Please explain why the above is true if not AGW with proof.

The claims against the warming standstill I will deal with in a later posting. Here I will look at whether the argument proves, beyond reasonable doubt, that AGW exists and is significant.

There might be a temperature series, but there is no data on greenhouse gases. There is data on the outcome, but there is no presentation of data on the alleged cause. It is like a prosecution conducting a murder trial with a dead body, with the cause of death not established, and no evidence presented linking the accused to the death. I will have to fill this bit in. The alleged cause of most of the twentieth century global warming is human greenhouse gas emissions. The primary greenhouse gas emission is CO2. First I will compare estimated global CO2 emissions with the warming trend. Second, I then show evidence that the twentieth century warming is nothing exceptional.

The relationship of CO2 emissions to average temperature is weak

Some time ago I downloaded estimates of national CO2 emissions data from what is now the CDIAC website, then in filled my own estimates for all major countries where there were data gaps, using the patterns of other countries and my knowledge of economic history. This shows steady growth up to 1945 (with dips in WW1, the Great Depression and at the end of WW2) The post war economic boom, the 1973 oil crisis, the recession of 1980-81 and the credit crunch of 2008 are clearly visible. It therefore seems reasonable and not too dissimilar from the increase in atmospheric CO2 levels.


I have charted the growth in human CO2 emissions against the HADCRUT3 data, putting them on a comparative scale. The 5 year moving average temperature increased by around 0.5oC between 1910 and 1944 and 0.6oC between 1977 and 2004. In the former period, estimated CO2 emissions increased from 0.8 to 1.4 giga tonnes. In the latter period, estimated CO2 emissions increased from 4.9 to 7.4 giga tonnes. The period in between the 5 year moving average temperature decreased very slightly and CO2 emissions increased from 1.4 to 4.9 giga tonnes. 1945 and the late 1998 have two things in common – the start of a stall in average surface temperature increases and an acceleration in the CO2 emission rate of increase. On the face of it, in so far as there is a relationship between CO2 emissions and temperature, it seems to be a pretty weak one.

The longer view

The case for claiming human emissions affect temperature is even weaker if you take a longer perspective. Human CO2 emissions were negligable before the industrial revolution, yet there is plenty of evidence that temperatures have shown larger fluctuations in last couple of millennia. Four example are Law Dome, Esper et al 2012, Gergis et al 2012 and the CO2 Science website.

This Law Dome ice cores are the highest quality ice cores in Antarctica.


There seems to be no warming there at all. With 75% of the global ice packs in Antarctica it is fortunate that there is nothing exceptional about Antarctica warming. But maybe the Arctic is different.

Esper et al 2012, published in Nature, has the following Summer temperature reconstruction for Northern Scandinavia over two millennia.


There is a twentieth century uptick, but only in the context of a long term cooling trend.

Focussing on the last 130 years shows something at odds with the global position.


The highest temperatures were in the 1930s, just like the record temperatures in the USA. The warming trend from the mid-1970s is still far greater than the global averages, but less than the warming trends in the early twentieth century. It corroborates data that shows recent warming trends are higher in the Arctic than the global average, but also shows claims that there is nothing significant in these trends.

I find the most convincing evidence is from the withdrawn Gergis 2012 temperature reconstruction for the combined land and oceanic region of Australasia (0°S-50°S, 110°E-180°E). This is because it set out with the aim of showing the opposite – that the recent warming was much more significant than anything in the last millennium. Despite breaking their own selection rules for proxies, they managed to only demonstrate that the last decade of the last millennium the warmest by the narrowest of margins. See below.


There are many reasons to reject the paper (see here), but one significant point can be illustrated. There were only three reconstructions had any data prior to 1430. There were two tree ring studies from New Zealand, and coral study from Palmyra Atoll. Plotting the decadal averages shows that the erratic Palmyra data suppresses the medieval period and exaggerates the late twentieth century warming. Further, Palmyra Atoll is over 2000 km outside the study area.


Finally, CO2Science.org specialises in accumulating evidence of the impacts of CO2. It also has a database of studies on the medieval warm period. There is a graph that summarizes the quantitative studies


Figure Description: The distribution, in 0.5°C increments, of Level 1 Studies that allow one

to identify the degree by which peak Medieval Warm Period temperatures either exceeded

(positive values, red) or fell short of (negative values, blue) peak Current Warm Period

temperatures.

In conclusion, on the face of it, there is very weak support for human emissions being the cause of most of the warming in the last century by the fact that changes in human emissions do not appear to move in line with changes in temperature. The case is further weakened by evidence that at times in the last 2000 years were warmer than in the current period. It does not discount the possibility that human emissions are responsible for some of the warming. But demonstrating that empirically would mean understanding and accurately measuring the full extent of the natural processes, then demonstrating that these were not operating as strongly as in previous epochs. By definition, the evidence will be more circumstantial than if there was a direct correlation. Furthermore, the larger the actual human impact the more circumstantial will be the evidence.

Esper et al 2012 Orbital forcing of tree-ring data – Corroborating the Sceptic Position

A new summer temperature reconstruction using of tree ring densities in Northern Scandinavia stir, raising some difficult questions for those who believe that C20th warming was caused by human activity

There are a couple of elements that corroborate sceptical beliefs that are not alluded to elsewhere.

Pointer to a low influence of CO2

There has been a decline in summer temperatures of 0.6 degrees.


From the abstract

Solar insolation changes, resulting from long-term oscillations of orbital configurations1, are an important driver of Holocene climate23. The forcing is substantial over the past 2,000 years, up to four times as large as the 1.6 W m−2 net anthropogenic forcing since 1750

That is (From the supplementary information figure S13), a decline in temperatures of around 0.6 Celsius is due to a net reduction in orbital forcings of 6 W m−2.

From a 1998 article by Sherwood Idso* on climate sensitivities,

a total greenhouse warming of approximately 33.6°C sustained by a thermal radiative flux of approximately 348 W m–2

That is 6 W m−2 gives approximately 0.6 degrees temperature change. This implies 1.6 W m−2 gives approximately a 0.16 degree temperature change, so CO2 is not the largest influence on C20th warming.

Pointer to the global temperature adjustments being wrong

Yesterday I reblogged pieces of evidence by Steven Goddard indicating that the historical temperature record has been systematically manipulated. In particular, the inter-war warming has been reduced, whilst recent warming has been increased. From the paper, this abstract of the more recent warming trends.

Now compare with two versions of the Reykjavik mean temperatures to see which is closer. I know that Reykjavik is between 50 and 350 miles south of the area surveyed, but it does seem to corroborate one version over the other.

A possible alternative explanation to the lower late C20th temperatures  is in the comments at NoTricksZone. DirkH says

The line actually becomes unreliable from 1912 to the present as it is done with a “100 year spline filter” the paper says. Don’t give to much on the shape of the final wiggle. Can’t find any more information but obviously the window for the filter shrinks near the end, how will it react? Dunno…

Hu McCulloch ain’t too impressed: (2009)

http://climateaudit.org/2009/08/23/spline-smoothing/

*Joanna Nova has a summary here.

Gergis 2012 Mark 2 – Hurdles to overcome

BishopHill reported yesterday on the withdrawn Gergis paper that

The authors are currently reviewing the data and methods. The revised paper will be re-submitted to the Journal of Climate by the end of July and it will be sent out for peer review again.

It is worth listing the long list of criticisms that have been made of the paper. There are a lot of hurdles to overcome before Gergis et al 2012 should qualify for the status of a scientific paper.

My own, quite basic, points are:-

  1. Too few proxies for such a large area. Just 27 for > 5% of the globe.
  2. Even then, 6 are well outside the area.
  3. Of these six, Gergis’s table makes it appear 3 are inside the area. My analysis is below.


  4. Despite huge area, there are significant clusters – with massive differences between proxies at the same or nearby sites.
  5. There are no proxies from the sub-continental land mass of Australia.
  6. Need to remove the Palmyra Proxy because (a) it has errant readings (b) fails the ‘t’ test (c) > 2000km outside of the area, in the Northern Hemisphere.
  7. Without Palmyra the medieval period becomes the warmest of the millennium. But with just two tree ring proxies, one at 42 O South and the other at 43 O S representing an range from 0 to 50O S, this is hardly reliable. See the sum of proxies by year. Palmyra is the coral proxy in the 12th, 14th and 15th centuries.


On top of this are Steve McIntyre’s (with assistance from JeanS and RomanM) more fundamental criticisms:-

  1. The filtering method of Gergis excluded the high quality Law Dome series, but included the lower quality Vostok data, and the Oroko tree ring proxy. McIntyre notes that Jones and Mann 2003 rejected Oroko, but included Law Dome on different criteria.
  2. Gergis screening correlations were incorrectly calculated. JeanS calculated properly. Only 6 out of 27 proxies passed. (NB none of the six proxies outside the area passed)


  3. The Gergis initially screened 62 proxies. Given that the screening included proxies that should not have included 21 proxies, but should it have included some of the 35 excluded proxies. We do not know, as Gergis has refused to reveal these excluded proxies.
  4. Screening creates a bias in the results in favour of the desired result if that correlation is with a short period of the data. RomanM states the issues succinctly here. My, more colloquial take, is that if the proxies (to some extent) randomly show C20th warming or not, then you will accept proxies with a C20th uptick. If proxies show previous fluctuations (to some extent) randomly and (to some extent) independently of the C20th uptick, then those previous fluctuations will be understated. There only has to be a minor amount of randomness to show bias given that a major conclusion was

    The average reconstructed temperature anomaly in Australasia during A.D. 1238-1267, the warmest 30-year pre-instrumental period, is 0.09°C (±0.19°C) below 1961-1990 levels.

UPDATE 03/08/12

The end of July submissions date seems to have slipped to the end of September.

How Gergis Suppressed The Medieval Warm Period

The now withdrawn Gergis paper proudly proclaimed in the abstract

The average reconstructed temperature anomaly in Australasia during A.D. 1238-1267, the warmest 30-year pre-instrumental period, is 0.09°C (±0.19°C) below 1961-1990 levels.

On this basis, Gergis was able to say

A preliminary assessment of the roles of solar, volcanic, and anthropogenic forcings and natural ocean–atmosphere variability is performed using CSIRO Mk3L model simulations and independent palaeoclimate records. Solar and volcanic forcing does not have a marked influence on reconstructed Australasian temperature variations, which appear to be masked by internal variability.

This conclusion is from a single rogue proxy – the coral proxy from Palmyra Atoll.

There were only three temperature proxies covering this medieval peak period. Both Mt. Read in Tasmania and Oroko in New Zealand are tree ring proxies that cover the entire millennium. The Palymyra Atoll coral proxy data covers just 398 years over 4 periods. These are 1151-1221, 1319-1465, 1637-1704 and 1888-1999. Following Gergis, I have calculated the decadal averages. Below is the plot from my pivot table for the three proxies.


I contend that Palmyra is distinctly “odd” due to the following.

  1. Nowhere in the world am I aware of a single instance of massive cooling during the early 13th Century. If not rogue data, the it must be a purely local phenomena.
  2. Nowhere in the world am I aware of a single instance of massive cooling during the 17th Century. Nor was I aware the early 17th century had significant warm period. If not rogue data, it must be a purely local phenomena.
  3. The Hadcrut3 global temperature set has slight cooling at the end of the 19th century / start of the 20th Century, and a warming period from 1910 to 1940 almost as large as the warming period from 1975 to 1998. If not rogue data, it must be a purely local phenomena.
  4. The post 1960 warming trend is phenomenal. In fact it makes the twentieth century warming trend the largest of all the 27 proxies. (See table “Analysis of the Proxies in Gergis et al. 2012” below)

For these three reasons it would appear to be an outlier. So what is the impact?

I looked at the decadal average of the two tree-ring proxies and ranked the hundred decades from 1 for the highest to 100 for the lowest. I then took the decadal average of the three tree-ring proxies and similarly ranked the results.

The change is the decadal ranking was as follows:-


The medieval warm period is suppressed, and the twentieth century is “enhanced”.

Now let us be clear. There were 24 other proxies in the data set. However, none of the others were prior to 1430. Therefore the impact on the overall ranking will not be quite so marked. However, the fact remains that the conclusion that last decade of the 20th century is the warmest of the millennium is based on this one rogue data set.

But there are two more reasons that the Palmyra data set should not have been included in the reconstruction.

Firstly, the Gergis paper was withdrawn upon the publication of the JeanS ‘Gergis Significance’ t-values. Unsurprisingly, Palmyra was one of the proxies that failed the t-test, so is a rogue data set. See table below.

Secondly, is geography. The study is a “temperature reconstruction for the combined land and oceanic region of Australasia (0°S-50°S, 110°E-180°E)“. Palmyra Atoll is located at 5°52′ N, 162°06′ W, or over 2100Km (1300 miles) outside the study area.

Conclusion.

The Palmyra Atoll coral proxy study is clearly an outlier statistically and geographically. In no way can it be considered a suitable proxy for the Australasia region, yet the major, headline, conclusion of the Gergis et al 2012 temperature reconstruction relied upon it.


Mid-Pacific Coral temperature proxies from Gergis et al. 2012

How odd is the Palmyra Atoll Coral Proxy?

In the last post I noted that there was something odd about the Palmyra proxy used in the Gergis paper, particularly in the late 20th century. This is at 5°52′ N, 162°06′ W.

There are four other coral proxies in the Mid-Pacific area. There are two proxy studies from
Rarotonga in the Cook Islands at 21° 14′ 0″ S, 159° 47′ 0″ W and two from the Fiji. For all five proxies I calculated a nine year centred moving average.


Palmyra shows a late 20th century warming trend more than twice that of the other series. Unless there is a locally recorded temperature anomaly on the atoll, then this is clearly wrong. If there is a local temperature spike, then it one should question why it is included in a reconstruction for which it is over 2000km outside the boundary. Either way it should be deleted from the study.

So how reliable are coral proxies. Here we have two pairs. If they are a good proxy for temperature, then they should be a good proxy for each other. On Fiji, they studies be less than 150km apart and on Rarotonga less than 10km apart, meaning they should be near identical. So I have plotted the differences between the moving averages.


It is not a statistically sound method, but indicative of the real issues with the proxy data sets. It also seems that the further back, the greater the consistency. The Palmyra study has four sections, the oldest of which starts in the 12th Century. Although Gergis claims to have done a series of tests for robustness, there is no correlation test over the known temperature record. Given that a central conclusion is:-

The average reconstructed temperature anomaly in Australasia during A.D. 1238-1267, the warmest 30-year pre-instrumental period, is 0.09°C (±0.19°C) below 1961-1990 levels.

Given that there is some question of the selection of the ice core studies at Vostok in preference for the closer and more robust studies at Ice Dome, then central conclusion of the study is not credible on such a small number of proxies.

Palmyra Atoll Coral Proxy in Gergis et al 2012

There is a lot of discussion on Bishop Hill (here and here) and Climate Audit of a new paper in Journal of Climate “Evidence of unusual late 20th century warming from an Australasian temperature reconstruction spanning the last millennium“, with lead author, Dr Joëlle Gergis. The reconstruction was based upon 27 climate proxies, one of which was a coral proxy from Palmyra Atoll.

There are two issues with this study.

Location

The study is a “temperature reconstruction for the combined land and oceanic region of Australasia (0°S-50°S, 110°E-180°E)“. The study lists Palmyra Atoll as being at 6° S, 162° E, so within the study area. Wikipedia has the location at 5°52′ N, 162°06′ W, or over 2100Km (1300 miles) outside the study area. On a similar basis, Rarotunga in the Cook Islands (for which there are two separate coral proxy studies), is listed as being at 21° S, 160° E. Again well within the study area. Wikipedia has the location at 21° 14′ 0″ S, 159° 47′ 0″ W, or about 2000Km (1250 miles) outside the study area. The error has occurred due to a table with columns headed “Lon (°E)”, and “Lat (°S). Along with the two ice core studies from Vostok Station, Antarctica (Over 3100km, 1900 miles south of 50° S) there are 5 of the 27 proxies that are significantly outside the region.

Temperature Reconstruction

Palmyra Atoll reconstruction is one of just three reconstructions that has any data before 1430. From the abstract, a conclusion was

The average reconstructed temperature anomaly in Australasia during A.D. 1238-1267, the warmest 30-year pre-instrumental period, is 0.09°C (±0.19°C) below 1961-1990 levels.

From the proxy matrix I have plotted the data.


This indicates a massive change in late twentieth century temperatures, with 1996 being the most extreme on record.

The other two data sets with pre-1430 data are tree ring proxies from Mount Read, Tasmania and Oroko, New Zealand. These I have plotted with a 30 year moving average, with the data point at the last year.


There is something not right with the Palmyra Atoll proxy. The late 20th century trend is far too extreme. In the next posting I will compare to some other coral data sets.

Heartland Leak – The Implications

The stolen documents from the Heartland Institute have caused a lot of comment on the blogs. There are a number of things that will come out of this.

1. The consensus climate scientists and their cohorts cannot deal with numbers. Just as they have no sense of proportion with financial values (see Jo Nova on this), they likewise have no sense of proportion with sea level rise, temperature rise, or extreme weather events.

2. A better antonym of “sceptical” than “undoubting” or “believer” is “gullible”. Seems DeSmogBlog did not think to check out the authenticity of the damming 2012 strategy document, neither do they accept the Heartland rebuttal. It fitted the narrative, so they published within an hour of receiving the mail. Similarly The Guardian posted a number of one-sided reports (here, here, here), as did Roger Black of the BBC, without waiting to verify the facts. The most alarming 2012 strategy document is a fax (Judith Curry has other references)

3. A number of people, like me, will visit Heartland.org for the first time. They will find they have 7 policy areas employing 20 people, of which “Environment & Energy” employs 3. They specialise in providing cogent summaries of these issues to policy-makers. Whatever you think of their political stance, they are hardly the secretive, rabid backwoodsmen right-wingers that the alarmists project.

4. This support for spreading information in a concise, intelligible form also comes out in the sceptic-funding “exposes”. There is one-off support for Antony Watts who

proposes to create a new Web site devoted to accessing the new temperature data from NOAA’s web site and converting them into easy-to-understand graphs that can be easily found and understood by weathermen and the general interested public.” 

The, alleged, biggest recipient by far of monthly funding is Craig D Idso, who founded the co2science.org website. This provides summaries of climate science papers, collating their results to help give an overall picture of such as the medieval warm period, ocean acidification and the effect of CO2 on plant growth. For instance, I like this graphic summarising the proxy studies of the MWP showing that the Mannian Hockey Stick studies need to at least reconcile their claim that average global temperatures are warmer than in the last 1000 years.

5. It illustrates the upside-down nature of climatology, compared with conventional science. Conventional science is based on making bold statements and predictions that are substantiated by the evidence, with very clear and replicable methods. Over time it refines its techniques, strengthens its methods of analysis and sees its predictions confirmed. It does not need to denigrate, or attempt to silence its detractors. Like the historians of the holocaust, conventional science just points to the evidence and enlightens those who seek the truth. The real deniers of truth in history have been those who silence their opponents and fabricate distortions.

Overall, the leak exposes why the little Heartland Institute is so evil and dangerous to many. They threaten the jobs and reputations of tens of thousands of climate scientists, “policy-makers”, regulators, and powerful business interests in the alternatives to reliable energy. On the other hand, they are on the side of those made hungry by fuel crops competing with food, and of future generations globally, who will be worse-off by growth-sapping mitigation policies.