Yesterday the proposed new boundaries for England and Wales were published by the Boundary Commission. Nationally the total number of constituencies will be reduced from 650 to 600, still leaving Britain with one of the largest number of representatives of any democratic parliament. In England the reduction is from 533 to 501 and in Wales from 40 to 29. The UK Polling Report website reports
The changes in England and Wales result in the Conservatives losing 10 seats, Labour losing 28 seats, the Liberal Democrats losing 4 and the Greens losing Brighton Pavilion (though notional calculations like these risk underestimating the performance of parties with isolated pockets of support like the Greens and Lib Dems, so it may not hit them as hard as these suggest).
The Guardian Reports under the banner Boundary changes are designed to hurt us at next election, says Labour MP
Jon Ashworth, the shadow Cabinet Office minister leading the process for Labour, said the party was convinced the proposals were motivated by party politics.
The Manchester Evening News carries this comment
Jonathan Reynolds, Labour MP for Stalybridge and Hyde, accused the Conservatives of ‘old-fashioned gerrymandering’.
“I will contest these proposals, because I believe they are a naked attempt to increase the electoral prospects of the Conservative Party at the expense of coherent parliamentary representation,” he said.
This are quite a serious claim to make, particularly as the Boundary Commission clearly states
The Boundary Commission for England is the independent and impartial body that is considering where the boundaries of the new constituencies should be. We must report to Parliament in September 2018.
In doing so, we have to ensure that every new constituency has roughly the same number of electors: no fewer than 71,031 and no more than 78,507. While proposing a set of boundaries which are fairer and more equal, the Commission will also try to reflect geographic factors and local ties. The Commission will also look at the boundaries of existing constituencies and local government patterns in redrawing the map of parliamentary constituency boundaries across England.
In undertaking the 2018 Review, we rely heavily on evidence from the public about their local area. Though we have to work within the tight electorate thresholds outlined above, we seek to recommend constituency boundaries that reflect local areas as much as we can. You can find more detailed guidance in our Guide to the 2018 Review.
I thought I would look at the figures myself to see whether the Boundary Commission has done a fair job overall, or has basically lied, providing a deliberately partisan result, that the UK Polling Report has been complicit in supporting.
For previous posts I downloaded the results of the May 2015 General Election by constituency. I then spilt the results into the regions of England and Wales.
Figure 1 shows the average size of constituency by Region and Party. Spk is the Speaker of the House of Commons.
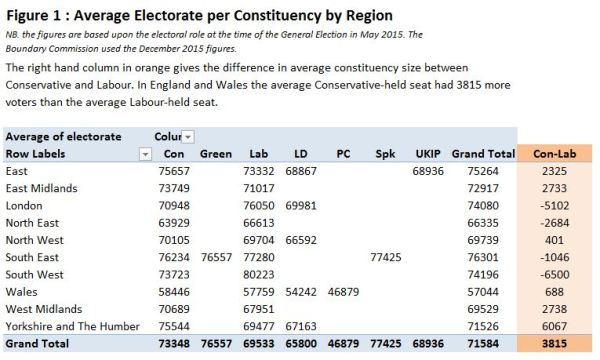
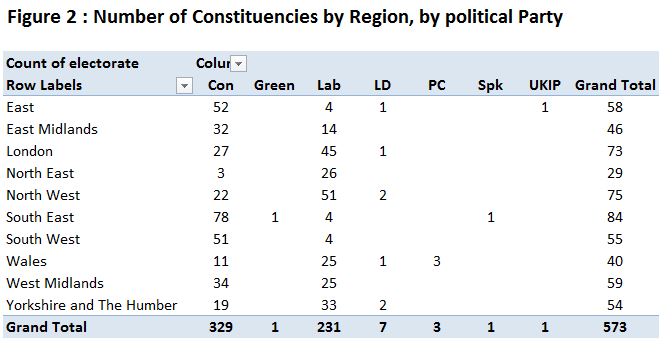
On average the Conservative held constituencies had 3815 more voters in than Labour held ones. But there are large regional differences. Figure 2 shows the number of constituencies by region and political party.
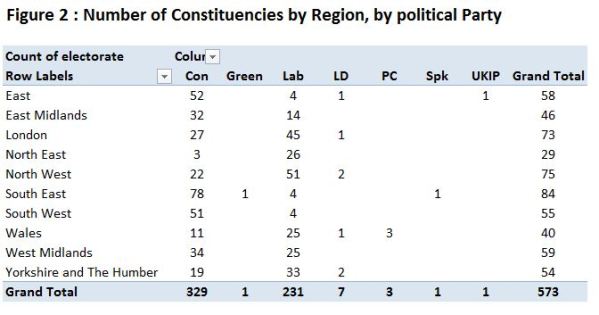
In the South East and South West, where Labour have larger average constituency sizes they have very few seats. In these regions, the regional average seat size is greater than the England and Wales average, so there will be proportionately less seat reductions. The Conservatives, with the vast majority of seats in these regions do not lose from a reduction in the national total and a more equitable distribution. In the East Midlands, West Midlands and Yorkshire and The Humber, Labour are well represented, but have smaller average seat sizes than the Conservatives. In the North West and in Wales Labour are well represented, the average seat sizes in Labour seats are similar to Conservative seats, but the regional average seat sizes are smaller than the England and Wales average. Smaller average seat sizes in these regions will hit Labour harder than the Conservatives due to Labour’s higher representation.
The only exception to the England and Wales picture is London. The region has larger than average constituencies at present, the average constituency size of Labour constituencies is bigger than Conservative constituencies and over 60% of the 73 constituencies are Labour held. But still the region and Labour lose seats, though proportionately less than elsewhere.
The effect of the revisions in shown in the average seat size. In Figure 3 with less seats the average seat size increases, but in some regions by far more than others, resulting in much less regional variation from the proposed boundary changes.
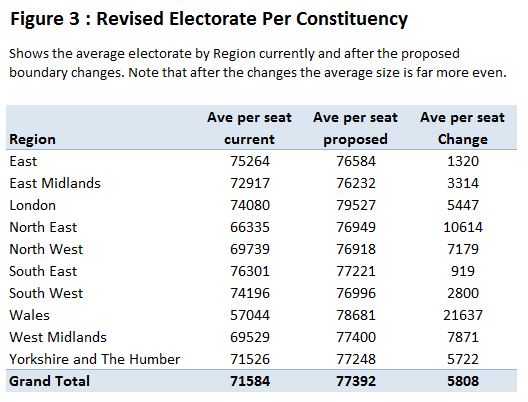
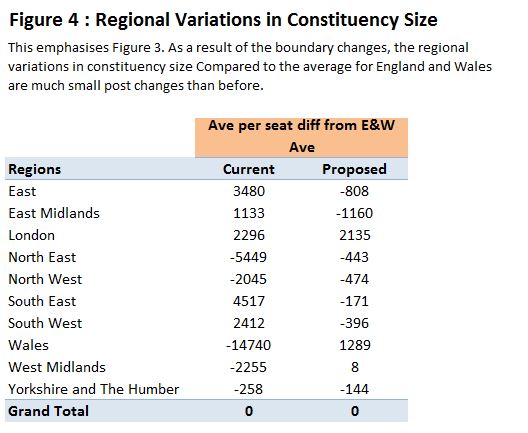
Figure 4 emphasizes the more even distribution of seat size. Currently, the variation of average constituency by region from England and Wales average is between -14740 (Wales) and +4517 (South East). Under the proposals, the variation is between -1160 (East Midlands) and + 2135 (London). https://manicbeancounter.com/wp-content/uploads/2016/09/fig4variationewave.jpg
In London’s case it could be argued for another two constituencies, but this is hardly significant. Also, given that London MPs spend their week far nearer to their constituents than any other region, an extra 2-3% of people to represent is hardly a burden.
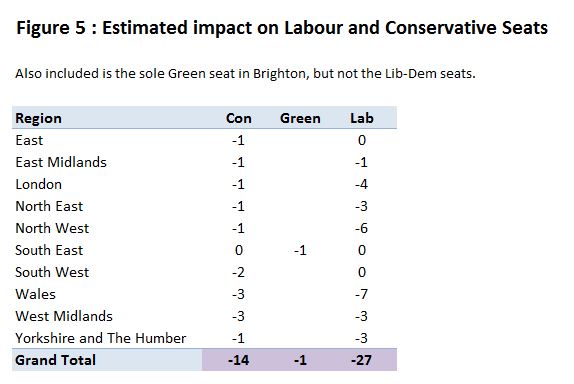
Finally I have done my own estimated impact on Labour, Conservative and Green seats based on changes in regional seat average sizes in Figure 5. If though I do not include the Lib-Dems, the results are very similar to UK Polling Report. The much more even (and therefore fairer) distribution of seats, along with a modest reduction in the total, disadvantages the Labour Party far more than the Conservatives, despite having two-thirds of the seats.

The Labour Party MPs who are doubting the independence of the Boundary Commission should apologize. The evidence is clearly against them.
Kevin Marshall