UNIPCC AGR6 WG1 SPM page 5 makes the following highly misleading claim about sea level rise acceleration.
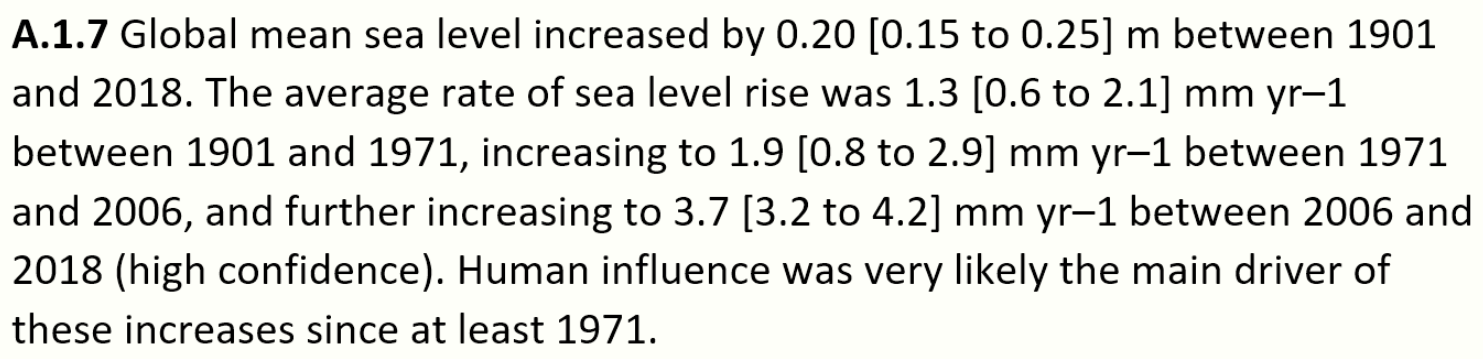
Below is why this statement is highly misleading.
1. In 1993 there was a switch in sea level rise measurements from tide gauges to satellites. The data for the latter is available from University of Colorado Sea Level Research Group. The main graph is below.
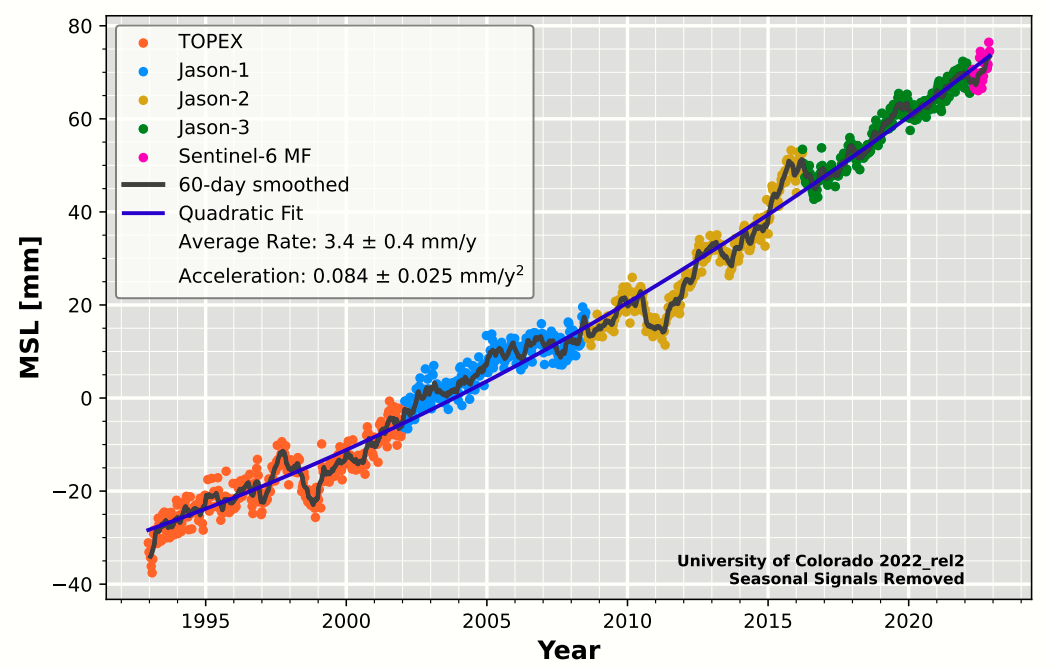
Figure 1 : Sea Level Rise data plot from University of Colorado Sea Level Research Group
2. From the data the average sea levels in 2018 were 43.8mm higher than in 2006. An average rise of 3.65mm yr-1. Rounded this is the IPCC’s 3.7mm yr-1
3. From the satellites from 1993 to 2006 sea levels rose by 37.5mm or 2.9mm yr-1. From the IPCC sea levels rose by 1.9 mm yr-1 from 1971 to 2006 or 66.5mm yr-1. Therefore from 1971 to 1993 from tide gauge data sea levels rose 29mm in 22 years or 1.32mm yr-1.
4. Simply by switching the method of calculating level rise from some averages of tide gauges to satellite observations doubles the rate of sea level rise. That is most apparent sea level rise acceleration is not in actual measurement. But how robust is the satellite data set?
5. The data I downloaded for the satellite tide data set was from Dec 1992 to Jul 2021. Sea levels rose by around 100.31mm in this period or nearly 4 inches. However, there are considerable changes from year to year. In the 28.5 years, the annual average of rate of rise was 3.5mm, but the rise in individual years varied from a fall of 1.65mm in 1998 to a rise 10.54mm in 2012. See Figure 2. The question is whether these changes are real or due to estimates.
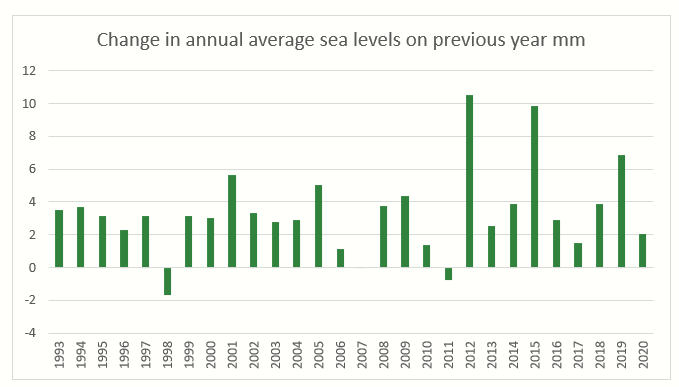
Figure 2 – Change in annual average sea levels on previous year mm from the satellite sea level data set.
6. Actual readings are about 10 days apart, yet have significant differences from one to another both up and down. The average change between readings is 1.8mm or an absolute change of 1821mm or 18 times the net change. Figure 3 compares this with the net changes.
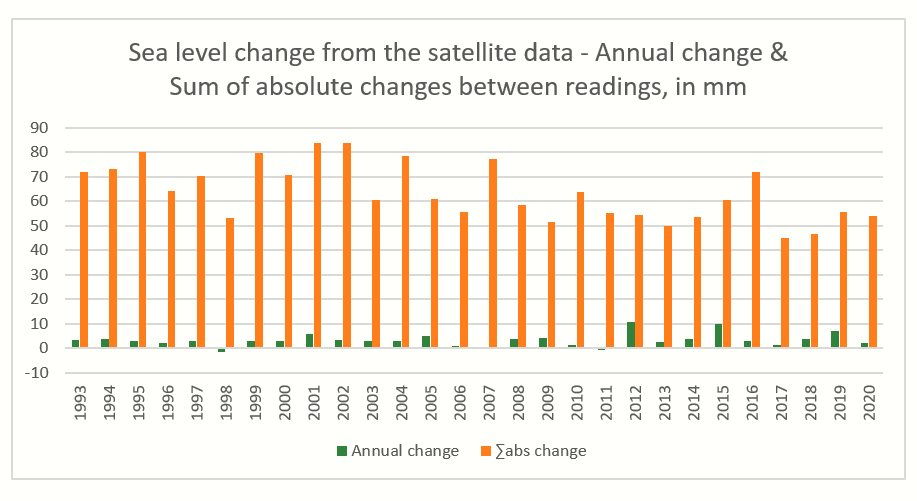
Figure 3 – Annual change & Sum of absolute changes between readings from the satellite data.
7. Given that in the satellite data there is a small apparent acceleration of sea level rise in 28 years when total rise was 100mm or 1/18 of absolute changes in sea level from one reading to another, and given satellites give at least 2x the rate of rise as tide gauges how can anyone claim using that data that sea level rise is accelerating? With individual tide gauges there is at least a control over time as they are in fixed place, but where is the control from the satellite data? Especially given that the sea level varies by many metres across the surface of the earth and that the satellite data gives a completely different set of results to the tide gauges.
8. Regardless of whether the satellite data and the tide gauges give good estimates, the fact that they give significantly results means that splicing together is misleading.
9. The statement about sea level rise is at the summary level. One would expect in the full WG1 report to repeat this claim, then give some sort of justification for the splicing together of two datasets with quite different estimates. The relevant section is Chapter 9.6, starting on numbered page 1287, or pdf sheet 1304 of the full report, or pdf sheet 77 of the Chapter 9 download. I can find no restatement nor justification for the splicing two different data sets together, nor any explicit recognition that the two measures are quite different. The discussion of each set is in separate sections 9.6.1.1 & 9.6.1.2, but nothing to reconcile the two.
10. There is a claim of acceleration in tide gauge average seal levels in the period 1901 to 2010, despite there being no discernible acceleration in the calculated figure for 1901 to 1992 in the SPM statement.1 But what does confining estimates of acceleration in the tide gauges to saying it was 1902–2010 (–0.002 to +0.019 mm yr–2) miss out?
- Even acceleration of +0.01 mm yr-2 is compatible with 1.3 mm yr-1 for both 1901-1971 and & 1971-1993, but not +0.019 mm yr–2.
- Top of the range acceleration of +0.019 mm yr–2 from 1902–2010 still leaves rates of sea level rise for the period 1993-2010 well below that of the satellites for the period 1993-2010.
- Quoting the same acceleration for the whole period 1902-2010 suggests that the data does not show significantly increased rates of sea level rise after 1990. If there was an increase in acceleration in the rate sea level in line with satellite measurements surely a report trying to demonstrate human-caused climate change would highlight this. After all, the rate of rise in CO2 levels accelerated in the late 1950s when Mauna Loa CO2 levels started to be recorded and the current warming phase only started in the late 1970s.
- The range –0.002 to +0.019 mm yr–2 includes zero. That is the data estimated range includes the null hypothesis that there was no acceleration in sea level rise in the period 1902–2010. For normal science this is a grave issue, but for post-normal science (based on a priori beliefs) it is irrelevant.
Concluding comments
The claim of accelerating sea level rise in UNIPCC AGR6 WG1 SPM is mostly based upon splicing together two different data sets. There is no attempt within the detailed report to justify this splicing. Further, the sea level rise acceleration estimate range from the tide gauges does not exclude zero, whilst the upper range does not allow convergence with the satellite data. Most of the implied acceleration in AR6 WG1 SPM Para A.1.7 is grossly misleading propaganda.
Notes
- “The SROCC found that four of the five available tide gauge reconstructions that extend back to at least 1902 showed a robust acceleration (high confidence) of GMSL rise over the 20th century, with estimates for the period 1902–2010 (–0.002 to +0.019 mm yr–2) that were consistent with AR5. New tide gauge reconstructions published since SROCC (Dangendorf et al., 2019; Frederikse et al., 2020b) support this assessment and suggest that increased ocean heat uptake related to changes in Southern Hemisphere winds and increased mass loss from Greenland are the primary physical mechanisms for the acceleration (Section 2.3.3.3). Therefore, the SROCC assessment on the acceleration of GMSL rise over the 20th century is maintained.” (9.6.1.1 page 1287)
