Is there fraud behind the EU Referendum Petition?

In an update to the previous post on the EU Referendum Petition I noted:-

In a few hours 25,000 signatures have been added to one constituency – London and Westminster to 39,338. There are only about 110,000 people in the constituency, including babies and those not entitled to vote. There were only 57,240 (53,928 + 3,312) who voted for Remain on Thursday.

By 10.15 the votes had risen to 43,317, but at 14.30 it had reduced to 14,031.

PetWestm1430


Now the BBC Reports

Second EU referendum petition investigated for fraud

The House of Commons petitions committee is investigating allegations of fraud in connection with a petition calling for a second EU referendum.

Its inquiry is focused on the possibility that some names could be fraudulent – 77,000 signatures have already been removed.

Also

A House of Commons spokeswoman said the petition was created on 24 May. There were 22 signatures on it at the time the referendum result was announced.

Confirming my thoughts in the previous post

BBC political correspondent Iain Watson says the petition has attracted a lot of attention but has no chance of being enacted, because it is asking for retrospective legislation.

Our correspondent says some referendums do have thresholds but those clauses must be inserted in legislation before the vote so everyone is clear about the rules.

You cannot simply invent new hurdles if you are on the losing side, our correspondent says.

The Petitions Committee has removed 77,000, of which at least 29,000 were from the Cities of London and Westminster Constituency. Where the are the other concentrated? At the foot of the petition there is Get petition data (json format). This I downloaded at 10.15 and 17.24 today.

From the twitter feed.

LGMTwitter

At 10.15 there were 40,031 signatories from the Vatican. By 17.24 this had reduced to just 45.

Also on the Twitter feed.

CW&Nyan

At 10.15 there were 24,372 signatories from North Korea. By 17.24 this had reduced to just 26.

From the petition data it is possible to calculate the non-UK signatories by deducting the UK total from the overall total. At 10.15 there were 597,354 non-UK signatories. By 17.24 This had reduced to just 128,384. With the 29,000 deducted from the Cities of London and Westminster Constituency that is over 498,000 petitions deleted.

However, there are still likely to be a very large number of fraudulent responses that have, as yet, gone unnoticed.

Kevin Marshall

EU Referendum Petition tries to overthrow a democratic decision

Rather than accept that they lost, there are efforts to stop the result of the EU Referendum being implemented by some Remain supporters. An example is in a petition to Parliament from EU supporters that which would nullify the EU Referendum decision and re-run it on rigged criteria.
Some background. In Britain it is possible to start online petitions and get others to electronically sign them. If there are more than 100,000 signatures the issue will be discussed in Parliament. (More than 500,000 who signed a petition to “Block Donald J Trump from UK entry” earlier this year.) The latest, started a month before the referendum, states

EU Referendum Rules triggering a 2nd EU Referendum and w
We the undersigned call upon HM Government to implement a rule that if the remain or leave vote is less than 60% based a turnout less than 75% there should be another referendum.

Anybody who reads it should realize that the petition became redundant once voting started. People were voting on the basis of winner being the position that won the most votes. With an either/or decision it means the winner has greater than 50% of the valid votes cast. In the event, the Leave EU vote was 51.9% of the total, or 1269501 votes more than the Remain vote. Turnout was 72.2%, higher than in any General Election since 1992.
What would have happened if the rules had been accepted for the Referendum? Quite clearly, in a country where voting is not compulsory, a little apathy would have nullified the result. The Leave vote would probably have been a higher proportion, as a protest vote would have likely made no difference to the outcome, but would have embarrassed the Government. Given the criteria, no decision would be taken so there would be regular repeat Referenda. The alienation from the democratic process that many feel would doubtless grow, maybe leading to a rebirth of fascist politics.
What is worse is the implication from the location of two million or more who have signed the petition after the referendum result has been announced. The deep red areas where the petitioners are concentrated are in London, Bristol, Brighton, Oxford and Cambridge (Petition map extract around 00.30 26/06/15).

These are the very centres of the left intelligentsia that voted for so solidly for Remain last Thursday. Unable to accept the majority view, including many who they view as their ignorant inferiors, they are effectively attempting to deny democracy. But to retrospectively rig the rules to nullify a democratic result is what one would expect in a 1970s Banana Republic, not something to be considered in the Mother of all Parliaments. Hopefully the House of Commons will unite to treat this petition with the contempt it deserves. To do otherwise would be to usurp the democratic decision of the people they represent in favour of the undemocratic rule by a failing undemocratic institution that the majority have decided to cease being a part of.

Update 9.40am – Is the petition website being scammed?

The screenshot above was taken at around 00.30, when there were about 2.6 million signatures. By 09.00 the number was 2.91 million. By the composition has changed. In a few hours 25,000 signatures have been added to one constituency – London and Westminster to 39,338. There are only about 110,000 people in the constituency, including babies and those not entitled to vote. There were only 57,240 (53,928 + 3,312) who voted for Remain on Thursday. Seems a bit of a daft way to send a message to the Westminster Parliament, as it indicates the petition is not the will of the people, but a few vocal activists attempting to maintain a failing undemocratic institution.

9.40am 2,957,066 signatures of which 41,249 in Westminster.

10.15am 2,999,122 signatures of which 43,317 in Westminster.

Update 15.00 – Scam responses from Westminster removed

UK votes for divorce from EU

The unexpected has happened. Despite the efforts of most of the British political establishment, the UK has voted by a narrow margin to leave the European Union. It should be viewed as a divorce which the interested parties had tried to prevent Like with a divorce, there needs to be deep breaths all round to accept the future dissolution. Like a divorce with children involved, Britain and the EU need to work constructively to achieve the best futures for all.
British politicians need to reflect as well. Maybe two-thirds supported Remain. Many were in line with their constituents, especially in London, Scotland and the M4 corridor where Prime Minister David Cameron’s constituency lies. But most of the North of England, particularly in the Labour Heartlands, voted for Leave. The MPs have to clearly state that they accept the result, and will join in obtaining the best futures for Britain and the countries of Europe. Those who cannot accept this should recognize they have no future in public service and resign from leading roles in politics.

Kevin Marshall

Guardian Images of Global Warming Part 1 – Australian Droughts

On Friday June 3rd the Guardian presented some high quality images with the headline

Droughts, floods, forest fires and melting poles – climate change is impacting Earth like never before. From the Australia to Greenland, Ashley Cooper’s work spans 13 years and over 30 countries. This selection, taken from his new book, shows a changing landscape, scarred by pollution and natural disasters – but there is hope too, with the steady rise of renewable energy.

The purpose is to convince people that human-caused climate change is happening now, to bolster support for climate mitigation policies. But the real stories of what the pictures show is quite different.  I will start with three images relating to drought in Australia.

Image 5

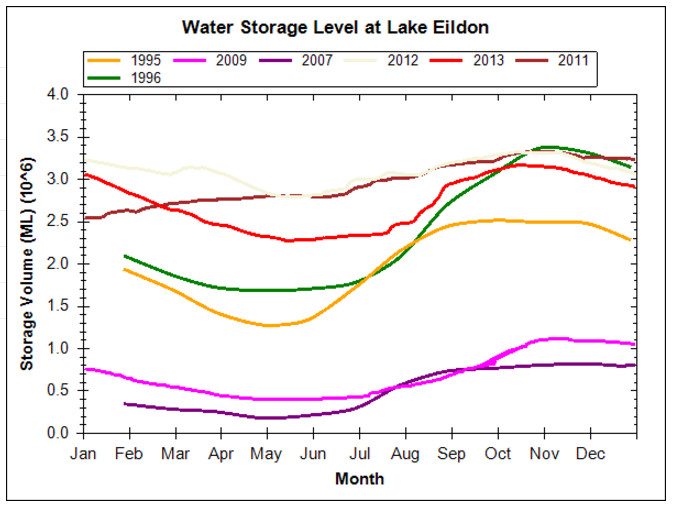
Forest ghosts: Lake Eildon in Victoria, Australia was built in the 1950’s to provide irrigation water, but the last time it was full was in 1995. The day the shot was taken it was at 29% capacity with levels down around 75ft.

Data from Lake Eildon (which is accessible with a simple search of Lake Eildon capacity) links to a graph where up to 7 years of data can be compared.

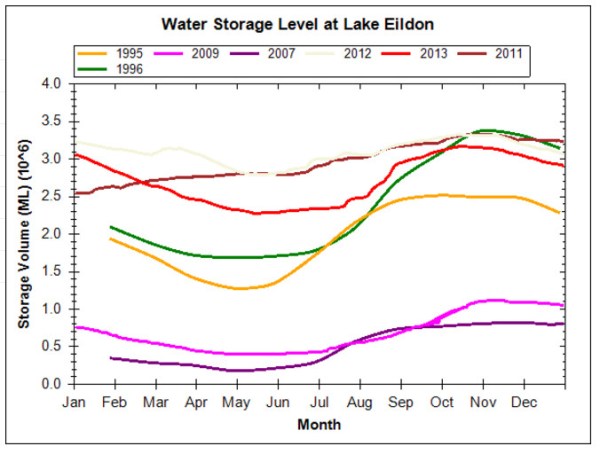
In 1995 the dam was not at full capacity, but it was full, for a short period, in the following year. However, more recently after the recent drought broke, in 2011 the reservoir was pretty much full for all the year.

But were the low levels due to more extreme drought brought on by climate change? That is very difficult to determine, as Lake Eildon is an artificial lake, constructed to provide water for irrigation occasional hydro-electric power as well as recreational facilities. The near empty levels at the end of the biggest drought in many decades could be just due a failure to predict the duration of the drought, or simply a policy of supplying irrigation water for the maximum length of time. The fact that water levels never reached full capacity for many years is indicated by a 2003 article in The Age

The dam wall at Lake Eildon, Victoria’s biggest state-run water storage, has been declared unsafe and will need a $30 million upgrade if the lake is to be refilled.

The dam, which is at its lowest level since being completed in 1956, will be restricted to just 65 per cent capacity because it no longer meets safety standards for earthquakes and extreme floods.

Image 6

Forest destroyed by bush fires near Michelago, New South Wales, Australia.

The inference is that this is caused by global warming.

According to Munich Re

The majority of bushfires in southeast Australia are caused by human activity

Bushfire is the only natural hazard in which humans have a direct influence on the hazard situation. The majority of bushfires near populated areas are the consequence of human activity. Lightning causes the smaller portion naturally. Sometimes, a carelessly discarded cigarette or a glass shard, which can focus the sun’s rays is all it takes to start a fire. Heat from motors or engines, or electric sparks from power lines and machines can ignite dry grass. Besides this accidental causes, a significant share of wildfires are started deliberately.

Humans also change the natural fire frequency and intensity. They decrease the natural fire frequency due to deliberate fire suppression near populated areas. If there is no fuel-reduction burning in forests for the purposes of fire prevention, large quantities of combustible material can accumulate at ground level.

Surface fires in these areas can become so intense due to the large amounts of fuel that they spread to the crowns of the trees and rapidly grow into a major fire. If humans had not intervened in the natural bushfire regime, more frequent low-intensity fires would have consumed the forest undergrowth and ensured that woodland grasses and scrubs do not proliferate excessively.

David Evans expands on the issue of fuel load in a 2013 article.

Like with the water levels in an artificial lake, forest fires are strongly influenced by the management of those forests. Extinguishing forest fires before they have run their natural course results in bigger and more intense fires at a later date. More frequent or intense droughts would not change this primary cause of many horrific forest fire disasters seen in recent years.

Image 7

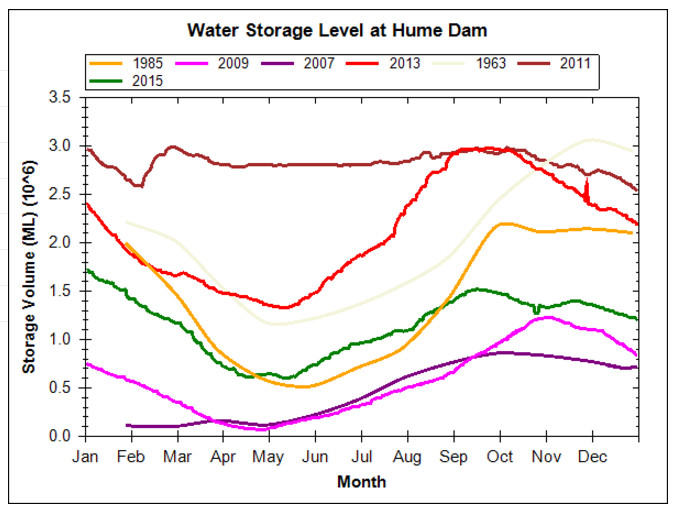
Where has all the water gone?: Lake Hume is the largest reservoir in Australia and was set up to provide irrigation water for farms further down the Murray Basin and drinking water for Adelaide. On the day this photograph was taken it was at 19.6% capacity. By the end of the summer of 2009 it dropped to 2.1 % capacity. Such impacts of the drought are likely to worsen as a result of climate change. The last time the water was anywhere near this road bridge was 10 years ago, rendering this no fishing sign, somewhat redundant.

Again this is old data. Like for Lake Eildon, it is easy to construct graphs.

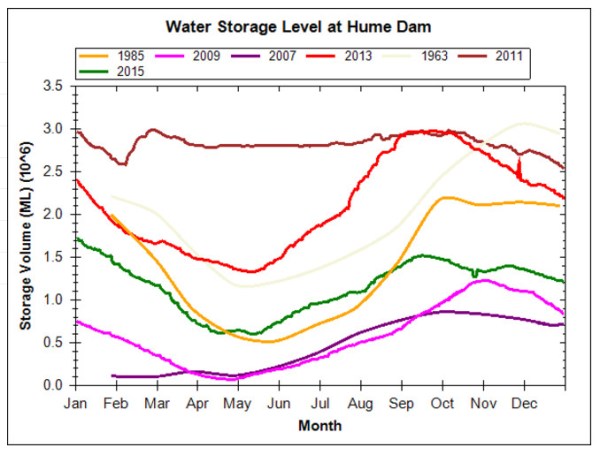
Following the end of the drought, the reservoir came back to full capacity. Worsening drought is only apparent to those who look over a short time range.

When looking at drought in Australia, Dorothea Mackellar’s 1908 poem “My Country” provides some context. Written for a British audience, the poem begins

I love a sunburnt country,

A land of sweeping plains,

Of ragged mountain ranges,

Of droughts and flooding rains

To understand the difference that human-caused climate change is having on the climate first requires an understanding of natural climatic variation over multiple time-scales. It then requires an understanding of how other human factors are influencing the environment, both intended and unintended.

Kevin Marshall

Are the Paris Floods due to climate changing for the worse?

The flood of the River Seine is now past the 6.1m peak reached in the early hours of the early hours of Saturday 4th June. 36 hours later, the official measurements at Pont d’Austerlitz show that the level is below 5.7m. The peak is was just below the previous major flood in 1982 of 6.15m, but well above the previous flood emergency in 2000, when waters peaked at 3.92m. Below is a snapshot of a continually-updated graphic at the Environment Ministry VIGICRUES site.

Despite it being 16 years since this last emergency, the reaction of the authorities has been impressive. From giving people warnings of the rising levels; evacuating people; stopping all non-emergency vessels on the Seine; protecting those who live on the river; and putting into operation emergency procedures for the movement of art treasures out of basement storage in the Louvre.Without these measures the death toll and the estimated €600m cost of the flood would undoubtedly have been much higher.

The question that must be asked is whether human-caused climate change has made flooding worse on a river that has flooded for centuries. The data is hard to come by. An article in Le Figaro last year gave the top ten record floods, the worst being in 1658.

Although this is does show that the current high of 6.10m is a full 50cm below the tenth worst in 1920, there is no indication of increasing frequency.

From a 2012 report Les entreprises face au risque inondation I have compiled a graphic of all flood maximums which were six metres or higher.

This shows that major floods were much more frequent in the period 1910 to 1960 than in the period before or after. Superficially it would seem that recently flooding had been getting less severe. But this conclusion would ignore the many measures that were put in place after the flood of 1910. The 2014 OECD Report Seine Basin, Île-de-France: Resilience to Major Floods stated:-

Since 1910, the risk of a Seine River flood in the Ile-de-France region has been reduced in various stages by protective structures, including dams built upstream and river development starting in the 1920s, then in the 1950s up until the early 1990s. Major investments have been limited in the last decades, and it appears that protection levels are not up to the standards of many other comparable OECD countries, particularly in Europe. On the other hand, the exposure to the risk and the resulting vulnerability are accentuated by increasing urban density in the economic centre of France, as well as by the construction of a large number of areas activity centres and critical infrastructures (transport, energy, communications, water) along the Seine River.

If the climate impact had become more severe, then one would expect the number of major floods to increase given the limited new measures to prevent them. However, the more substantial measures taken in the last century could explain the reduced frequency of major floods, though the lack of floods between 1882 and 1910 suggests that the early twentieth century could have been an unusually wet period. Without detailed weather records my guess is that it is a bit of both. Extreme rainfall has decreased, whilst flood prevention measures have also had some impact on flood levels.

Kevin Marshall