The Morality of Lying and Exaggerating for Climate Science

In the Guardian today, James Garvey, argues that the actions of Peter Gleick in lying to obtain documents from the Heartland Institute could be justified in the interests of the wider good. He says

The documents, if authentic, show that Heartland takes money – in secret – from people who have something to gain by the idea that climate science is uncertain, and then spread that idea with enthusiasm. Do I actually need to say this in 2012? There is no controversy in the scientific community about Heartland’s target: the fact of warming and the human role played in it.

What Heartland is doing is harmful, because it gets in the way of public consensus and action. Was Gleick right to lie to expose Heartland and maybe stop it from causing further delay to action on climate change?

There are some issues with this statement

  • The most important strategy document is almost certainly fake. Peter Gleick was accused of being the source of the leak by Steven Mosher, because this document was in his distinctive style of writing, including grammatical errors. Gleick denies he wrote the fake document, but now admits to (the lesser crime of) obtaining the other documents by deception.
  • The following statement is ambiguous

    There is no controversy in the scientific community about Heartland’s target: the fact of warming and the human role played in it

    It can mean one of four options. First, that the “scientific community” believe what the Heartland’s target is (so there must be a straw poll somewhere). Second, the scientific community believe in anthropogenic global warming. In which case there a definition of who is in the “scientific community” and who is out. The “97% of scientists believe” was a small subset of all scientists in the climate field, who were asked two very trivial questions, so the degree of belief is not in the predicted level of catastrophe that will justify drastic action. Third as to whether the human role played in (global warming) is a fact. The statement of global average surface temperatures being higher than they were 50, 100, 150, or 400 years ago is incontrovertible (though the actual amount is debatable), but the human role is a subject of wide controversy. They are two separate facts, so the human role is just a belief of the 97% of 1.6% of those who answered two trivial questions, which was just over 30% of those who received questionnaires. Whatever the ambiguities in the statement, it does not rely on scientific evidence, as there is plenty of controversy of the anthropogenic contribution due to a lack of incontrovertible scientific evidence.

  • If the scientific consensus was created by a minority  and maintained by “outing” any who voiced concerns, with activists seeking to annul their funding, then that “consensus” opinion should be viewed with a little bit of scepticism.
  • The statement “What Heartland is doing is harmful, because it gets in the way of public consensus and action.” is a potential moral minefield. If 90% of the population decide that it is alright to persecute a peaceful minority would that be alright? If 90% of the population strongly believe that potential terrorists should be held without trial and tortured, would that be alright?

But leaving these issues aside, the problem with telling lies, or exaggerating, is when you are found out. Once you have lost people’s trust, it is very hard to regain that trust. Dale Carnegie in “How To Win Friends And Influence People” made this very point. 
However, from a purely utilitarian point of view it might be permissible to mislead a suspect criminal in order to find the evidence, at it is not that person’s trust that you want to maintain. The wider public will generally think well of you if you get a criminal off the streets. But if it is to marginalise you opponents, it will backfire if the wider public then perceive that you cannot be trusted. This is especially true when much of the case for climate change is based on trust in scientists to report accurately on a complex subject.

The reasons that there is growing distrust in the scientific consensus are multiple:

  • Michael Mann’s hockey stick studies were based on cherry-picked data, biased weightings of individual studies that showed hockey sticks over the ones that did not AND the favoured studies have all been overturned.
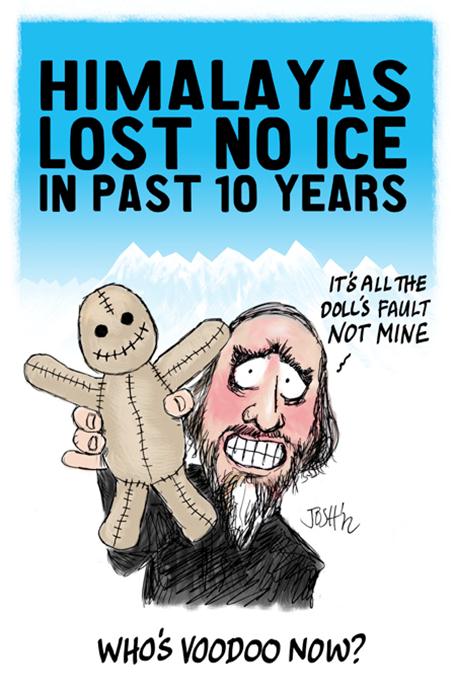
  • The UNIPCC 2007 report did not live up the projected image in a number of areas. The Himalayan Glaciers episode is only the tip of the non-melting iceberg. It is full of partisan analysis and exclusion of contrary science.
  • The Climategate email hack also showed the public image of certainties held by a wide number of scientists is nothing of the sort. The core group are highly partisan, and have taken strenuous efforts to exclude contrary views from the journals.

Finally, please remember that activists have got every major scientific body, including the Royal Society, to make proclamations in favour of Global Warming Alarmism. If public funding of science is seen to go to those who lie and exaggerate, then there will be increased distrust in all areas of science. These activists scientists are risking more than their own reputations.


Did Wivenhoe dam operators SEQwater swallow the CAGW hype on Australian Droughts?

The Australian “The Climate Sceptics Blog” takes a look at the Wivenhoe dam’s involvement in the catastrophic Queensland flood. I disagreed with the opinion that it might be sufficient to show that operators SEQwater did not undertake a proper, impartial risk assessment.


The question of having to prove the “AGW is not true” in the Wivenhoe case may be a little extreme.

Rather, they would need to show that the operators had a revised policy that gave due weighting to the Australian Government’s Report. I have only read the results. It says here quite clearly

“Observed trends in exceptionally low rainfall years are highly dependent on the period of analysis due to large variability between decades.”

In other words the results are not robust. This is not surprising. The report only looked at period of 40 years, so could say little about the frequency of once-in-a-generation extreme events. It does not say that floods will never occur again, like they have in the area since time immemorial.

If the authorities did not undertake a proper risk assessment of future scenarios based upon a balance of existing knowledge, and the report, then the change of purpose from flood management to reserve storage facility is flawed. This is unless there is near certainty that a climatic shift has occurred in a definite way. This was because

  1. The Report clearly stated that its results were not robust, AND did not predict that extreme rainfall would never happen again.
  2. There is a further complication that may hold. If there is not an extreme climatic shift (or only a partial one, or are in a slow transition from one state to another), then an area with extreme floods in the past will still likely have extreme floods in the future.
  3. Further, the lack of extreme floods for an extended period might pose a greater risk of extreme flooding in the immediate future.

This whole thing becomes a complex matter of balance of risks. That is why they should have solicited expert opinion on risk management from different perspectives, and tried to eliminate any corporate or individual biases. Furthermore, a risk management body should have publicly stated this change of use of the Wivenhoe Dam, so that householders could make adjustments to their risk portfolios.


These conclusions are based analysis of unfolding news reports hype on droughts and floods; the hype that exists for Catastrophic Anthropogenic Global Warming; and my developing analysis of Climate Change (see here, here and here) This comment is not intended as a legal opinion on the case, nor should it be taken as such.

A Climate Change / Global Warming Spectrum

In politics, most people’s views can be placed on a spectrum, when it comes to climate change / global warming there is no such perspectives. The views are often polarized, particularly by those who believe in a future climate catastrophe. This is an initial attempt at a grid aimed at clarifying the issues. Your constructive advice is sought on how this might be improved.

When there are contentious or politicized issues, a spectrum of opinions emerge where there is free discussion of ideas. This is true in politics and the Christian religion. In both, there is not just a one-dimensional spectrum of ideas, but multi-dimensional perspectives. For instance, in politics it has been argued that the left-right spectrum should be split into economic and moral issues. The United States Libertarian Party has had a simple survey running since 1995. A more comprehensive (but still American-orientated) survey is the Political Spectrum Quiz.

Another idea comes from Greg Craven, who did a series of zany You-Tube videos on Climate Change, particularly such as The Most Terrifying Video You’ll Ever See” and “How it all ends“. He claimed that for the mass of non-scientists it was best to take a risk-based approach, grading the science on the credibility of those who made the claims. One objection with his analysis was it was based on polar extremes. That is either the worst climate catastrophe imaginable, or it is all a hoax. I proposed that there was a spectrum of possible outcomes, with the apocalyptic catastrophe at one extreme and the null outcome at the other. Basically there is a spectrum of views.

For this spectrum, the possible scenarios are from the null outcome on the left, rising to a huge climate catastrophe on the right.

Craven’s argument was to consider either 0 or 1000, whereas I claimed that the UNIPCC scenarios (representing the “consensus” of climate scientists), allowed for a fair range of outcomes. I have provided a log scale, as this puts clear distance between someone who believes in a low risk of catastrophe of extreme catastrophe to someone who says there is no risk at all. For instance, if someone believes that there is a 1% chance of the worst case, a 9% chance of loss of 100 and a 90% chance of a loss of 10, then their score would be 0.01*1000 + 0.09*100 + 0.90*10 = 28. In other words, for that person, especially if they are risk averse, there is still a very significant issue that should justify serious consideration of some type of global policy action.

But this measure of the prospective level of climate catastrophe needs to be based upon something. That something is scientific evidence, not people’s intuitions or gut feelings. If we imagine that the uncertainties can be measured as risks (as neoclassical economists do) then then the worst case scenario can only be attained if there is near certain, unambiguous scientific evidence in support of that prediction. If the evidence is weak statistically, gives highly variables results depending on methodology or data sets, or only tangential to the prediction, then a lower risk weighting lower than 1 will need to be ascribed. For an overall picture, we need to ascribe a weighting to the body of evidence. I propose a traffic light system. In outline green is for an overwhelming body of evidence, red is for no proper evidence whatsoever, and amber is for some weak evidence. Something along the following lines:-

Basically, an unambiguous case for impending global catastrophe must have a substantial body of strong scientific evidence to substantiate that case, with little or no contrary evidence. I will develop on another day the analogy with evidence presented to a criminal court by the prosecution. However, for the present, an analogy that is relevant is that this conclusion is only reached once the evidence fails to fall over under independent cross-examination.

This gives us a grid with the magnitude of the climate catastrophe on the X axis, and the scientific case on the Y axis. The grid, with my first opinion of where people various groups are placed, is given below. I know it is controversial – the whole aim is to get people to start thinking constructively about their views.

Alarmist Blogs (for instance Skeptical Science and Desmogblog) have an extreme black-and-white one world where they are always right, and anyone who disagrees is the polar opposite . “Deniers” is a bogeyman construct of their making.

If one reads the detail of UNIPCC AR4 report, the “Consensus” of climate scientists allow for some uncertainties, and for scenarios which are not so catastrophic.

The more Sceptical Scientists, such as Richard Lindzen, Roger Pielke Snr and Roy Spencer, view increasing greenhouse gases as a serious issue for study. However, they view the evidence as being both much weaker than the “consensus” and pointing to a much less alarming future.

The most popular Sceptic Blogs, such as Wattsupwiththat, Climate Audit and Bishop Hill I characterise as having a position of “The stronger the evidence, the weaker the relevance“. That is they allow for a considerable spread of views, but neither dismiss rise in CO2 as of no consequence, nor claim that the available evidence is strong.

Finally, the Climate Realists such as Joanne Nova and the British Climate Realists website. They occupy a similar position as the “deniers”, but from a much more substantial position. They can see little or no evidence of catastrophe, but huge amounts of exaggeration dressed up as science.

What are your opinions? What position do you think you lie on the grid? Is there an alternative (and more informative) way of characterizing the different positions?

Heartland Leak – The Implications

The stolen documents from the Heartland Institute have caused a lot of comment on the blogs. There are a number of things that will come out of this.

1. The consensus climate scientists and their cohorts cannot deal with numbers. Just as they have no sense of proportion with financial values (see Jo Nova on this), they likewise have no sense of proportion with sea level rise, temperature rise, or extreme weather events.

2. A better antonym of “sceptical” than “undoubting” or “believer” is “gullible”. Seems DeSmogBlog did not think to check out the authenticity of the damming 2012 strategy document, neither do they accept the Heartland rebuttal. It fitted the narrative, so they published within an hour of receiving the mail. Similarly The Guardian posted a number of one-sided reports (here, here, here), as did Roger Black of the BBC, without waiting to verify the facts. The most alarming 2012 strategy document is a fax (Judith Curry has other references)

3. A number of people, like me, will visit Heartland.org for the first time. They will find they have 7 policy areas employing 20 people, of which “Environment & Energy” employs 3. They specialise in providing cogent summaries of these issues to policy-makers. Whatever you think of their political stance, they are hardly the secretive, rabid backwoodsmen right-wingers that the alarmists project.

4. This support for spreading information in a concise, intelligible form also comes out in the sceptic-funding “exposes”. There is one-off support for Antony Watts who

proposes to create a new Web site devoted to accessing the new temperature data from NOAA’s web site and converting them into easy-to-understand graphs that can be easily found and understood by weathermen and the general interested public.” 

The, alleged, biggest recipient by far of monthly funding is Craig D Idso, who founded the co2science.org website. This provides summaries of climate science papers, collating their results to help give an overall picture of such as the medieval warm period, ocean acidification and the effect of CO2 on plant growth. For instance, I like this graphic summarising the proxy studies of the MWP showing that the Mannian Hockey Stick studies need to at least reconcile their claim that average global temperatures are warmer than in the last 1000 years.

5. It illustrates the upside-down nature of climatology, compared with conventional science. Conventional science is based on making bold statements and predictions that are substantiated by the evidence, with very clear and replicable methods. Over time it refines its techniques, strengthens its methods of analysis and sees its predictions confirmed. It does not need to denigrate, or attempt to silence its detractors. Like the historians of the holocaust, conventional science just points to the evidence and enlightens those who seek the truth. The real deniers of truth in history have been those who silence their opponents and fabricate distortions.

Overall, the leak exposes why the little Heartland Institute is so evil and dangerous to many. They threaten the jobs and reputations of tens of thousands of climate scientists, “policy-makers”, regulators, and powerful business interests in the alternatives to reliable energy. On the other hand, they are on the side of those made hungry by fuel crops competing with food, and of future generations globally, who will be worse-off by growth-sapping mitigation policies.

Cold water on sea level rise alarmism

The new article in Nature on “Recent contributions of glaciers and ice caps to sea level rise” (Jacob et al. 2012) is in stark contrast to what has gone before. It is far from the previous claims.

The main estimates before Jacob et al. 2012 were:-

  • The Himalayan Glaciers will disappear by 2035. (UNIPCC AR4 2007) Changed to the Himalayan Glaciers may disappear by 2350. (UNIPCC 2010)
  • The Grace Satellite data shows that the polar ice caps are not only melting, but the melt rate is accelerating. Velicogna 2009 claimed that the acceleration in Greenland was −30 ± 11 bnt/yr2 to 286 bnt/yr-1 in 2007 to 2009, and in Antarctica was −26 ± 14 bnt/yr2 to 246 bnt/yr-1 in 2007 to 2009. Concentrating on the period from 2006 to early 2009 for Antarctica only , Chen et al. 2009 estimated that the continent was losing ice at the rate of 190 ± 77 bnt/yr-1, two-thirds is of which comes from West Antarctica, covering about a quarter of the total land surface area. By 2010, the loss from both polar caps would, by Veligona’s estimate be 600 to 650 bnt/yr-1.
  • The average of these two articles was that in 2010 there would be around 600 bnt/yr-1 loss per year.
  • One of the articles’ authors, Prof John Wahr of University of Colarado, Boulder, had previously stated that the Grace measurements indicate an accelerating trend in Greenland. The current graph at Wahr’s website for Greenland shows a distinct accelerating trend through to the start of 2010.

    Mass variability summed over the entire Greenland Ice Sheet, monthly Gravity Recovery and Climate Experiment (GRACE) results (black line; the orange line is a smoothed version) April 2002 and December 2009.

    Prof John Wahl’s graph of Greenland Ice sheet loss, indicating a doubling of the rate of loss over the period to around 150 bnt/yr-1 in 2009.

  • In Zwally and Giovinetto 2011, using three separate estimation techniques, and including the pre-satellite data from 1992 to 2002, estimated the range of +27 to -40 bnt/yr-1.

The new paper in Nature:-

  • Estimates no net loss from the Himalayas in the period 2003 to 2010. When the claim that the Himalayas would lose their glaciers by 2035, Rajendra Pauchari, head of the UNIPCC said the doubts were “voodoo science”. Now even the more moderate claim of melting over hundreds of years looks to be in doubt. Josh has penned a cartoon to illustrate this point.

  • Velicogna 2009, seems somewhat extreme. The Nature paper would estimates a loss of 50% to 75% Velicogna estimate for 2010.
  • Most importantly, there is no mention of acceleration of ice melt from the polar ice caps. This sudden turn-around might be to a sudden change in the data. The sea level rise appears to have stalled in the last 18-24 months, so the sea ice melt (which the Nature paper estimates accounts for 40% of the sea level rise) may have stalled as well. (See Appendix 2). It is necessary to re-run the Nature paper numbers for 2011 data to confirm if this is the case.

In conclusion, it looks that the new nature paper reaches a more moderate position than previous papers using the GRACE satellite data, as it uses a longer period, and subjects the data to a more detailed breakdown. However, in terms of the polar ice melt, it still more extreme than a paper that uses a longer timeframe and three distinct methods of calculation.

Appendix 1 – Leo Hickman in the Guardian has a breakdown of the figures, that nicely puts the issue in context.

Glaciers
Ignore Region Rate (Gt yr-1)
1 Iceland -11.±.2
2 Svalbard -3.±.2
3 Franz Josef Land 0.±.2
4 Novaya Zemlya -4.±.2
5 Severnaya Zemlya -1.±.2
6 Siberia and Kamchatka 2.±.10
7 Altai 3.±.6
8 High Mountain Asia -4.±.20
8a Tianshan -5.±.6
8b Pamirs and Kunlun Shan -1.±.5
8c Himalaya and Karakoram -5.±.6
8d Tibet and Qilian Shan 7.±.7
9 Caucasus 1.±.3
10 Alps -2.±.3
11 Scandinavia 3.±.5
12 Alaska -46.±.7
13 Northwest America excl. Alaska 5.±.8
14 Baffin Island -33.±.5
15 Ellesmere, Axel Heiberg and Devon Islands -34.±.6
16 South America excl. Patagonia -6.±.12
17 Patagonia -23.±.9
18 New Zealand 2.±.3
19 Greenland ice sheet.+.PGICs -222.±.9
20 Antarctica ice sheet.+.PGICs -165.±.72
  Total -536.±.93
  GICs excl. Greenland and Antarctica PGICs -148.±.30
  Antarctica.+.Greenland ice sheet and PGICs -384.±.71
  Total contribution to SLR -1.48.±.0.26
  SLR due to GICs excl. Greenland and Antarctica PGICs -0.41.±.0.08
  SLR due to Antarctica.+.Greenland ice sheet and PGICs -1.06.±.0.19


Appendix 2 – University of Colarado Sea level Rise Estimates