Oxford University’s Smith School of Enterprise and the Environment in August published a report “Could Britain’s energy demand be met entirely by wind and solar?“, a short briefing “Wind and solar power could significantly exceed Britain’s energy needs” with a press release here. Being a (slightly) manic beancounter, I will review the underlying assumptions, particularly the costs.
Summary Points
- Projected power demand is likely high, as demand will likely fall as energy becomes more expensive.
- Report assumes massively increased load factors for wind turbines. A lot of this increase is from using benchmarks contingent on technological advances.
- The theoretical UK scaling up of wind power is implausible. 3.8x for onshore wind, 9.4x for fixed offshore and >4000x for floating offshore wind. This to be achieved in less than 27 years.
- Most recent cost of capital figures are from 2018, well before the recent steep rises in interest rates. Claim of falling discount rates is false.
- The current wind turbine capacity is still a majority land based, with a tiny fraction floating offshore. A shift in the mix to more expensive technologies leads to an 82% increase in average levelised costs. Even with the improbable load capacity increases, the average levilised cost increase to 37%.
- Biggest cost rise is from the need for storing days worth of electricity. The annual cost could be greater than the NHS 2023/24 budget.
- The authors have not factored in the considerable risks of diminishing marginal returns.
Demand Estimates
The briefing summary states
The analysis shows that GB’s estimated practical wind and solar energy resources (2,896 TWh/year) are almost ten times current electricity needs (299 TWh/year) and easily exceed even the highest 2050 demand forecasts for all energy (1,500 TWh/year), including scenarios that involve electrification of
much of the economy.
299 TWh/year is an average of 34 GW, compared with 30 GW average demand in 2022 at grid.iamkate.com. I have no quibble with this value. But what is the five-fold increase by 2050 made-up of?
From page 7 of the full report.
In 2021, UK primary energy demand was 1,978 TWh and final energy demand 1,599 TWh (Harris, 2022, p. 3). This was 4.7% higher than 2020, but 7.8% lower than pre-pandemic levels (Harris, 2022, p. 3). Electricity consumption in GB was 299 TWh (McGarry, 2022).
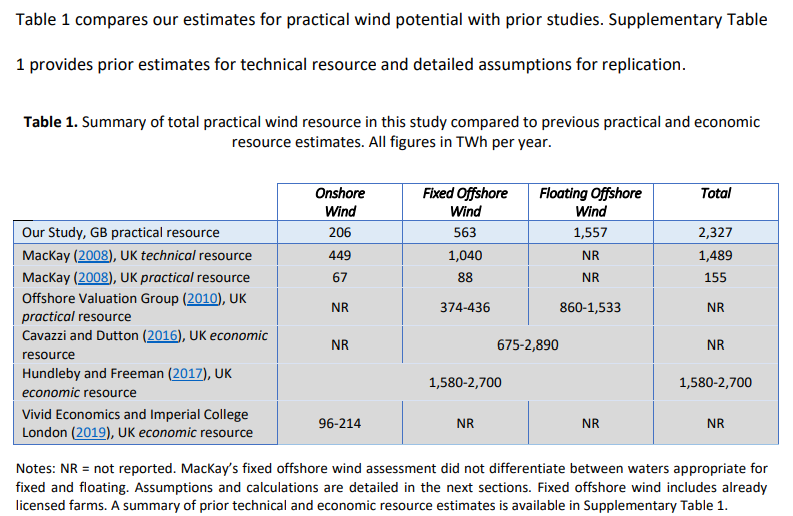
So 2050 maximum energy demand will be slightly lower than today? For wind (comprising 78% of potential renewables output) the report reviews the estimates in Table 1, reproduced below as Figure 1

The study has quite high estimates of output compared to previously, but things have moved on. This is of course output per year. If the wind turbines operated at 100% capacity then the required for 24 hours a day, 365.25 days a year would be 265.5 GW, made up of 23.5GW for onshore, 64GW for fixed offshore and 178GW for floating offshore. In my opinion 1500 TWh is very much on the high side, as demand will fall as energy becomes far more expensive. Car use will fall, as will energy use in domestic heating when the considerably cheaper domestic gas is abandoned.
Wind Turbine Load Factors
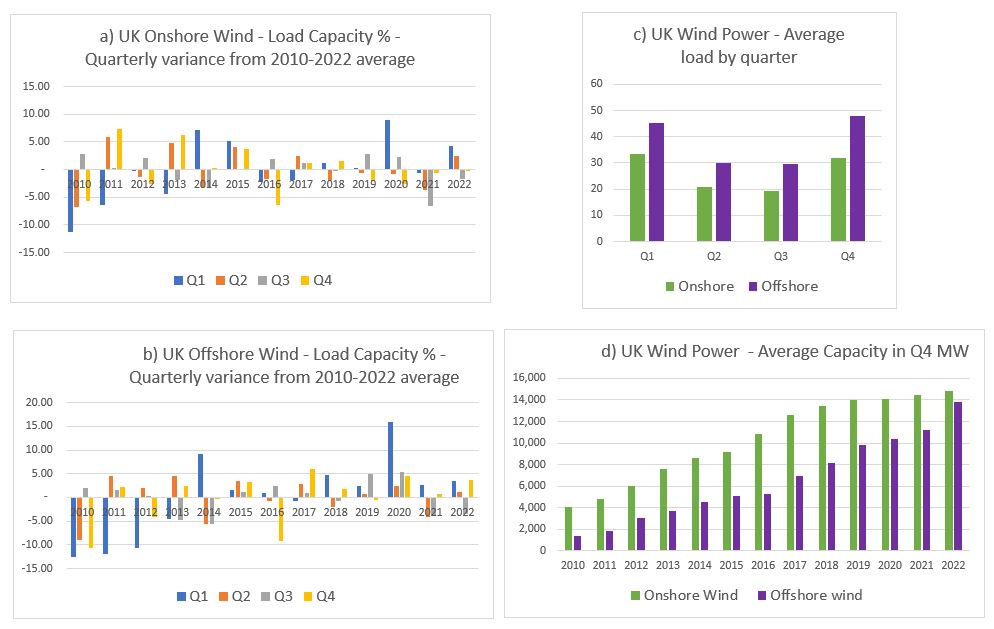
Wind turbines don’t operate at anything like 100% of capacity. The report does not assume this. But it does assume load factors of 35% for onshore and 55% for offshore. Currently floating offshore is insignificant, so offshore wind can be combined together. The UK Government produces quarterly data on renewables, including load factors. In 2022 this average about 28% for onshore wind (17.6% in Q3 to 37.6% in Q1) and 41% for offshore wind (25.9% in Q3 to 51.5% in Q4). This data, shown in four charts in Figure 2 does not seem to shown an improving trend in load capacity.

The difference is in the report using benchmark standards, not extrapolating from existing experience. See footnote 19 on page 15. The first ref sited is a 2019 DNV study for the UK Department for Business, Energy & Industrial Strategy. The title – “Potential to improve Load Factor of offshore wind farms in the UK to 2035” – should give a clue as to why benchmark figures might be inappropriate to calculate future average loads. Especially when the report discusses new technologies and much larger turbines being used, whilst also assuming some load capacity improvements from reduced downtimes for maintenance.
Scaling up
The report states on page 10
UK wind capacity totals 28.5 GW comprising 14.7 GW onshore and 13.8 GW offshore.
From the UK Government quarterly data on renewables, these are the figures for Q3 2022. Q1 2023 gives 15.2 GW onshore and 14.1 GW offshore. This offshore value was almost entirely fixed. Current offshore floating capacity is 78 MW (0.078 GW). This implies that to reach the reports objectives of 2050 with 1500 TwH, onshore wind needs to increase 3.8 times, offshore fixed wind 9.4 times and offshore floating wind over 4000 times. Could diminishing returns, in both output capacities and costs per unit of capacity set in with this massive scaling up? Or maintenance problems from rapidly installing floating wind turbines of a size much greater than anything currently in service? On the other hand, the report notes that Scotland has higher average wind speeds than “Wales or Britain”, to which I suspect they mean that Scotland has higher average wind speeds to the rest of the UK. If so, they could be assuming a good proportion of the floating wind turbines will be located off Scotland, where wind speeds are higher and therefore the sea more treacherous. This map of just 19 GW of proposed floating wind turbines is indicative.
Cost of Capital
On page 36 the report states
According to BEIS, 2020 discount rates for solar, onshore, and offshore wind projects were 5.0%, 5.2%, and 6.3% respectively in the UK, down from 6.5%, 6.7%, and 8.9% in 2015 (BEIS, 2020b).
You indeed find these rates on “Table 2.7: Technology-specific hurdle rates provided by Europe Economics”. My quibble is not that they are 2018 rates, but that during 2008-2020 interests rates were at historically low levels. In a 2023 paper it should recognise that globally interest rates have leapt since then. In the UK, base rates have risen from 0.1% in 2020 to 5.25% at the beginning of August 2023. This will surely affect the discount rates in use.
Wind turbine mix
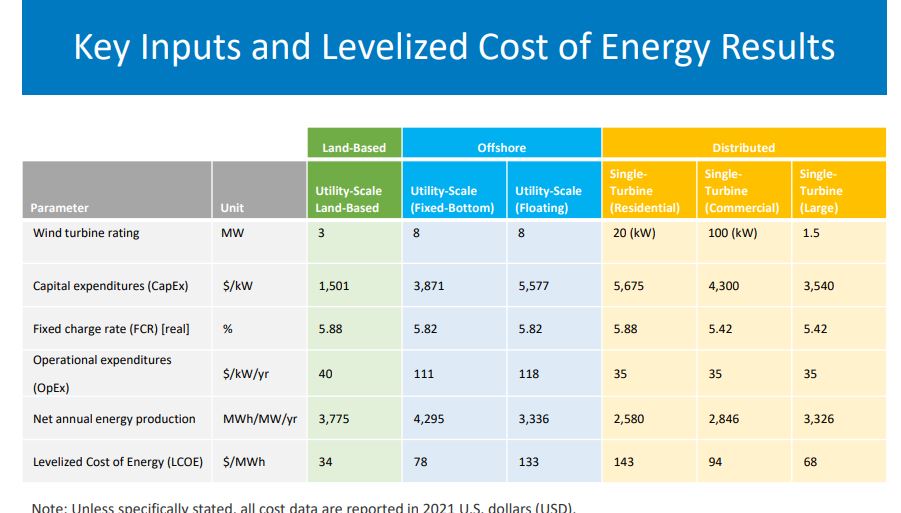
Costs of wind turbines vary from project to project. However, the location determines the scale of costs. It is usually cheaper to put up a wind turbine on land than fix it to a sea bed, then construct a cable to land. This in turn is cheaper than anchoring a floating turbine to a sea bed often in water too deep to fix to the sea bed. If true, moving from land to floating offshore will increase average costs. For this comparison I will use some 2021 levilized costs of energy for wind turbines from US National Renewable Energy Laboratory (NREL).
The levilized costs are $34 MWh for land-based, $78 MWh for fixed offshore, and $133 MWh for floating offshore. Based on the 2022 outputs, the UK weighted average levilized cost was about $60 MWh. On the same basis, the report’s weighted average levilized cost for 2050 is about $110 MWh. But allowing for 25% load capacity improvements for onshore and 34% for offshore brings average levilized cost down to $82 MWh. So the different mix of wind turbine types leads to an 83% average cost increase, but efficiency improvements bring this down to 37%. Given the use of benchmarks discussed above it would be reasonable to assume that the prospective mix variance cost increase is over 50%, ceteris paribus.
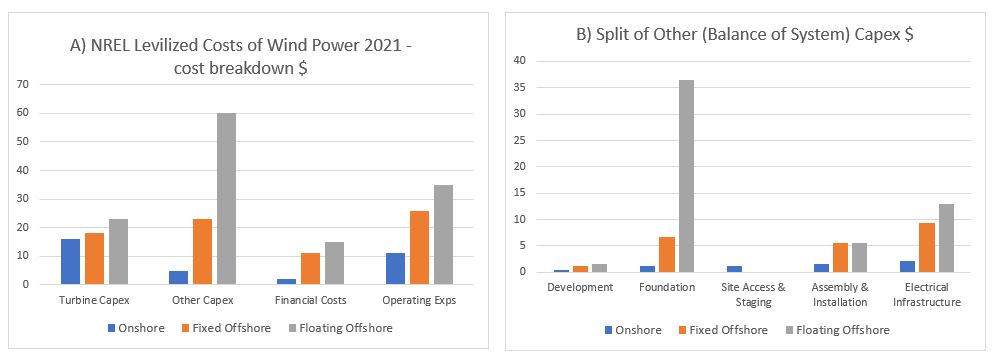
The levilized costs from the USA can be somewhat meaningless for the UK in the future, with maybe different cost structures. Rather than speculating, it is worth understanding why the levilized cost of floating wind turbines is 70% more than offshore fixed wind turbines, and 290% more (almost 4 times) than onshore wind turbines. To this end I have broken down the levilized costs into their component parts.

Observations
- Financial costs are NOT the costs of borrowing on the original investment. The biggest element is cost contingency, followed by commissioning costs. Therefore, I assume that the likely long-term rise interest rates will impact the whole levilized cost.
- Costs of turbines are a small part of the difference in costs.
- Unsurprisingly, operating cost, including maintenance, are significantly higher out at sea than on land. Similarly for assembly & installation and for electrical infrastructure.
- My big surprise is how much greater the cost of foundations are for a floating wind turbine are than a fixed offshore wind turbine. This needs further investigation. In the North Sea there is plenty of experience of floating massive objects with oil rigs, so the technology is not completely new.
What about the batteries?
The above issues may be trivial compared to the issue of “battery” storage for when 100% of electricity comes from renewables, for when the son don’t shine and the wind don’t blow. This is particularly true in the UK when there can be a few day of no wind, or even a few weeks of well below average wind. Interconnectors will help somewhat, but it is likely that neighbouring countries could be experiencing similar weather systems, so might not have any spare. This requires considerable storage of electricity. How much will depend on the excess renewables capacity, the variability weather systems relative to demand, and the acceptable risk of blackouts, or of leaving less essential users with limited or no power. As a ballpark estimate, I will assume 10 days of winter storage. 1500 TWh of annual usage gives 171 GW per hour on average. In winter this might be 200 GW per hour, or 48000 GWh for 10 or 48 million Mwh. The problem is how much would this cost?
In April 2023 it a 30 MWh storage system was announced costing £11 million. This was followed in May by a 99 MWh system costing £30 million. These respectively cost £367,000 and £333,000 per MWh. I will assume there will be considerable cost savings in scaling this up, with a cost of £100,000 per MWh. Multiplying this by 48,000,000 gives a cost estimate of £4.8 trillion, or nearly twice the 2022 UK GDP of £2.5 trillion. If one assumes a 25 year life of these storage facilities, this gives a more “modest” £192 billion annual cost. If this is divided by an annual usage of 1500 TWh it comes out at a cost of 12.8p KWh. These costs could be higher if interest rates are higher. The £192 billion costs are more than the 2023/24 NHS Budget.
This storage requirement could be conservative. On the other hand, if overall energy demand is much lower, due to energy being unaffordable it could be somewhat less. Without fossil fuel backup, there will be a compromise between costs energy storage and rationing with the risk of blackouts.
Calculating the risks
The approach of putting out a report with grandiose claims based on a number of assumptions, then expecting the public to accept those claims as gospel is just not good enough. There are risks that need to be quantified. Then, as a project progresses these risks can be managed, so the desired objectives are achieved in a timely manner using the least resources possible. These are things that ought to be rigorously reviewed before a project is adopted, learning from past experience and drawing on professionals in a number of disciplines. As noted above, there are a number of assumptions made where there are risks of cost overruns and/or shortfalls in claimed delivery. However, the biggest risks come from the law of diminishing marginal returns, a concept that has been understood for over 2 00 years. For offshore wind the optimal sites will be chosen first. Subsequent sites for a given technology will become more expensive per unit of output. There is also the technical issue of increased numbers of wind turbines having a braking effect on wind speeds, especially under stable conditions.
Concluding Comments
Technically, the answer to the question “could Britain’s energy demand be met entirely by wind and solar?” is in the affirmative, but not nearly so positively at the Smith School makes out. There are underlying technical assumptions that will likely not be borne out with further investigations. However, in terms of costs and reliable power output, the answer is strongly in the negative. This is an example of where rigorous review is needed before accepting policy proposals into the public arena. After all, the broader justification of contributing towards preventing “dangerous climate change” is upheld in that an active global net zero policy does not exist. Therefore, the only justification is on the basis of being net beneficial to the UK. From the above analysis, this is certainly not the case.
