Beliefs and Uncertainty: A Bayesian Primer

Ron Clutz’s introduction, based on a Scientific American article by John Horgan on January 4, 2016, starts to grapple with the issues involved.

The take home quote from Horgan is on the subject of false positives.

Here is my more general statement of that principle: The plausibility of your belief depends on the degree to which your belief–and only your belief–explains the evidence for it. The more alternative explanations there are for the evidence, the less plausible your belief is. That, to me, is the essence of Bayes’ theorem.

“Alternative explanations” can encompass many things. Your evidence might be erroneous, skewed by a malfunctioning instrument, faulty analysis, confirmation bias, even fraud. Your evidence might be sound but explicable by many beliefs, or hypotheses, other than yours.

In other words, there’s nothing magical about Bayes’ theorem. It boils down to the truism that your belief is only as valid as its evidence. If you have good evidence, Bayes’ theorem can yield good results. If your evidence is flimsy, Bayes’ theorem won’t be of much use. Garbage in, garbage out.
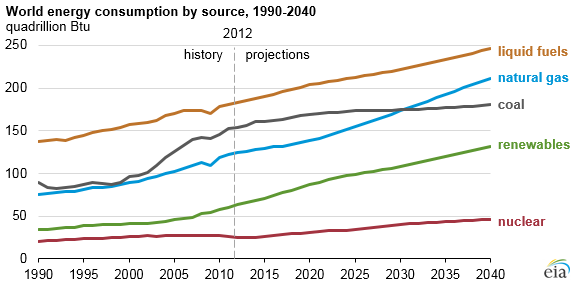
With respect to the question of whether global warming is human caused, there is basically a combination of three elements – (i) Human caused (ii) Naturally caused (iii) Random chaotic variation. There may be a number of sub-elements and an infinite number of combinations including some elements counteracting others, such as El Nino events counteracting underlying warming. Evaluation of new evidence is in the context of explanations being arrived at within a community of climatologists with strong shared beliefs that at least 100% of recent warming is due to human GHG emissions. It is that same community who also decide the measurement techniques for assessing the temperature data; the relevant time frames; and the categorization of the new data. With complex decisions the only clear decision criteria is conformity to the existing consensus conclusions. As a result, the original Bayesian estimates become virtually impervious to new perspectives or evidence that contradicts those original estimates.

Science Matters

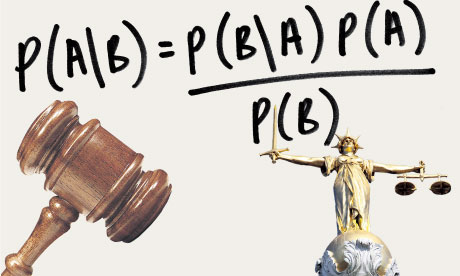
Those who follow discussions regarding Global Warming and Climate Change have heard from time to time about the Bayes Theorem. And Bayes is quite topical in many aspects of modern society:

Bayesian statistics “are rippling through everything from physics to cancer research, ecology to psychology,” The New York Times reports. Physicists have proposed Bayesian interpretations of quantum mechanics and Bayesian defenses of string and multiverse theories. Philosophers assert that science as a whole can be viewed as a Bayesian process, and that Bayes can distinguish science from pseudoscience more precisely than falsification, the method popularized by Karl Popper.

Named after its inventor, the 18th-century Presbyterian minister Thomas Bayes, Bayes’ theorem is a method for calculating the validity of beliefs (hypotheses, claims, propositions) based on the best available evidence (observations, data, information). Here’s the most dumbed-down description: Initial belief plus new evidence = new and improved belief.   (A fuller and…

View original post 1,082 more words

CO2 Emissions from Energy production forecast to be rising beyond 2040 despite COP21 Paris Agreement

Last week the US Energy Information Administration (EIA) published their INTERNATIONAL ENERGY OUTLOOK 2016. The Daily Caller (and the GWPF) highlighted the EIA’s summary energy energy production. This shows that the despite the predicted strong growth in nuclear power and implausibly high growth in renewables, usage of fossil fuels are also predicted to rise, as shown in their headline graphic below.

For policy purposes, the important aspect is the translation into CO2 emissions. In the final Chapter 9. Energy-related CO2 Emissions figure 9.3 shows the equivalent CO2 Emissions in billions of tonnes of CO2. I have reproduced the graphic as a stacked bar chart.

Data reproduced as a stacked bar chart.

In 2010 these CO2 emissions are just under two-thirds of total global greenhouse gas emissions. The question is how does this fit into the policy requirements to avoid 2°C from the IPCC’s Fifth Assessment Report? The International Energy Authority summarized the requirements very succicently in World Energy Outlook 2015 Special Report page 18

The long lifetime of greenhouse gases means that it is the cumulative build-up in the atmosphere that matters most. In its latest report, the Intergovernmental Panel on Climate Change (IPCC) estimated that to preserve a 50% chance of limiting global warming to 2 °C, the world can support a maximum carbon dioxide (CO2) emissions “budget” of 3 000 gigatonnes (Gt) (the mid-point in a range of 2 900 Gt to 3 200 Gt) (IPCC, 2014), of which an estimated 1 970 Gt had already been emitted before 2014. Accounting for CO2 emissions from industrial processes and land use, land-use change and forestry over the rest of the 21st century leaves the energy sector with a carbon budget of 980 Gt (the midpoint in a range of 880 Gt to 1 180 Gt) from the start of 2014 onwards.

From the forecast above, cumulative CO2 emissions from 2014 with reach 980 Gt in 2038. Yet in 2040, there is no sign of peak emissions.

Further corroboration comes from the UNFCCC. In preparation for the COP21 from all the country policy proposals they produced a snappily titled Synthesis report on the aggregate effect of intended nationally determined contributions. The UNFCCC have updated the graphics since. Figure 2 of 27 Apr 2016 shows the total GHG emissions, which were about 17 Gt higher than the CO2 emissions from energy emissions in 2010.

The graphic clearly shows that the INDCs – many with very vague and non-verifiable targets – will make very little difference to the non-policy emissions path. Yet even this small impact is contingent on those submissions being implemented in full, which is unlikely in many countries. The 2°C target requires global emissions to peak in 2016 and then head downwards. There are no additional policies even being tabled to achieve this, except possibly by some noisy, but inconsequential, activist groups. Returning to the EIA’s report, figure 9.4 splits the CO2 emissions between the OECD and non-OECD countries.

The OECD countries represent nearly all countries who propose to reduce their CO2 emissions on the baseline 1990 level, but their emissions are forecast by the EIA still to be 19% higher in 2040. However, the increase is small compared to the non-OECD countries – who mostly are either proposing to constrain emissions growth or have no emissions policy proposals – with emissions forecast to treble in fifty years. As a result the global forecast is for CO2 emissions to double. Even if all the OECD countries completely eliminate CO2 emissions by 2040, global emissions will still be a third higher than in 1990. As the rapid economic growth in the former Third World reduces global income inequalities, it is also reducing the inequalities in fossil fuel consumption in energy production. This will continue beyond 2040 when the OECD with a sixth of the world population will still produce a third of global CO2 emissions.

Unless the major emerging economies peak their emissions in the next few years, then reduce the emissions rapidly thereafter, the emissions target allegedly representing 2°C or less of global warming by 2100 will not be met. But for countries like India, Vietnam, Indonesia, Bangladesh, Nigeria, and Ethiopia to do so, with the consequent impact on economic growth, is morally indefensible.

Kevin Marshall