The Policy Gap in Achieving the Emissions Goals

The Millar et al. 2017 has severe problems with the numbers, as my previous post suggested. But there is a more fundamental problem in achieving emissions goals. It is contained in the introductory paragraphs to an article lead author Richard Millar posted at Carbon Brief

The Paris Agreement set a long-term goal of limiting global warming to “well-below” 2C above pre-industrial levels and to pursue efforts to restrict it to 1.5C.

A key question for the upcoming rounds of the international climate negotiations, particularly when countries review their climate commitments next year, is exactly how fast would we have to cut emissions to reach these goals?

In a new paper, published in Nature Geoscience, we provide updated estimates of the remaining “carbon budget” for 1.5C. This is the total amount of CO2 emissions that we can still emit whilst limiting global average warming to 1.5C.

Our estimates suggest that we would have a remaining carbon budget equivalent to around 20 years at current emissions rates for a 2-in-3 chance of restricting end-of-century warming to below 1.5C.

This suggests that we have a little more breathing space than previously thought to achieve the 1.5C limit. However, although 1.5C is not yet a geophysical impossibility, it remains a very difficult policy challenge.

The problem is with the mixing of singular and plural statements. The third paragraph shows the problem.

In a new paper, published in Nature Geoscience, we provide updated estimates of the remaining “carbon budget” for 1.5C. This is the total amount of CO2 emissions that we can still emit whilst limiting global average warming to 1.5C.

In the first sentence, the collective “we” refers to the ten authors of the paper. That is Richard J. Millar, Jan S. Fuglestvedt, Pierre Friedlingstein, Joeri Rogelj, Michael J. Grubb, H. Damon Matthews, Ragnhild B. Skeie, Piers M. Forster, David J. Frame & Myles R. Allen.  In the second sentence, the collective “we” refers to approximately 7500 million people on the planet, who live about 195 countries. Do they speak for all the people in Russia, India, Nigeria, Iran, Iraq, China, Taiwan, North and South Korea, the United States and Australia for instance? What I would suggest is they are speaking figuratively about what they believe the world ought to be doing.

Yet the political realities are that even though most countries have signed the Paris Agreement, it does not commit them to a particular emissions pathway, nor to eliminate their emissions by a particular date. It only commits them to produce further INDC submissions every five years, along with attending meetings and making the right noises. Their INDC submissions are not scrutinized, still less sent back for “improved ambition” if they are inadequate in contributing to the aggregate global plan.

Looking at the substance of the Adoption proposal of the Paris Agreement, section II, point 17 notes gives an indication of the policy gap.

17. Notes with concern that the estimated aggregate greenhouse gas emission levels in 2025 and 2030 resulting from the intended nationally determined contributions do not fall within least-cost 2 ˚C scenarios but rather lead to a projected level of 55 gigatonnes in 2030, and also notes that much greater emission reduction efforts will be required than those associated with the intended nationally determined contributions in order to hold the increase in the global average temperature to below 2 ˚C above pre-industrial levels by reducing emissions to 40 gigatonnes or to 1.5 ˚C above pre-industrial levels by reducing to a level to be identified in the special report referred to in paragraph 21 below;

But the actual scale of the gap is best seen from the centerpiece graphic of the UNFCCC Synthesis report on the aggregate effect of INDCs, prepared in the run-up to COP21 Paris. Note that this website also has all the INDC submissions in three large Pdf files.

The graphic I have updated with estimates of the policy gap with my take on revised Millar et. al 2017 policy gaps shown by red arrows.

The extent of the arrows could be debated, but will not alter the fact that Millar et. al 2017 are assuming that by adjusting the figures and assuming that they are thinking for the whole world, that the emissions objectives will be achieved. The reality is that very few countries have committed to reducing their emissions by anything like an amount consistent with even a 2°C pathway. Further, that commitment is just until 2030, not for the 70 years beyond that. There is no legally-binding commitment in the Paris Agreement for a country to reduce emissions to zero sometime before the end of the century. Further, a number of countries (including Nigeria, Togo, Saudi Arabia, Turkmenistan, Iraq and Syria) have not signed the Paris Agreement – and the United States has given notification of coming out of the Agreement. Barring huge amounts of funding or some technological miracle most developing countries, with a majority of the world population, will go on increasing their emissions for decades. This includes most of the countries who were Non-Annex Developing Countries to the 1992 Rio Declaration. Collectively they accounted for just over 100% of the global GHG emissions growth between 1990 and  2012.

As some of these Countries’ INDC Submissions clearly state, most will not sacrifice economic growth and the expectations of their people’s for the unproven dogma of politicalized academic activists in completely different cultures say that the world ought to cut emissions. They will attend climate conferences and be seen to be on a world stage, then sign meaningless agreements afterward that commit them to nothing.

As a consequence, if catastrophic anthropogenic global warming is true (like the fairies at the bottom of the garden) and climate mitigation reduction targets are achieved, the catastrophic climate change will be only slightly less catastrophic and the most extreme climate mitigation countries will be a good deal poorer. The non-policy countries will the ones better off. It is the classic free-rider problem, which results in an underprovision of those goods or services. If AGW is somewhat milder, then even these countries will be no worse off.

This is what really irritates me. I live in Britain, where the Climate Change Act 2008 has probably the most ludicrous targets in the world. That Act was meant to lead the world on climate change. The then Environment Secretary David Miliband introduced the bill with this message in March 2007.

From the graphic above COP21 Paris showed that most of the world is not following Britain’s lead. But the “climate scientists” are so stuck in their manipulated models, they forget that their models and beliefs of their peers are not the realities of the wider world. The political realities mean that reduction of CO2 emissions are net harmful to the people of Britain, both now and for future generations of Britains. The activists are just as wilfully negligent in shutting down any independent review of policy as a pharmaceutical company who would push one of its products onto the consumers without an independent evaluation of both the benefits and potential side effects.

Kevin Marshall

Nature tacitly admits the IPCC AR5 was wrong on Global Warming

There has been a lot of comment on a recent paper at nature geoscience “Emission budgets and pathways consistent with limiting warming to 1.5C” (hereafter Millar et. al 2017)

When making a case for public policy I believe that something akin to a process of due diligence should be carried out on the claims. That is the justifications ought to be scrutinized to validate the claims. With Millar et. al 2017, there are a number of issues with the make-up of the claims that (a) warming of 1.5C or greater will be achieved without policy (b) constraining the emissions  

The baseline warming

The introduction states
Average temperatures for the 2010s are currently 0.87°C above 1861–80,

A similar quote from UNIPCC AR5 WG1 SPM page 5

The total increase between the average of the 1850–1900 period and the 2003–2012 period is 0.78 [0.72 to 0.85] °C, based on the single longest dataset available.

These figures are all from the HADCRUT4 dataset. There are three areas to account for the difference of 0.09°C. Mostly it is the shorter baseline period. Also, the last three years have been influenced by a powerful and natural El-Nino, along with the IPCC using an average of the last 10 years.

The warming in the pipeline

There are valid reasons for the authors differing from the IPCC’s methodology. They start with the emissions from 1870 (even though emissions estimates go back to 1850). Also, if there is no definite finish date, it is very difficult to calculate the warming impact to date. Consider first the full sentence quoted above.

Average temperatures for the 2010s are currently 0.87°C above 1861–80, which would rise to 0.93°C should they remain at 2015 levels for the remainder of the decade.

This implies that there is some warming to come through from the impact of the higher greenhouse gas levels. This seems to be a remarkably low and over a very short time period. Of course, not all the warming since the mid-nineteenth century is from anthropogenic greenhouse gas emissions. The anthropogenic element is just guesstimated. This is show in AR5 WG1 Ch10 Page 869

More than half of the observed increase in global mean surface temperature (GMST) from 1951 to 2010 is very likely due to the observed anthropogenic increase in greenhouse gas (GHG) concentrations.

It was after 1950 when the rate largest increase in CO2 levels was experienced. From 1870 to 1950, CO2 levels rose from around 290ppm to 310ppm or 7%. From 1950 to 2010, CO2 levels rose from around 310ppm to 387ppm or 25%. Add in other GHG gases and there the human-caused warming should be 3-4 times greater in the later period than the earlier one, whereas the warming in the later period was just over twice the amount. Therefore if there is just over a 90% chance (very likely in IPCC speak) of over 50% of the warming post-1950 was human-caused, a statistical test relating to a period more than twice as long would have a lower human-caused element of the warming as being statistically significant. Even then, I view the greater than 50% statistic as being deeply flawed. Especially when post-2000, when the rate of rise in CO2 levels accelerated, whilst the rise in average temperatures dramatically slowed. There are two things that this suggests. First, the impact could be explained by rising GHG emissions being a minor element in temperature rise, with natural factors both causing some of the warming in the 1976-1998 period, then reversing, causing cooling, in the last few years. Second is that there is a darn funny lagged response of rising GHGs (especially CO2) to rises in temperature. That is the amount of warming in the pipeline has increased dramatically. If either idea has any traction then the implied warming to come of just 0.06°is a false estimate. This needs to be elaborated.

Climate Sensitivity

If a doubling of CO2 leads to 3.00°C of warming (the assumption of the IPCC in their emissions calculations), then a rise in CO2 levels from 290ppm to 398 ppm (1870 to 2014) eventually gives 1.37°C of warming. With other GHGs this figure should be around 1.80°C. Half that warming has actually occurred, and some of that is natural. So there is well over 1.0°C still to emerge. It is too late to talk about constraining warming to 1.5°C as the cause of that warming has already occurred.

The implication from the paper in claiming that 0.94°C will result from human emissions in the period 1870-2014 is to reduce the climate sensitivity estimate to around 2.0°C for a doubling of CO2, if only CO2 is considered, or around 1.5°C for a doubling of CO2, if all GHGs are taken into account. (See below) Compare this to AR5 WG1 section D.2 Quantification of Climate System Responses

The equilibrium climate sensitivity quantifies the response of the climate system to constant radiative forcing on multicentury time scales. It is defined as the change in global mean surface temperature at equilibrium that is caused by a doubling of the atmospheric CO2 concentration. Equilibrium climate sensitivity is likely in the range 1.5°C to 4.5°C (high confidence), extremely unlikely less than 1°C (high confidence), and very unlikely greater than 6°C (medium confidence).

The equilibrium climate sensitivity ECS is at the very bottom of the IPCC’s range and equilibrium climate response is reached in 5-6 years instead of mutlicentury time scales. This on top of the implied assumption that there is no net natural warming between 1870 and 2015.

How much GHG emissions?

With respect to policy, as global warming is caused by human greenhouse gas emissions, to prevent further human-caused warming requires reducing, and possibly eliminating global greenhouse emissions. In conjunction with the publication of the AR5 Synthesis report, the IPCC produced a slide show of the policy case laid out in the three vast reports. It was effectively a short summary of a summary of the synthesis report. Approaching the policy climax at slide 30 of 35:-

Apart from the policy objective in AR5 was to limit warming from 2°C, not 1.5°C, it also mentions the need to constrain GHG emissions, not CO2 emissions. Then slide 33 gives the simple policy simplified position to achieve 2°C of warming.

To the end of 2011 1900 GTCO2e of GHGs was estimated to have been emitted, whilst the estimate is around 1000 GTCO2e could be emitted until the 2°C warming was reached.

The is the highly simplified version. At the other end of the scale, AR5 WG3 Ch6 p431 has a very large table in a very small font to consider a lot of the policy options. It is reproduced below, though the resolution is much poorer than the original.

Note 3 states

For comparison of the cumulative CO2 emissions estimates assessed here with those presented in WGI AR5, an amount of 515 [445 to 585] GtC (1890 [1630 to 2150] GtCO2), was already emitted by 2011 since 1870

The top line is for the 1.5°C of warming – the most ambitious policy aim. Of note:-

  • The CO2 equivalent concentration in 2100 (ppm CO2eq ) is 430-480ppm.
  • Cumulative CO2 emissions (GtCO2) from 2011 to 2100 is 630 to 1180.
  • CO2 concentration in 2100 is 390-435ppm.
  • Peak CO2 equivalent concentration is 465-530ppm. This is higher than the 2100 concentration and if for CO2 alone with ECS = 3 would eventually produce 2.0°C to 2.6°C of warming.
  • The Probability of Exceeding 1.5 °C in 2100 is 49-86%. They had to squeeze really hard to say that 1.5°C was more than 50% likely.

Compare the above to this from the abstract of Millar et. al 2017.

If COemissions are continuously adjusted over time to limit 2100 warming to 1.5C, with ambitious non-COmitigation, net future cumulativCOemissions are unlikely to prove less than 250 GtC and unlikely greater than 540 GtC. Hence, limiting warming to 1.5C is not yet a geophysical impossibility, but is likely to require delivery on strengthened pledges for 2030 followed by challengingly deep and rapid mitigation.

They use tonnes of carbon as the unit of measure as against CO2 equivalent. The conversion factor is 3.664, so cumulative CO2 emissions need to be 870-1010 GtCO2 range. As this is to the end of 2015, not 2011 as in the IPCC report, it will be different. Subtracting 150 from the IPCC reports figures would give a range of 480 to 1030. That is, Millar et. al 2017 have reduced the emissions range by 75% to the top end of the IPCC’s range. Given the IPCC considered a range of 1.5-1.7°C of warming, this seems somewhat odd to then say it related to the lower end of the warming band, until you take into account that ECS has been reduced. But then why curtail the range of emissions instead calculating your own? It appears that again the authors are trying to squeeze a result within existing constraints.

However, this does not take into account the much higher levels of peak CO2 equivalent concentrations in table 6.3. Peak CO2 concentrations are around 75-95ppm higher than in 2100. Compare this to the green line in the central graph in Millar et. al 2017. 

 This is less than 50ppm higher than in 2100. Further in 2100 Millar et. al 2017 has CO2 levels of around 500ppm as against a mid-point of 410 in AR5. CO2 rising from 290 to 410ppm with ECS = 3.0 produced 1.50°C of warming. CO2 rising from 290 to 410ppm with ECS = 2.0 produced 1.51°C of warming. Further, this does not include the warming impact of other GHGs. To squeeze into the 1.5°C band, the mid-century overshoot in Millar et. al 2017 is much less than in AR5. This might be required in the modeling assumptions due to the very short time assumed in reaching full equilibrium climate response.

Are the authors playing games?

The figures do not appear to stack up. But then they appear to be playing around with figures, indicated by a statement in the explanation of Figure 2

Like other simple climate models, this lacks an explicit physical link between oceanic heat and carbon uptake. It allows a global feedback between temperature and carbon uptake from the atmosphere, but no direct link with net deforestation. It also treats all forcing agents equally, in the sense that a single set of climate response parameters is used in for all forcing components, despite some evidence of component-specific responses. We do not, however, attempt to calibrate the model directly against observations, using it instead to explore the implications of ranges of uncertainty in emissions, and forcing and response derived directly from the IPCC-AR5, which are derived from multiple lines of evidence and, importantly, do not depend directly on the anomalously cool temperatures observed around 2010.

That is:-

  • The model does not consider an “explicit physical link between oceanic heat and carbon uptake.” The IPCC estimated that over 90% of heat accumulation since 1970 was in the oceans. If the oceans were to belch out some of this heat at a random point in the future the 1.5°C limit will be exceeded.
  • No attempt has been made to “calibrate the model directly against observations”. Therefore there is no attempt to properly reconcile beliefs to the real world.
  • The “multiple lines of evidence” in IPCC-AR5 does not include a glaring anomaly that potentially falsifies the theory and therefore any “need” for policy at all. That is the divergence in actual temperatures trends from theory in this century.

Conclusions

The authors of Millar et. al 2017 have pushed out the boundaries to continue to support climate mitigation policies. To justify constraining emissions sufficient stop 1.5°C of warming the authors would appear to have

  • Assumed that all the warming since 1870 is caused by anthropogenic GHG emissions when there is not even a valid statistical test that confirms even half the warming was from this source.
  • Largely ignored any hidden heat or other long-term response to rises in GHGs.
  • Ignored the divergence between model predictions and actual temperature anomalies since around the turn of the century. This has two consequences. First, the evidence appears to strongly contradict the belief that humans are a major source of global warming and by implication dangerous climate change. Second, if it does not contradict the theory, suggests the amount of warming in the pipeline consequential on human GHG emissions has massively increased. Thus the 1.5°C warming could be breached anyway.
  • Made ECS as low as possible in the long-standing 1.5°C to 4.5°C range. Even assuming ECS is at the mid-point of the range for policy (as the IPCC has done in all its reports) means that warming will breach the 1.5°C level without any further emissions. 

The authors live in their closed academic world of models and shared beliefs. Yet the paper is being used for the continued support of mitigation policy that is both failing to get anywhere close to achieving the objectives and is massively net harmful in any countries that apply it, whether financially or politically.

Kevin Marshall

Commentary at Cliscep, Jo Nova, Daily Caller, Independent, The GWPF

Update 25/09/17 to improve formatting.

The Inferior Methods in Supran and Oreskes 2017

In the previous post I looked at one aspect of the article Assessing ExxonMobil’s Climate Change Communications (1977–2014) by Geoffrey Supran and Naomi Oreskes. I concluded the basis for evaluation of ExxonMobil’s sponsored climate papers – “AGW is real, human-caused, serious, and solvable” –  is a mantra held by people who fail to distinguish between empirical and verifiable statements, tautologies, opinions and public policy that requires some fanciful global political implementation. In this post I look at how the application of that mantra in analyzing journal articles can lead to grossly misleading interpretations.

Under Section 2. Method, in Table 2 the authors lay out their criteria evaluation in terms of how the wording supports (endorses) or doubts elements of the mantra. For AGW is real & human-caused there are quite complex criteria. But for whether it is “serious” and “solvable” they are much more straightforward, and I have reproduced them below.

The acknowledgment or doubt of “AGW as serious” or “AGW as solvable” are in relation to the mantra. That is the only criteria used. Supran and Oreskes would claim that this does not matter. What they are looking at is the positions communicated in the papers relative to the positions expressed by ExxonMobil externally. But there are problems with this methodology in terms of alternative perspectives that are missing.

First is that the underlying quality and clarity of results and relevancy of each paper is ignored. What matters to Supran and Oreskes is the language used.

Second is that ExxonMobil’s papers are not the only research on whether “AGW is real, human-caused, serious, and solvable”. The authors could also take into account the much wider body of papers out there within the broad areas covered by the mantra.

Third, if the totality of the research – whether ExxonMobil’s or the totality of climate research – does not amount to a strong case for anthropogenic global warming being a serious global problem, and nor having a workable solution, why should they promote politicized delusions?

Put this into the context of ExxonMobil – one of the World’s most successful businesses over decades – by applying some of the likely that it would use in assessing a major project or major strategic investment. For instance

  • How good is the evidence that there is a serious problem on a global scale emerging from human GHG emissions?
  • How strong is the evidence that humans have caused the recent warming?
  • Given many years of research, what is the track record of improving the quality and refinement of the output in the climate area?
  • What quality controls and KPIs are in place to enable both internal and external auditors to validate the work?
  • Where projections are made, what checks on the robustness of those projections have been done?
  • Where economic projections are produced, have they been done by competent mainstream economists, what are the assumptions made, and what sensitivity analyses have been done on those assumptions?
  • Does the project potentially harm investors, employees, customers and other stakeholders in the business? Where are the risk assessments of such potential harms, along with the procedures for the reporting and investigation of non-compliances?
  • Does a proposed project risk contravening laws and internal procedures relating to bribery and corruption?
  • Once a project is started, is it possible to amend that project over time or even abandon it should it fail to deliver? What are the contractual clauses that enable project amendment or abandonment and the potential costs of doing so?

Conclusions and further thoughts

Supran and Oreskes evaluate the ExxonMobil articles for AGW and policy in terms of a belief mantra applied to a small subset of the literature on the subject. Each article is looked at independently of all other articles; all other available information; and all other contexts in evaluating the information. This includes ignoring how a successful business evaluates and challenges information in strategic decision-making. Further any legitimate argument or evidence that undermines the mantra is evidence of doubt. It is all about throwing the onus on ExxonMobil to disprove the allegations, but never for Supran and Oreskes justify their mantra or their method of analysis is valid.

There are some questions arising from this, that I hope to pursue in later posts.

1. Is the method of analysis just a means of exposing ExxonMobil’s supposed hypocrisy by statistical means, or does it stem from a deeply flawed and ideological way of perceiving the world, that includes trying to shut out the wider realities of the real world, basic logic and other competing (and possibly superior) perspectives?

2. Whatever spread of misinformation and general hypocrisy might be shown on the part of ExxonMobil from more objective and professional perspectives, is there not greater misinformation sown by the promoters of the “climate consensus“?

3. Can any part of the mantra “AGW is real, human-caused, serious, and solvable” be shown to be false in the real world, beyond reasonable doubt?

Kevin Marshall


Supran and Oreskes on ExxonMobils Communication of Climate Change

Over at Cliscep, Geoff Chambers gave a rather bitter review (with foul language) about a new paper, Assessing ExxonMobil’s Climate Change Communications (1977–2014) by Geoffrey Supran and Naomi Oreskes.
One point that I would like to explore is part of a quote Geoff uses:-

The issue at stake is whether the corporation misled consumers, shareholders and/or the general public by making public statements that cast doubt on climate science and its implications, and which were at odds with available scientific information and with what the company knew. We stress that the question is not whether ExxonMobil ‘suppressed climate change research,’ but rather how they communicated about it.

It is the communication of climate science by a very powerful oil company, that the paper concentrates upon. The approach reveals a lot about the Climate Change movement as well. In particular, this statement in the introduction:-

Research has shown that four key points of understanding about AGW—that it is real, human-caused, serious, and solvable—are important predictors of the public’s perceived issue seriousness, affective issue involvement, support for climate policies, and political activism [62–66].

The references are as follows

[62] Krosnick J A, Holbrook A L, Lowe L and Visser P S 2006 The origins and consequences of democratic citizens’ policy agendas: a study of popular concern about global warming Clim. Change 77 7–43
[63] Ding D, Maibach E W, Zhao X, Roser-Renouf C and Leiserowitz A 2011 Support for climate policy and societal action are linked to perceptions about scientific agreement Nat. Clim. Change 1 462–6
[64] Roser-Renouf C, Maibach E W, Leiserowitz A and Zhao X 2014 The genesis of climate change activism: from key beliefs to political action Clim. Change 125 163–78
[65] Roser-Renouf C, Atkinson L, Maibach E and Leiserowitz A 2016 The consumer as climate activist Int. J. Commun. 10 4759–83
[66] van der Linden S L, Leiserowitz A A, Feinberg G D and Maibach E W 2015 The scientific consensus on climate change as a gateway belief: experimental evidence PLoS One 10 e0118489

For the purposes of Supran and Oreskes study, the understanding that people have of any issue does not require any substance at all beyond their beliefs. For instance, the Jehovah Witness Sect developing an “understanding” that Armageddon would occur in 1975. This certainly affected their activities in the lead up to the momentous history-ending event. Non-believers or members of the Christian Church may have been a little worried, shrugged their shoulders, or even thought the whole idea ridiculous. If similar studies to those on climate activism had been conducted on the prophecy of Armageddon 1975, similar results could have been found to those quoted for AGW beliefs in references 62-66. That is, the stronger the belief in the cause, whether religious evangelism in the case of Jehovah’s Witnesses or ideological environmentalism in the case of AGW, is a predictor of activism in support of the cause. They cannot go further because of an issue with scholarly articles. Claims made must be substantiated, something that cannot be done with respect to the prophecies of climate catastrophism, except in a highly nuanced form.
But the statement that AGW is “real, human-caused, serious, and solvable” – repeated five times in the article – indicates something about the activists understanding of complex issues.
AGW is real” is not a proper scientific statement, as it is not quantified. Given that the impacts on surface temperatures can muffled and delayed nearly indefinitely by natural factors, or swallowed by the oceans, the belief can be independent of any contrary evidence for decades to come.
AGW is human-caused”, is saying “Human-caused global warming is human-caused”. It is a tautology that tells us nothing about the real world.
AGW is serious” is an opinion. It may be a very widely-held opinion, with many articles written with confirming evidence, and many concerned people attending massive conferences where it is discussed. But without clear evidence for emerging net adverse consequences, the opinion is largely unsubstantiated.
AGW is solvable” could be whether it is theoretically solvable, given the technology and policies being implemented. But the statement also includes whether it is politically solvable, getting actual policies to reduce emissions fully implemented. If the “solution” is the reduction of global emissions to a level commensurate with 2C of warming (hence a partial solution), then COP21 in Paris shows that AGW is a long way from being solvable, with no actual solution in sight. Whereas the 2C limit requires global emissions to be lower in 2030 than in 2015, and falling rapidly, fully implemented policies would still see emissions higher in 2030 than in 2015 and still increasing.

The statement AGW is “real, human-caused, serious, and solvable” is, therefore, nothing more than a mantra held by people who fail to distinguish between empirical and verifiable statements, tautologies, opinions and public policy that requires some fanciful global political implementation. 

Kevin Marshall

The Morning Star’s denial of the Venezuelan Dictatorship

Guido Fawkes has an excellent example of the hard left’s denial of realities that conflict with their beliefs. From the Daily Politics, this is Morning Star editor Ben Chacko saying that the UN Human Rights Watch report on Venezuela was one-sided.

The Human Rights report can be found here.

The recent demonstrations need to be put into context. There are two contexts that can be drawn upon. The Socialist Side (with which many Socialists will disagree) is from Morning Star’s piece of 25th August The Bolivarian Revolution hangs in the balance.

They say

One of the world’s largest producers of oil, on which 95 per cent of its economy depends, the Bolivarian socialist government of Venezuela has, over the last 17 years, used its oil revenues to cut poverty by half and reduce extreme poverty to 5.4 per cent.

The government has built social housing; boosted literacy; provided free healthcare and free education from primary school to universities and introduced arts, music and cultural analysis programmes and many others targeting specific problems at the local level.

This is sentance emphasises the hard-left bias.

The mainly middle-class protesters, most without jobs and income, accused President Nicolas Maduro of dictatorship and continued with their daily demonstrations and demands for a change of government. 

Folks without “jobs or income” are hardly middle-class, but might be former middle-class. They have been laid low by circumstances. Should they be blaming the Government or forces outside the Government’s control?


From Capx.co on 16th August – Socialism – not oil prices – is to blame for Venezuela’s woes. Also from upi.com on 17th February – Venezuela: 75% of the population lost 19 pounds amid crisis. This is the classic tale of socialism’s failure.

  • Government control of food supplies leads to shortages, which leads to rationing, which leads to more shortages and black market profiteering. This started in 2007 when oil prices were high, but not yet at the record high.
  • Inflation is rampant, potentially rising from 720% in 2016 to 1600% this year. This is one of the highest rates in the world.
  • The weight loss is due to food shortages. It is the poorest who suffer the most, though most of the population are in extreme poverty.
  • An oil-based economy needs to diversify. Venezuela has not. It needs to use high oil prices to invest in infrastructure. Instead, the Chavez regime expropriated the oil production from successful private companies and handed to Government Cronies. A graphic from Forbes illustrates the problem.

About a decade ago at the height of the oil price boom, Venezuela’s known oil reserves more than tripled, yet production fell. It now has the highest oil reserves of any country in the world.

  • Crime has soared, whilst people are going hungry.
  • Maybe a million children are missing school through hunger and lack of resources to run schools. Short-run “successes” based on expropriating the wealth of others have reversed to create a situation far worse than before Chavez came to power.
  • Oil prices are in real terms above the level they were from 1986 to 2003 (with the exception of a peak for the first Gulf War) and comparable to the peak reached in 1973 with the setting up of the OPEC Cartel and oil embargo.

The reality is that Socialism always fails. But there is always a hardcore always in denial, always coming up with empty excuses for failure, often blaming it on others. With the rise of Jeremy Corbyn (who receives a copy of the Morning Star daily), this hardcore has have taken over the Labour Party. The example of Venezuela indicates the long-term consequences of their attaining power.

Kevin Marshall

New EU Vacuum Cleaner Regulations likely promoted with false claims

Summary

On September 1st, the EU Commission launched new regulations limiting the maximum power of vacuum cleaners to 900 watts.  A news item claimed

The updated rules will result in vacuum cleaners that use less energy for a better cleaning performance. This will help consumers to save money, as switching to a more efficient product can save €70 over its lifetime.

Elsewhere the is a claim that “with more efficient vacuum cleaners, Europe as a whole can save up to 20 TWh of electricity per year by 2020.

There is no reference to the source of the claims. Pulling in data from various sources I have calculated how the figures may have been derived. Based on these figures it would appear

  • The assumed savings are 200 kWh per vacuum cleaner, based on switching from a 1600 watts to a 900 watts, and 290 hours of use over the average lifetime.
  • This ignores that many vacuum cleaners are below 1600 watts due competition, not rules in place.
  • Cost savings are based on the average electricity costs in the EU, when in reality electricity costs in the most expensive country are 2.6 times that of the cheapest.
  •  Cost savings are not net of cost increases, such as more time spent cleaning and increase costs of the appliance.
  • Claims of reduction in electricity consumption are based on the requirement that all 350 million vacuum cleaners of 1600 watts are replaced by 900 watt cleaners by the start of 2020.

If any business made bald unsubstantiated claims about a new product, it would be required to back up the claims or withdraw them. Morally, I believe the EU Commission should aspire to emulate the standards that it imposes on others in marketing its own products. A law making Authority cannot be regulated and brought to account for the harms it causes. But I feel that it owes its citizens a moral duty of care to serve them, by minimizing the harms that it can cause and maximising the benefits.

The Launch of the New Regulations

BBC had an article on September 1st Sales of inefficient vacuum cleaners banned

They state

The EU’s own website says: “With more efficient vacuum cleaners, Europe as a whole can save up to 20 TWh of electricity per year by 2020.

“This is equivalent to the annual household electricity consumption of Belgium.

“It also means over 6 million tonnes of CO2 will not be emitted – about the annual emissions of eight medium-sized power plants.”

Although the BBC do not link to the webpage among millions. A search on the phrase reveals the following link.

http://ec.europa.eu/energy/en/topics/energy-efficiency/energy-efficient-products/vacuum-cleaners

Vacuum cleaners are subject to EU energy labelling and ecodesign requirements. By switching to one of the most energy efficient vacuum cleaners, you can save €70 over the lifetime of the product.  With more efficient vacuum cleaners, Europe as a whole can save up to 20 TWh of electricity per year by 2020. This is equivalent to the annual household electricity consumption of Belgium. It also means over 6 million tonnes of CO2 will not be emitted – about the annual emissions of eight medium-sized power plants.

There are no references to where the figures come from.

Another source is much nearer in the menu tree to the EU homepage and is on a news page.

http://ec.europa.eu/energy/en/news/updated-energy-efficiency-rules-vacuum-cleaners-will-save-consumers-money

Updated energy efficiency rules for vacuum cleaners will save consumers money

Friday, 01 September 2017

From today, vacuum cleaners sold in Europe will be more cost- and energy-efficient. The European Commission is making use of the latest state-of-the-art technologies to ensure that European consumers have the most energy efficient products available. The updated ecodesign requirements will lower appliances’ maximum power, annual energy consumption and noise levels. They will also increase their minimum ability to pick up dust.

The updated rules will result in vacuum cleaners that use less energy for a better cleaning performance. This will help consumers to save money, as switching to a more efficient product can save €70 over its lifetime. With more efficient vacuum cleaners, Europe as a whole will be in a position to save up to 20 TWh of electricity per year by 2020.

Like with the first EU source (which this press release links backed to) there is no reference to the source of the claims.

Establishing the calculations behind the claims

However, there the claims that together with other data and some assumptions have enabled me to piece together the numbers behind the claims. These are:-

  1. The maximum of 20 TWh of electricity that could be saved by 2020. There are one billion kilowatt hours in a terawatt hour.
  2. According to Eurostat’s Household Composition Statistics, there are 495.6 million EU citizens living in households, with an average 2.3 persons per household. That is around 215 million or maybe 210 million households.
  3. There is more than one vacuum cleaner in the average household.
  4. All vacuum cleaners are operated at maximum power all the time.
  5. All current vacuum cleaners are 1600 watts. By 2020 they will all be at 900 watts.
  6. Life of the average vacuum cleaner is five years. This I worked out from slotting in other variables.


To understand how many kilowatt hours in the maximum cost saving of €70, one needs to know the cost of a unit of electricity. In a recent post on electricity prices in South Australia, Joanne Nova provided a graphic based on data from MARKINTELL, US Energy Information Administration. Based on this I have produced a graphic showing that if Denmark, where electricity is most expensive, a person saved €70 on their electricity bill, the savings in most of the other EU countries.

If the Danes will save €70 from buying a vacuum cleaner under the new regulations, in the UK the saving will be about €49, France €39 and in Hungary and Estonia just €27. This is because of the huge difference in electricity costs, with Danish electricity being 2.6 times that in Hungary and Estonia. It is a simple step to work out the number of kilowatt hours of electricity saved for a spend of €70.  Assuming $1.00 = €0.85, the next graph shows how many units of electricity will be saved in each country.

If the EU Commission had properly checked its figures, when quoting the maximum saving, will base it on the highest electricity rates in the EU, and not the average rates. They will, therefore, assume that the maximum savings for the EU will be around 133 kilowatt hours and not 200 kilowatt hours. Otherwise, the maximum savings in Denmark, Germany, Italy and Portugal could be greater than the claimed maximum, whilst people in some other countries with lower than average electricity costs will be misled as to the extent of the possible savings.

I have put together a table that fits the assumptions and known variables based on €70 of savings in both Denmark and the fictional EU average.

The 200 kWh saving over a five-year vacuum cleaner life seems more reasonable than 133 kWh. The 350 million vacuum cleaners in the EU or two for every three people, seems more reasonable than 538 million, which is both less of a rounded estimate and would mean around 35 million more vacuum cleaners than people. The assumption that the average household spends 1 hour and 50 minutes per week vacuuming might be a bit high, but there again I know of people who regularly exceed this amount by quite a margin.

Based on how the numbers fit the maximum saving of €70 per vacuum cleaner to have been based on the average cost of electricity in the EU. As such it is an incorrect statement. There are other issues that arise.

Evaluating the claims

There are other issues that arise from consideration of these figures, though are not necessarily solely reliant upon those figures.

First, the 26TW of savings is if all the current vacuum cleaners (assumed to be at 1600W rating) will be replaced by the start of 2020. That is in just 2.33 years. If vacuum cleaners have an average five-year life, many people will be scrapping their existing vacuum cleaners before the end of their useful life. Even with a maximum marginal cost saving of €14 a year, this would mean incurring unnecessary additional costs and throwing out perfectly serviceable vacuum cleaners. However, if they replace a 2000 watt or higher vacuum cleaner purchased prior to September 2014, then the savings will be much higher. In which case the EU Commission News item should have noted that some savings were from regulations already in place.

Second is that many households have an old vacuum cleaner in reserve. They may have it for a number of reasons, such as having upgraded in the past, or purchased it prior to the regulations came into force in 2014. So when their main vacuum cleaner finally keels over, they will not purchase a low powered one. It will be therefore very many years before anything approaching 100% of existing vacuum cleaners have been replaced, especially if the perception is that the newer products are inferior.

Third, is an assumption that every vacuum cleaner is on the limit of the regulations. Greater efficiency (saving money) is something people are willing to pay for, so the market provides this anyway without the need for regulation, just as people pay for more fuel efficient cars. It is only the people who max out on the power permitted that will be affected to the full extent. As greater power is a cheap way of increasing performance, this will most affect the cheapest cleaners. The poor and those setting up a home for the first time (with severe budget constraints) are likely to be those most disadvantaged, whilst those who are willing and able to upgrade to the latest gadgets will make the lowest savings.

Fourth, the cost savings appear to be only on electricity costs. The extra costs of upgrading to a more technologically advanced machine that compensates for the loss of power, does not appear to have been taken into account in the calculations. If it had, then the electricity savings would have to be much greater, to include the additional costs. In which case, the fictional European average household would have to be saving far more on their electricity than €70. Let us say people upgrade from a €100 to €300 machine, both with a five year average life. To make €70 of savings over five years a Danish household would have to be running their vacuum cleaner for nearly three hours a week, a British or Dutch household over four hours per week, and the Hungarian and Estonian households over seven hours a week. But this defies other assumptions and would also shorten the average life of a vacuum cleaner. No allowance appears to have been made for more expensive vacuum cleaners.

Fifth, there are other, simpler ways of replacing the loss of suction from lack of power than technological wizardry that pushes up costs. The simplest is to reduce the area in contact with the floor. This means that people spend more time using the machines, offsetting some of the energy savings. Alternatively, there could be some loss of suction, which again means people spend more time cleaning, and getting frustrated due to the lack of performance. Some of this could be by more frequent swapping of cleaning heads. If you value people’s leisure time at just €5.00 an hour, then over the short five year life of a cleaner (about 290 hours based on 65 minutes a week of use), the average household will “lose” the €70 of electricity savings if they have to spend more than 5% more time cleaning. In reality it will be much more, and many people will feel aggrieved at having a less efficient machine.

Sixth is that the extra power can be used for simpler, proven and more robust technologies. Efficiency savings come about through complex optimisation strategies, reducing the life of cleaners.

So the claim by the EU that people will save money from the new regulations seems to be false for any one of a number of reasons. More likely than not people will be made net worse off by the regulations. Further the alleged benefits from the new regulations in terms of savings in electricity (and hence CO2 emissions) seems to have been grossly exaggerated.

But won’t there be a massive saving in CO2 emissions?  Even if the 6 million tonnes of emissions saved is in the more distant future, it is still a far large number. In terms of a small country like Belgium, it is a large amount. But considered in the context of EU’s INDC submission to the Paris climate talks it is quite small.

The EU and its Member States are committed to a binding target of an at least 40% domestic reduction in greenhouse gases emissions by 2030 compared to 1990,

From the accompanying country brief, the 1990 emissions were 5368 mtCO2e, so a 40% cut is 2147 mtCO2e. In 2012 emissions were 4241 mtCO2e (mostly for non-policy reasons) so there is just 1020 million tonnes to cut. 6 million is just 0.6% of that target.

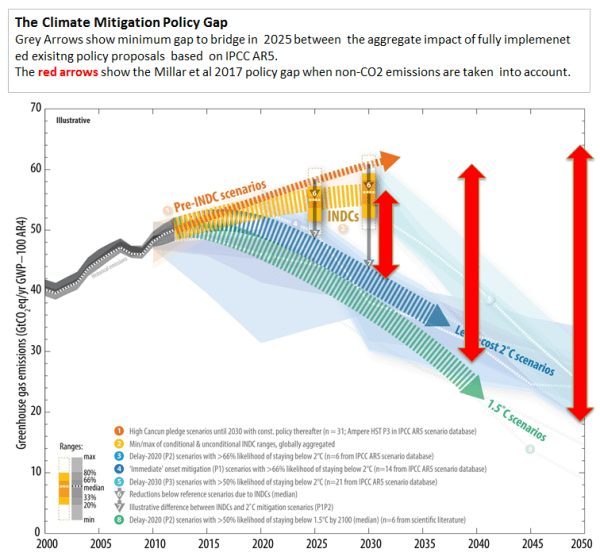
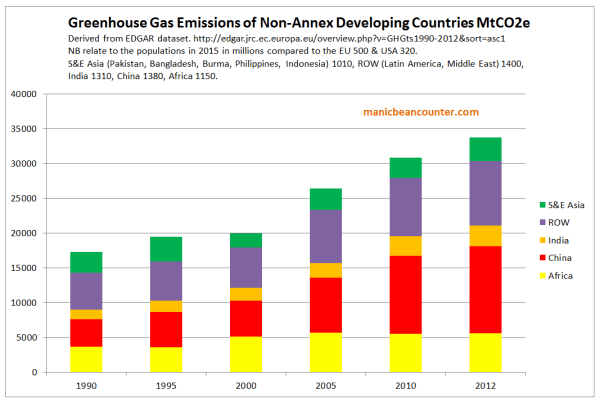
On a global perspective, even with all the vague policy proposals fully enacted, global emissions by 2030 will be nearly 60,000 MtCO2e and will still be rising. There seems no prospect of additional policies being proposed that would start reducing global emissions. A policy that makes around 0.01% of the difference to the larger picture is inconsequential. To achieve the policy goals a few thousand similar-sized schemes are required. Nothing like that is going to happen. Countries in the developing world, with over half the global population, will see emissions will grow for decades, dwarfing any reductions made in the EU.

Concluding comments

The new vacuum cleaner regulations appear to be justified on the basis of grossly exaggerated and untenable claims of the benefits in terms of cost savings and reductions in GHG emissions, whilst ignoring the costs that they impose.

If any business made bald unsubstantiated claims about a new product, it would be required to back up the claims or withdraw them. If such sweeping claims were made about a new product such as anti-aging creams or vitamin pills, that could be attributed to other factors, then it would be prosecuted. Morally, I believe the EU Commission should aspire to emulate the standards that it imposes on others in marketing its own products. A law making Authority cannot be regulated and brought to account for the harms it causes. But I feel that it owes its citizens a moral duty of care to serve them, by minimizing the harms that it can cause and maximising the benefits.

Kevin Marshall