Katabasis offered in the comments at Jo Nova’s blog to provide the raw data for the paper
“NASA faked the moon landing — Therefore (Climate) Science is a Hoax:
An Anatomy of the Motivated Rejection of Science”
Lewandowsky, S., Oberauer, K., & Gignac, C. E. (in press) Psychological Science
I took Katabasis up on the offer. Here are some preliminary results.
Please see DR_UK’s comment below
The CONSENSCO2 question was
Out of 100 climate scientists how many do you think believe that human CO2 emissions cause climate change?
In other words is it a questions about what you believe about what others believe. The comparison should be with the results of the four questions on the respondent’s own beliefs in Climate Science to be found on Page 27 of the paper. The results I hope to post up later today. The sample skew is the similar. 75% of the respondents have strong beliefs in climate science, 14% have weak beliefs and just 11% – 125 respondents – reject the science. I will post later on the revised tables.
Q. Was the sample size sufficient?
Lewandowsky et al 2012 say
We report a survey (N > 1100) of climate blog users to identify the variables underlying acceptance and rejection of climate science.
However they do not state the proportion of respondents on which they based the results – that is those who reject the science. The data summarizes the climate results as “Consensus C02” on a scale of 0 to 100. That is 0 is complete rejection through to 100 as complete acceptance. The CONSENSCO2 question was
Out of 100 climate scientists how many do you think believe that human CO2 emissions cause climate change?
I divided the results into 5 bands to see the skew.
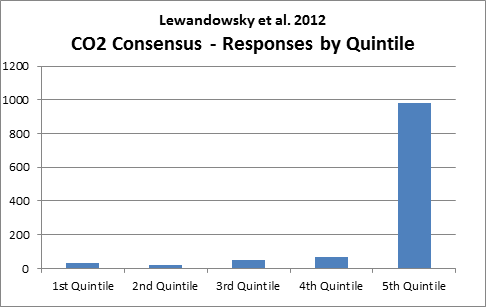
Fully 86% of responses largely accept the C02 consensus respondents believe that the vast majority of climate scientists believe that human CO2 emissions and just 3% (32) strongly reject it. believe that a the vast majority are concealing the truth or lying.
This is not surprising, as the survey was only published on militant alarmist blogs such as SKEPTICALSCIENCE, TAMINO and DELTOID. Jo Nova has so far contacted 24 “skeptic” blogs, not one of whom says they received a request to publish the link to the survey.
Some of the raw results
Some quick pivot tables against the results.
Moon Landings
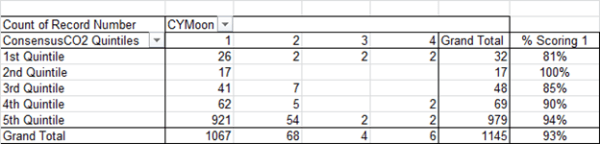
Comment: “Alarmists” are just as much conspiracy theorists as “Skeptics”
JFK Assassination
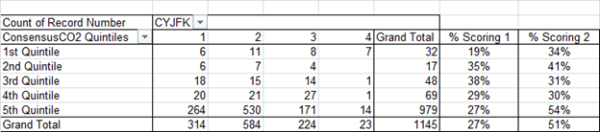
Comment: Not much difference here either between “Alarmists” and “Skeptics”
Martin Luther King Assassination
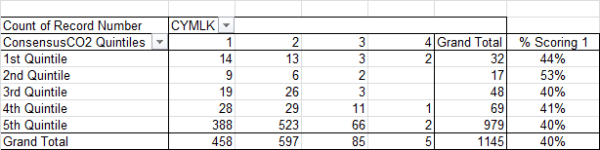
Comment: Not much difference here either between “Alarmists” and “Skeptics”
Diana “Assassination”
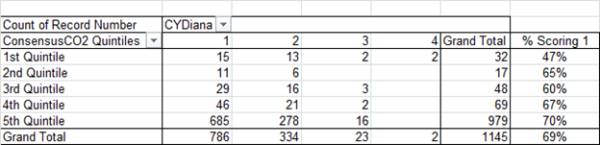
Comment: A slight much difference here between “Alarmists” and “Skeptics” – by 5 or 6 skeptic responses.
9/11 Conspiracies
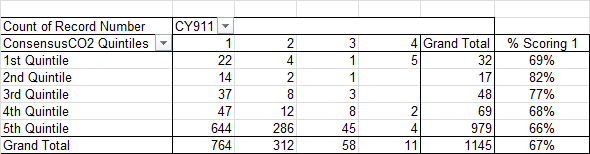
Comment: Not much difference here either between “Alarmists” and “Skeptics”
Pearl Harbour Conspiracies
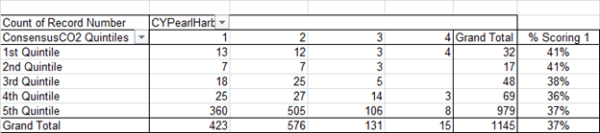
Comment: Not much difference here either between “Alarmists” and “Skeptics”
SARS Conspiracies
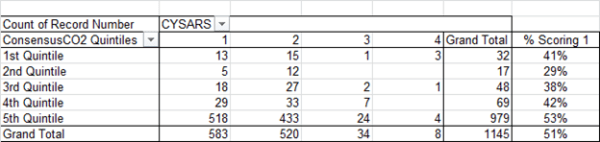
Comment: Not much difference here either between “Alarmists” and “Skeptics”
Preliminary Conclusion
Readers the climate alarmist blogs are full of weird conspiracy theories. Where people that frequent these blogs rate themselves on acceptance of the CO2 Consensus makes little difference to this conclusion. Given that these blogs exist to discourage any views but their own, it is not surprising that their readership:-
- Share a similar, unbalanced, way of evaluating evidence to the blogs authors.
- Are predominantly in agreement with the views promoted.