In the year following the EU Referendum, I wrote a number of posts utilizing Chris Hanretty’s estimates of the vote split by constituency for England and Wales. Hanretty estimates that 421 of the 573 constituencies in England and Wales voted to leave. These estimates were necessary as the vote was counted by different – and mostly larger – areas than the parliamentary constituencies.
Politically, my major conclusion was that it was the Labour Party who could potentially suffer more from Brexit. There are two major reasons for this situation.
First, is that the Labour constituencies had a far greater spread of views than the Conservative constituencies. This is in both the divergence between regions and the disproportionate numbers of constituencies that are were either extreme Remain or extreme Leave in the referendum. Figure 1 is for the result for constituencies with Conservative MPs in 2016, and Figure 2 for constituencies with Labour MPs.

Figure 1: Constituencies in England and Wales with Conservative MPs in 2016, by estimated Leave or Remain Band.
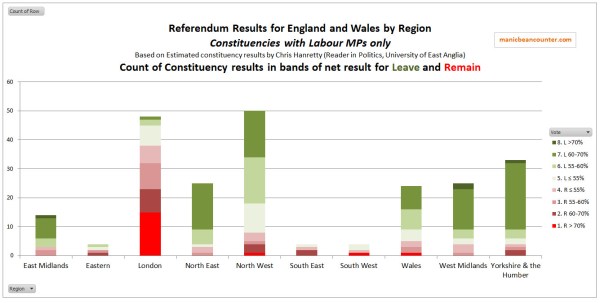
Figure 2: Constituencies in England and Wales with Labour Party MPs in 2016, by estimated Leave or Remain Band.
In particular, London, where much of the current Labour Leadership are based, has views on the EU diametrically opposed views to the regions where most of the traditional Labour vote resides. Further analysis, from July 2016, is here.
Second, is the profile of the Leave supports. Based on an extensive poll conducted by Lord Ashcroft on EU Referendum day, Leave support was especially strong on those retired on a State Pension, council and housing association tenants, those whose formal education did not progress beyond secondary school, and the C2DEs. That is, groups that traditionally disproportionately vote Labour. Further details, from May 2017, are here.
Yet, the results of the snap General Election in June 2017 suggest that it was the Conservatives that suffered from Brexit. Despite their share of the popular vote increasing by over 5%, to the highest share in 25 years, they had a net loss of 13 seats and lost their majority. Labour increased their share of the vote by 10%, but only had a net gain of 30 seats.
Do the positions on Brexit appear to have had an influence? The Conservatives were seeking a stronger mandate for the Brexit negotiations, whilst Labour strongly avoided taken a firm position one way or the other. Chris Hanretty has revised his estimates, with the number of Leave-majority constituencies in England and Wales reduced from 421 to 401. The general picture is unchanged from the previous analysis. I have taken these revised figures, put them into the eight bands used previously and compared to the full election results available from the House of Commons Library.
The main seat results are in Figure 3.
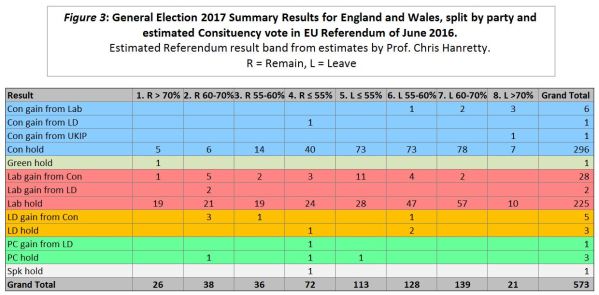
Main points from Figure 3 (for England and Wales) are
- Conservatives had a net loss of 25 seats, 14 of which likely voted Remain in the EU Referendum and 11 likely voted Leave. Remain seats reduced by 18% and Leave seats by 4%.
- All 6 gains from Labour were in strongly Remain constituencies. This includes Copeland, which was gained in a by-election in early 2017 and retained in the General Election.
- Labour had a net gain of 24 seats, 13 of which likely voted Remain in the EU Referendum and 11 likely voted Leave. Remain seats increased by 16% and Leave seats by 7%.
Figure 4 is the average percentage change in the constituency vote from 2015 to 2017 for the Conservative Party.
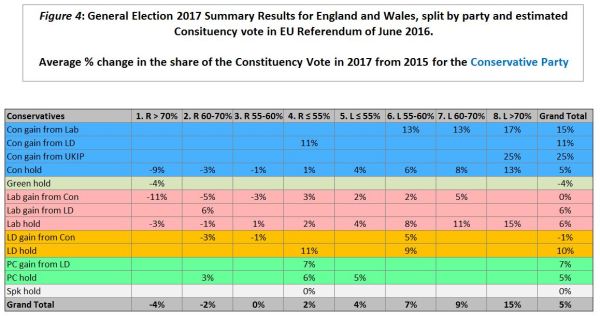
Main point from Figure 4 for the Conservative Party is
- The estimated Referendum vote is a strong predictor of change in Conservative Party vote share from 2015 to 2017 General Election.
Figure 5 is the average percentage change in the constituency vote from 2015 to 2017 for the Labour Party.
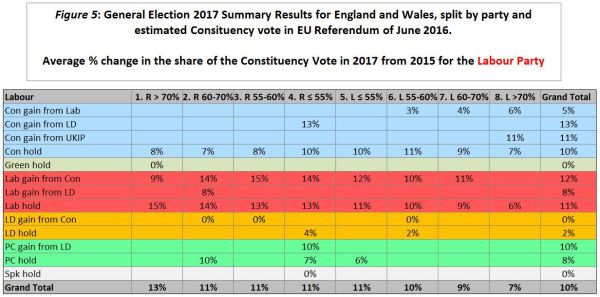
Main points from Figure 5 for the Labour Party are
- Overall average constituency vote share increased by 10% on the 2015 General Election.
- In the 6 seats lost to the Conservatives, Labour’s share of the vote increased.
- In every area, Labour increased its share of the constituency vote with one exception. In the 6 seats that the Liberal Democrats gained from the Conservatives, the Labour share of the vote was on average unchanged. This suggests some tactical voting.
- In Conservative “hold” seats Labour’s increase in vote share did not have a “Remain” bias.
- In Labour “hold” seats Labour’s increase in vote share had a strong “Remain” bias.
In summary, it would appear that the Conservatives in implementing Brexit have mostly suffered at the ballot in Remain areas. Labour, in being the Party of Opposition and avoiding taking a clear position on Brexit, benefited from the Remain support without being deserted by the Leave vote. I will leave it for another day – and for others – to draw out further conclusions.
Kevin Marshall
Update 23rd May
Whilst writing the above, I was unaware of a report produced by political pundit Prof John Curtice last December Has Brexit Reshaped British Politics?
Key findings
In the 2017 election the Conservatives gained support amongst Leave voters but fell back amongst Remain supporters. Labour, in contrast, advanced more strongly amongst Remain than amongst Leave voters.
That is pretty much my own findings by a different method. Both methods can produce different insights. My own approach can give regional analysis.
