How the “greater 50% of warming since 1950 is human caused” claim is deeply flawed

Over at Cliscep, Jaime Jessop has rather jokingly raised a central claim of the IPCC Fifth Assessment Report, after someone on Twitter had accused her of not being a real person.

So here’s the deal: Michael Tobis convinces me, on here, that the IPCC attribution statement is scientifically sound and it is beyond reasonable doubt that more than half of the warming post 1950 is indeed caused by emissions, and I will post a photo verifying my actual existence as a real person.

The Report states (AR5 WG1 Ch10 Page 869)

It is extremely likely that human activities caused more than half of the observed increase in GMST from 1951 to 2010.

This extremely likely is at the 95% confidence interval and includes all human causes. The more specific quote on human greenhouse gas emissions is from page 878, section “10.2.4 Single-Step and Multi-Step Attribution and the Role of the Null Hypothesis

Attribution results are typically expressed in terms of conventional ‘frequentist’ confidence intervals or results of hypothesis tests: when it is reported that the response to anthropogenic GHG increase is very likely greater than half the total observed warming, it means that the null hypothesis that the GHG-induced warming is less than half the total can be rejected with the data available at the 10% significance level.

It is a much more circumspect message than the “<a href=”http://stocker IPCC 2013″ target=”_blank”>human influence on the climate system is clear</a>” announcements of WG1 four years ago.  In describing attribution studies, the section states

Overall conclusions can only be as robust as the least certain link in the multi-step procedure.

There are a number of candidates for “least certain link” in terms of empirical estimates. In general, if the estimates are made with reference to the other estimates, or biased by theory/beliefs, then the statistical test is invalidated. This includes the surface temperature data.

Further, if the models have been optimised to fit the surface temperature data, then the >50% is an absolute maximum, whilst the real figure, based on perfect information, is likely to be less than that.

Most of all are the possibilities of unknown unknowns. For, instance, the suggestion that non-human causes could explain pretty much all the post-1950 warming can be inferred from some paleoclimate studies. This reconstruction Greenland ice core (graphic climate4you) shows warming around as great, or greater, than the current warming in the distant past. The timing of a warm cycle is not too far out either.

In the context of Jaime’s challenge, there is more than reasonable doubt in the IPCC attribution statement, even if a statistical confidence of 90% (GHG emissions) or 95% (all human causes) were acceptable as persuasive evidence.

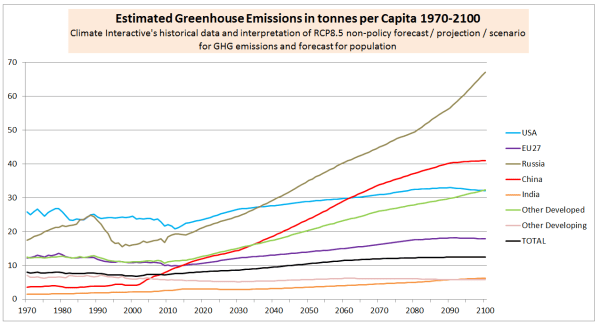
There is a further problem with the statement. Human greenhouse gas emissions are meant to account for all the current warming, not just over 50%. If the full impact of a doubling is CO2 is eventually 3C of warming, then from that the 1960-2010 CO2 rise from 317ppm to 390ppm alone will eventually be 0.9C of warming. Possibly 1.2C of warming from all sources. This graphic from AR5 WG1 Ch10 shows the issues.

The orange line of anthropogenic forcing accounts for nearly 100% of all the measured warming post-1960 of around 0.8C – shown by the large dots. Yet this is about 60% of the warming in from GHG rises if a doubling of CO2 will produce 3C of warming. The issue is with the cluster of dots at the right of the graph, representing the pause, or slow down in warming around the turn of the century. I have produced a couple of charts that illustrate the problem.

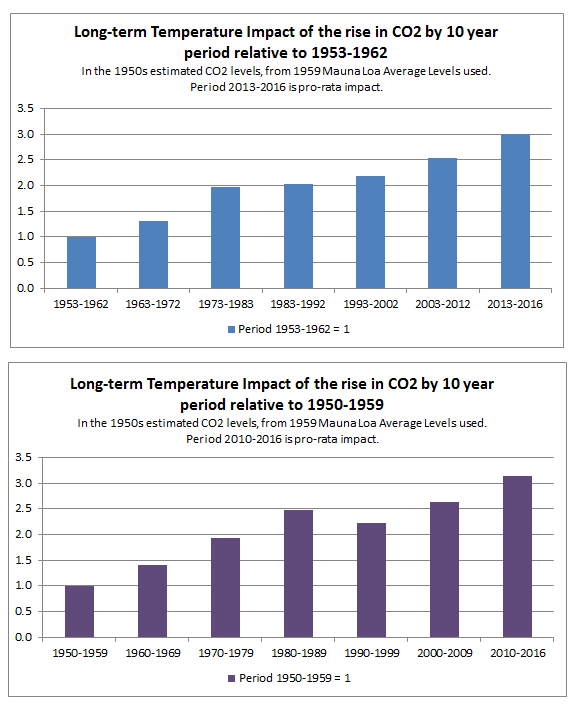
In the first graph, the long term impact on temperatures of the CO2 rise from 2003-2012 is 2.5 times that from 1953-1962. Similarly, from the second graph, the long term impact on temperatures of the CO2 rise from 2000-2009 is 2.6 times that from 1950-1959. It is a darn funny lagged response if the rate of temperature rise can significantly slow down when the alleged dominant element causing them to rise accelerates. It could be explained by rising GHG emissions being a minor element in temperature rise, with natural factors both causing some of the warming in the 1976-1998 period, then reversing, causing cooling, in the last few years.

Kevin Marshall


Forest Trump – stupid is as stupid does

Last Tuesdays’ BBC climate propaganda piece for the day was ‘Donald Trump forest’ climate change project gains momentum,

A campaign to plant trees to compensate for the impact of President Trump’s climate policies has 120,000 pledges.
The project was started by campaigners upset at what they call the president’s “ignorance” on climate science.
Trump Forest allows people either to plant locally or pay for trees in a number of poorer countries.
Mr Trump says staying in the climate pact will damage the US economy, cost jobs and give a competitive advantage to countries such as India and China.
The organisers say they need to plant an area the size of Kentucky to offset the Trump effect.

Trump Forest website (motto Where ignorance grows trees) explains

Breathe easy, Mr President.

 US President Donald Trump doesn’t believe in the science of human-caused climate change. He wants to ignore one of the greatest threats to healthy life on Earth.

Trump wants to bring back coal despite scientists telling us we cannot afford to burn it, and despite economists telling us there’s more money to be made and more jobs available in renewable energy.

So we’re planting a forest to soak up the extra greenhouse gases Trump plans to put into our atmosphere.

We’re planting a global forest to offset Trump’s monumental stupidity.

The claim Trump wants to “bring back coal” or, just to rescind the policies to phase it out, is a question of that can be answered by the empirical evidence. The BP statistical review of World Energy 2016 has estimates of coal consumption by country, measured in millions of barrels of oil equivalent. For the USA I have created a graph.

US coal consumption in 2015 was 31% below the level of 2015, but it is far from being phased out. Further, much of the fall in consumption is primarily down to government policy, but from switching to cleaner and cheaper shale gas. Add the two together in terms of millions of tonnes of oil equivalent, and consumption of the two fossil fuels has hardly changed in 20 years.

Natural Gas is not only cleaner, in terms of far fewer particulates emitted when burnt, it has the added benefit, for climate alarmists, of having around half the CO2 emissions. As a result, net emissions have been falling.

However, global warming is allegedly the result of rising levels of greenhouse gases, which in turn are mostly the result of increasing fossil fuel emissions. How does the falling consumption of coal in the USA compare to the global picture? Again the BP estimates give a fairly clear answer.

In 1965 the USA accounted for 20.8% of global coal consumption, and other rich OECD countries 42.3%. Fifty years later the shares had fallen to 10.3% and 15.2%. Yet the combined OECD consumption had increased by 11%. The lesson from this is that to reduce global GHG emissions requires that developing countries reduce their emissions. China,, which now accounts for just over 50% of global coal consumption, has committed to peak its emissions by 2030. India, whose coal consumption exceeded that is the USA for the first time in 2015, has no such commitment. With a similar population to China, fast economic growth will lead to fairly high rates of increase in coal consumption over the next few years. Into the distant future, the ROW, with around half the global population, are likely to see significant increases in coal consumption.

The switch from coal to shale gas is a major reason why total USA emissions have been falling, as evidenced in this graph from the USA INDC Submission.

The 2025 target is a bit a cheat. Most of the reduction would have been achieved without any policy. In fact, about one third had been achieved by 2013.

Trump Forest have a science page to explain the thinking behind the scheme. It states

If executed in its entirety the Clean Power Plan would prevent approximately 650 million tons of carbon dioxide from reaching the atmosphere over the next 8 years. Along with other actions, including tailpipe regulations (which Trump has also moved to eliminate), the United States was steering toward meeting its target for the Paris Agreement.

Also

The Paris Agreement, negotiated in the French capital in December 2015 was agreed to by over 190 nations. It is the first time the global community has agreed to address climate change by striving to keep the average global temperature increase below 2°C.

So how does the 650mtCO2e over 8 years measure up against those of the global community in the context of “striving to keep the average global temperature increase below 2°C”?

The UNFCCC produced a useful graphic, summarizing all the INDC submissions.


Without the 650mtCO2e claimed reduction from the US Clean Air Plan if fully implemented, global emissions will be just over 1% higher. Rather than global emissions being about 12.5% above the 2°C warming path they might be 14%.  In other words, even if a doubling of CO2 (or equivalent) will lead to 3°C and such warming will have catastrophic consequences (despite the lack of strong, let alone incontrovertible, evidence) the US Clean Air Plan would back no noticeable difference to climate change. using the figures presented by the UNFCCC.

It gets worse. Under the science, Trump Forest have the following graphic, lifted from Climate Interactive.

I have looked at Climate Interactive’s figure before. At least from their figures in December 2015, they claimed that future per capita emissions in the USA would rise without policy, whilst since the 1973 oil crisis per capita emissions had been falling. It was the same with the EU, only their per capita emissions had been falling since 1980. For China and Russia per capita emissions are shown rise through the rough. It is as though without them the guiding hand of the green apostles, Governments will deliberately wastefully burn ever-increasing amounts of fossil fuels. rather than promote the welfare of their nations. This is a graphic I produced from the Climate Interactives C-ROADS software version v4.026v.071 RCP8.5 baseline scenario and the built-in population forecasts.

China is the most globally significant. Despite a forecast decline in population to 1.00 billion in 2100, GHG emissions are forecast to peak at nearly 43GtCO2e by in 2090. That compares with 49GtCO2e from over 7 billion people in 2010. Conversely, non-policy developing countries (who do not want to game-playing ny committing to emissions reductions), are forecast to do disasterously economically and hence have very low emissions growth. That includes India, 50+ African nations, Pakistan, Bangladesh, Philippines, Vietnam, Indonesia, Saudi Arabia, Iran, Iraq etc.

The mere act of countries signing a bit of paper produces most of the drop in emissions. The 650mtCO2e claimed reduction from the US Clean Air Plan if the marginal impact of the policy is taken into account, rather than the difference between an unreasonable forecast and an objective.

It gets worse. The elimination of cheap sources of energy, along with the plethora of regulations, make energy more expensive. Apart from directly harming the living standards of households, this will increase energy costs to business, especially the high energy using industries such as steel, aluminum, and bulk chemicals. US industries will be placed at a competitive disadvantage to their competitors in non-policy emerging economies. Some of the US savings from the policy will be from emissions increases elsewhere. There are no built-in safeguards to stop this happening.

It gets worse. Emerging economies not only have lower labour productivity per unit of output, they also have less efficient use of energy per unit of output. Further, countries like China and India have a larger element of coal in the energy mix than the USA. For these reasons an unintended consequence of reducing emissions in the USA (and other developed countries) through shifting production overseas could be a net increase global emissions. Virtue signaling achieves the opposite of intentions.

However, the real world must not be allowed to confront the anointed in their evangelical zeal to save the world from Donald Trump. They might have to accept that their Virtue signaling are both wrong and if fully implemented will cause great net harm. That would seriously hurt their feelings. Like in the 1994 film Forrest Gump, the lesson is that the really stupid people are not those with naturally low IQs, but those with intelligence who do stupid things. This is what Forest Trump’s backers have achieved.

Like in the 1994 film Forrest Gump, the lesson is that the really stupid people are not those with naturally low IQs, but those with intelligence who do stupid things. This is what Forest Trump’s backers have achieved.

Kevin Marshall