Stoke Central By-Election – Labour’s achievement in statistics

Yesterday’s Parliamentary By-Elections were quite significant. The number of firsts about the result in Copeland have been gone over in fine detail. But in Stoke Central the winning Labour Candidate, Gareth Snell, can point to some records and distinctions that he has achieved. Purely in the interests of balance, I would like to help out. 🙂

Of the 650 MPs currently in the House of Commons, he will have the distinction of being elected on the least votes cast. Snell, in winning with 7853 votes, has removed from bottom place Angus MacNeil, SNP MP for Na h-Eileanan An Iar, who won with just 8662 votes. But this constituency covering the Hebrides has less than half of the Stoke-on-Trent Central electorate. Further, now 94% of sitting MPs are sitting in the House of Commons by virtue of winning with at least twice the numbers votes. In 2015 Tristram Hunt won Stoke Central with just 19.3% of electorate voting for him  – the lowest in England. Gareth Snell MP won with just 14.2% of the electorate voting for him, the lowest in Britain. Bottom place was previously held by Alasdair McDonnell, SDLP MP for Belfast South with 14.7% of the electorate voting for him. But in Belfast South six candidates saved their deposit, and seventh placed UKIP just missed out in getting 4.9% of the votes. In Stoke only four candidates saved their deposit and fifth placed Green candidate only got 1.4% of the vote. Whilst in Belfast South the majority was 2.3% of the votes cast, in Stoke Central it was 12.4%.

Another statistic is to look at the runner-ups in the General Election 2015. 560 of the 650 second-placed candidates received more than Gareth Snell’s 7853 votes. On average in GE 2015 the winners on average received and 23634 and the runners up 12121 votes, respectively 3 times and 1.5 times Snell’s mighty vote count. Although there were just 232 Labour MPs elected in 2015, 506 Labour Candidates received more than 7853 votes than Snell received yesterday. In the constituencies where they stood Labour received on average 14813 votes, nearly twice the votes received to win Stoke Central by a considerable margin. Of the 125 Labour candidates who received less votes than Gareth Snell, only 11 achieved the runner-up slot. The rest were lower-placed.

But this was a by-election, where turnout is usually much lower than at General Elections. Yet here Gareth Snell again sets records. You have to go all the way back to 15 July 2004 to find a winning candidate who won a by-election with less votes. That was Labour candidate Liam Byrne became the MP for Birmingham Hodge Hill with just 7451 votes. There have been 44 by-elections in between. Yet back then on average people won by-elections with smaller number of votes.

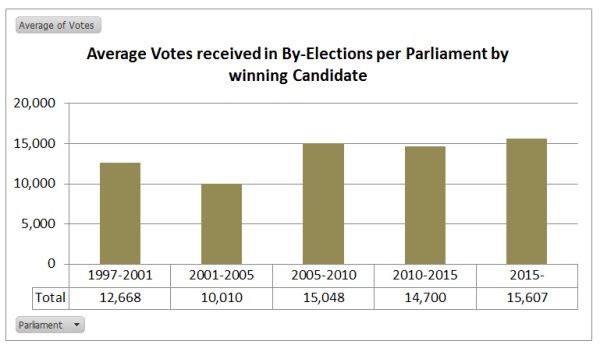
In the current Parliament winning by-election candidates achieve 50% more votes on average than in the 2001-2005 Parliament. It looks like more people turn out to by-elections now, maybe due to more focussed campaigning by the parties, and the greater national significance of the result than when Labour had large majorities in the House of Commons. Maybe it is due to the fact that less people tend to vote in Labour-held seats than for other parties. Below I show the numbers of by-elections held, splitting the winners into Conservative, Labour and Other.

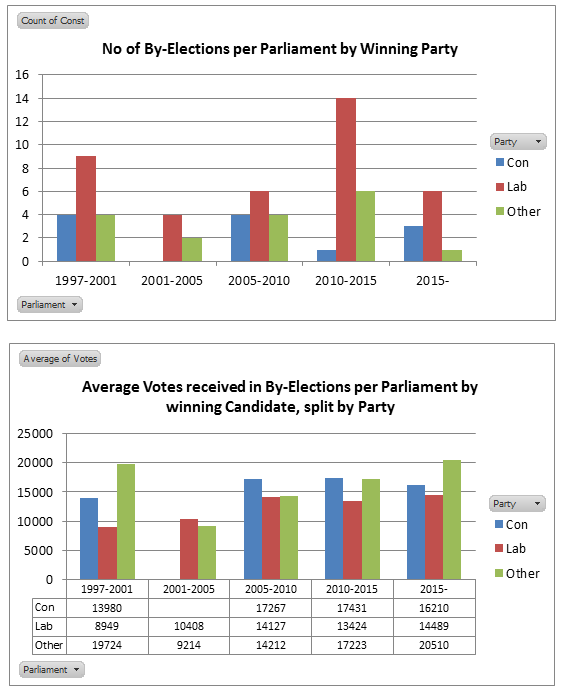
The Labour Party seem to win by-elections with about 40% more votes than they did in 2001-2005.

Data for the 2015 General Election can be derived from http://www.data.parliament.uk/dataset/general-election-2015

Kevin Marshall

Petitions on EU Referendum and Trump State Visit show dominance of Labour Party by London activists

In the UK it is possible to raise a petition to Parliament. If that petition obtains 10,000 signatures, there is a written response from the Government. If there are more than 100,000 signatures, the matter is discussed in Parliament. In less than two years 48 proposals have been discussed in Parliament, with another 14 pending. By far the largest was for EU Referendum Rules triggering a 2nd EU Referendum, which had 4.15 million signatures. It was never going to get far, as it would have meant changing the rules for the referendum vote after the vote had taken place. But it acted as a protest for the substantial and vocal minority who did not like result.

The signatures by constituency are available for download. There are a also non-UK signatures, which I shall ignore. I ranked the signatures by constituency, and divided the 650 constituencies into tenths, or decile groups. The constituencies I then classified by political party of the current MP, giving the graph shown in Figure 1.

Compared to the Conservative constituencies the Labour Party has a few dominant activist constituencies on in terms of wanting to overturn the EU Referendum results, whilst most are far less active. It is even worse if you include the SNP, many of which were Labour constituencies prior to 2015. Figure 2 splits these 231 Labour seats into the 14 regions.

Of the 34 Labour-held seats in the top decile, 27 are in London. The Labour heartlands of the North of England. parts of the Midlands and in Wales are far less activist. Those 27 London constituencies (or 15% of Labour seats) registered 41% of all signatures in Labour seats. 15% of Labour seats registered slightly more signatures than the lowest 140 or 60%. This lines up with the an analysis of the estimated split of the EU Referendum vote I did last year, and shown again as Figure 3.

The Labour seats that most virulently voted remain in the EU that are unsuprisingly the Labour seats with the most signatories who wanted to overturn the democratic result that goes against them. But it in terms of signatories, London-based activists skew the result even more, meaning that within in a political party their views are likely dominant over the those held in the majority of Labour-held seats. As Labour Party members are mostly pro remain, this means that going with party and not will the majority view in the constituencies that they represent.  There is a similarity with attitudes to Donald Trump’s prospective State visit to the UK. A petition against this is Prevent Donald Trump from making a State Visit to the United Kingdom. This currently has 1.85m signatures up from the 1.82m when I downloaded the figures a few days ago. Figure 4 shows the decile groups by political party of the current MP and the Figure 5 shows the split by region of the labour constituencies.

The Labour constituencies dominate even more the top 65 of constituencies by signatories, with the same 27 London constituencies being represented in the top decile. With 15% of Labour seats they registered 32% of all signatures in Labour seats and registered slightly more signatures than the lowest 144 or 62%. A very similar pattern to the EU referendum.

This petition has been countered by Donald Trump should make a State Visit to the United Kingdom. With just 307,000 signatories or one sixth signatories of the Prevent State visit, it might nor seem as relevant. Figure 6 and Figure 7, are from when the signatories were about 275,000.

The Labour constituencies are fairly united in their apathy for wanting a Donald Trump State visit, but are divided in the expressed opposition to a state visit. But are the far greater numbers of the “Stop Trump” signatories reflected in the wider population? YouGov Published an opinion poll on 1st February on the topic. Almost half the sample thought the state visit should go ahead, whilst just over a third thought it should not. In the detail, the poll also divides the country into five regions, with London separated out. Even here, the opinion was 46 to 38% in favour of the Trump state visit. The real problems for Labour are shown in the extract  of the detail in Figure 8 below.


Those who intend to vote Labour now are a smaller group than those who voted Labour in 2015. Proportionately if 30.4% voted Labour in 2015, 25% would do so now. In the unweighted sample, it implies around 70% of the of the 67 lost would support the state visit. The remaining Labour voters are much more against the majority who expressed an opinion than in GE2015. This indicates a party in general decline. That the opinion seems to be centered on London, this indicates the collapse in the Labour vote has in the traditional Labour heartlands of the Midlands, the North and Wales has further to go.

Yet if the visit does go ahead it is the noisy protesters that will come out in their thousands, the majority will be Labour supporters based in London, who shout down everybody else.


Warming Bias in Temperature Data due to Consensus Belief not Conspiracy

In a Cliscep article Science: One Damned Adjustment After Another? Geoff Chambers wrote:-

So is the theory of catastrophic climate change a conspiracy? According to the strict dictionary definition, it is, in that the people concerned clearly conferred together to do something wrong – namely introduce a consistent bias in the scientific research, and then cover it up.

This was in response to last the David Rose article in the Mail on Sunday, about claims the infamous the Karl et al 2015 breached America’s National Oceanic and Atmospheric Administration (NOAA) own rules on scientific intergrity.

I would counter this claim about conspiracy in respect of temperature records, even in the strict dictionary definition. Still less does it conform to a conspiracy theory in the sense of some group with a grasp of what they believe to be the real truth, act together to provide an alternative to that truth. or divert attention and resources away from that understanding of that truth. like an internet troll. A clue as to know why this is the case comes from on of the most notorious Climategate emails. Kevin Trenberth to Micheal Mann on Mon, 12 Oct 2009 and copied to most of the leading academics in the “team” (including Thomas R. Karl).

The fact is that we can’t account for the lack of warming at the moment and it is a travesty that we can’t. The CERES data published in the August BAMS 09 supplement on 2008 shows there should be even more warming: but the data are surely wrong. Our observing system is inadequate.

It is the first sentence that was commonly quoted, but it is the last part is the most relevant for temperatures anomalies. There is inevitably a number of homogenisation runs to get a single set of anomalies. For example the Reykjavik temperature data was (a) adjusted by the Iceland Met office by standard procedures to allow for known locals biases (b) adjusted for GHCNv2 (the “raw data”) (c) adjusted again in GHCNv3 (d) homogenized by NASA to be included in Gistemp.

There are steps that I have missed. Certainly Gistemp homogenize the data quite frequently for new sets of data. As Paul Matthews notes, adjustments are unstable. Although one data set might on average be pretty much the same as previous ones, there will be quite large anomalies thrown out every time the algorithms are re-run for new data. What is more, due to the nature of the computer algorithms, there is no audit trail, therefore the adjustments are largely unexplainable with reference to the data before, let alone with reference to the original thermometer readings. So how does one know whether the adjustments are reasonable or not, except through a belief in how the results ought to look? In the case of the climatologists like Kevin Trenberth and Thomas R. Karl, variations that show warmer than the previous run will be more readily accepted as correct rather than variations that show cooler. That is, they will find reasons why a particular temperature data set now shows greater higher warming than before. but will reject as outliers results that show less warming than before. It is the same when choosing techniques, or adjusting for biases in the data. This is exacerbated when a number of different bodies with similar belief systems try to seek a consensus of results, like  Zeke Hausfather alludes to in his article at the CarbonBrief. Rather than verifying results in the real world, temperature data seeks to conform to the opinions of others with similar beliefs about the world.

Kevin Marshall