This post is part of a planned series about climate delusions. These are short pieces of where the climate alarmists are either deluding themselves, or deluding others, about the evidence to support the global warming hypothesis; the likely implications for changing the climate; the consequential implications of changing / changed climate; or associated policies to either mitigate or adapt to the harms. The delusion consists is I will make suggestions of ways to avoid the delusions.
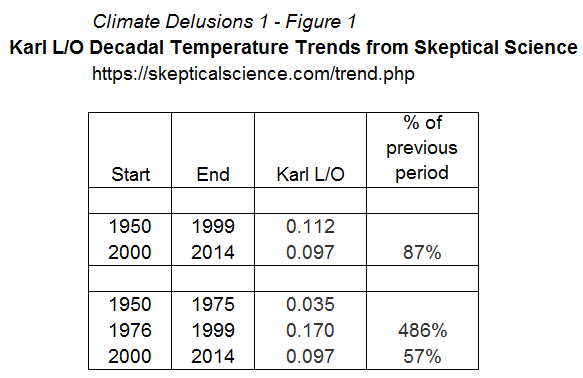
In the previous post I looked at how for the Karl el al 2015 paper to be a pause-buster required falsely showing a linear trend in the data. In particular it required the selection of the 1950-1999 period for comparing with the twenty-first century warming. Comparison with the previous 25 years would shows a marked decrease in the rate of warming. Now consider again the claims made in the summary.
Newly corrected and updated global surface temperature data from NOAA’s NCEI do not support the notion of a global warming “hiatus.” Our new analysis now shows that the trend over the period 1950–1999, a time widely agreed as having significant anthropogenic global warming, is 0.113°C decade−1 , which is virtually indistinguishable from the trend over the period 2000–2014 (0.116°C decade−1 ). …..there is no discernable (statistical or otherwise) decrease in the rate of warming between the second half of the 20th century and the first 15 years of the 21st century.
…..
…..the IPCC’s statement of 2 years ago—that the global surface temperature “has shown a much smaller increasing linear trend over the past 15 years than over the past 30 to 60 years”—is no longer valid.
The “pause-buster” linear warming trend needs to be put into context. In terms of timing the Karl reevaluation of the global temperature data was published in the run-up to the COP21 Paris meeting which aimed to get global agreement on reducing global greenhouse gas emissions to near zero by the end of the century. Having a consensus of the World’s leading climate experts admitting that warming was not happening strongly implied that there was no big problem to be dealt with. But is demonstrating a linear warming trend – even if it could be done without the use of grossly misleading statements like in Karl paper – sufficient to show that warming is caused by greenhouse gas emissions?
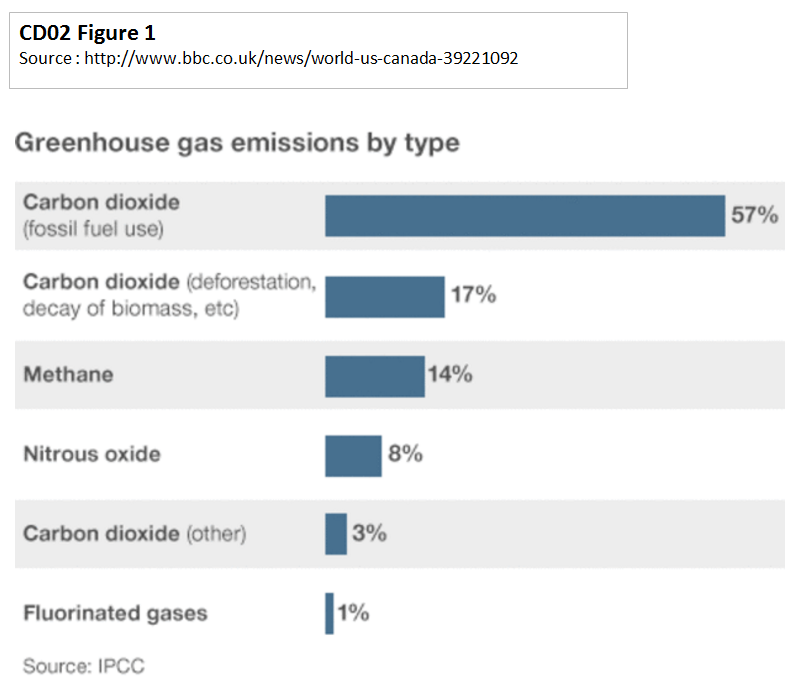
The IPCC estimates that about three-quarters of all greenhouse emissions are of carbon dioxide. The BBC’s recently made a graphic of the emission types, reproduced as Figure 1.
There is a strong similarity between the rise in CO2 emissions and the rise in CO2 levels. Although I will not demonstrate this here, the emissions data estimates are available from CDIAC where my claim an be verified. The issue arises with the rate of increase in CO2 levels. The full Mauna Loa CO2 record shows a marked increase in CO2 levels since the end of the 1950s, as reproduced in Figure 2.
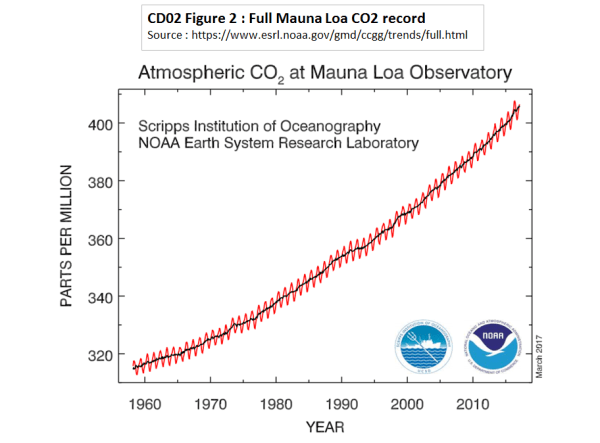
What is not so clear is that the rate of rise is increasing. In fact in the 1960s CO2 increased on average by less than 1ppm per annum, whereas in the last few years it has exceeded over 2ppm per annum. But the supposed eventual impact of the impact of the rise in CO2 is though a doubling. That implies that if CO2 rises at a constant percentage rate, and the full impact is near instantaneous, then the rate of warming produced from CO2 alone will be linear. In Figure 3 I have shown the percentage annual increase in CO2 levels.
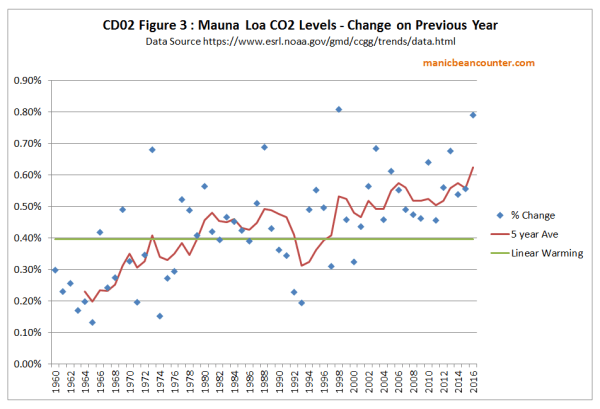
Of note from the graph
- In every year of the record the CO2 level has increased.
- The warming impact of the rise in CO2 post 2000 was twice that of the 1960s.
- There was a marked slowdown in the rate of rise in CO2 in the 1990s, but it was only for a few years below the long term average.
- After 1998 CO2 growth rates increased to a level greater for any for any previous period.
The empirical data of Mauna Loa CO2 levels shows what should be an increasing impact on average temperatures. The marked slowdown, or pause, in global warming post 2000, is therefore inconsistent with CO2 having a dominant, or even a major role, in producing that warming. Quoting a linear rate of warming over the whole period is people deluding both themselves and others to the empirical failure of the theory.
Possible Objections
You fail to isolate the short-term and long-term effects of CO2 on temperature.
Reply: The lagged, long-term effects would have to be both larger and negative for a long period to account for the divergence. There has so far been no successful and clear modelling, just a number of attempts that amount to excuses.
Natural variations could account for the slowdown.
Reply: Equally natural variations could account for much, if not all, of the average temperature rise.in preceding decades. Non-verifiable constructs that contradict real-world evidence, are for those who delude themselves or others. Further, if natural factors can be a stronger influence on global average temperature change for more than decade than human-caused factors, then this is a tacit admission that human-caused factors are not a dominant influence on global average temperature change.
Kevin Marshall