Good example of the key logical error in climate policy justifications is illustrated by an article posed in a Los Angeles Times article and repeated by Prof. Roger Pielke Jnr on Twitter. This error completely undermines the case for cutting greenhouse gas emissions.
The question is
What’s more important: Keeping the lights on 24 hours a day, 365 days a year, or solving the climate crisis?
It looks to be a trade-off question. But is it a real trade-off?
Before going further I will make some key assumptions for the purposes of this exercise. This is simply to focus in on the key issue.
- There is an increasing human-caused climate crisis, that will only get much worse, unless…
- Human greenhouse gas (GHG) emissions are cut to zero in the next few decades.
- The only costs of solving the climate crisis to the people of California are the few blackouts every year. This will remain fixed into the future. So the fact that California’s electricity costs are substantially higher than the US national average I shall assume for this exercise are nothing to do with any particular state climate-related policies.
- The relevant greenhouse gases are well-mixed in the atmosphere. Thus the emissions of California, do not sit in a cloud forever above the sunshine state, but are evenly dispersed over the whole of the earth’s atmosphere.
- Global GHG emissions are the aggregate emissions of all nation states (plus international emissions from sea and air). The United States’ GHG emissions are the aggregate emissions of all its member states.
Let us put the blackouts in context. The State of California has a helpful graphic showing a breakdown of the state GHG emissions.
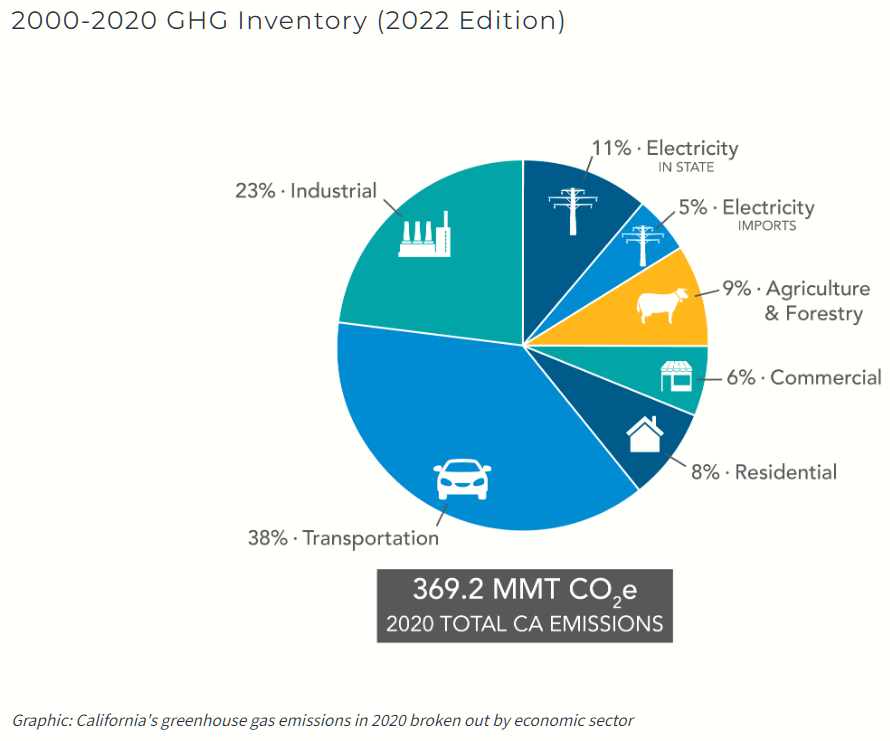
Electricity production, including imports, accounts for just 16% of California’s GHG emissions or about 60 MMtCO2e. Globally in 2020 global GHG emissions were just over 50,000 MMtCO2e. So the replacing existing electricity production from fossil fuels with renewables will cut global emissions by 0.12%. Replacing all GHG emissions from other sources will cut global emissions by 0.74%. So California alone cannot solve the climate crisis. There is no direct trade-off, but rather enduring the blackouts (or other costs) for a very marginal impact on climate change for the people of California. These tiny benefits of course will be shared by the 7960 million people who do not live in California.
The error is in believing that California’s climate policies are leading the rest of the planet.
More generally, the error is in assuming that the world follows the “leaders” on climate change. Effectively, the world the rest of the world is assumed to think as the climate consensus. An example is from the UK in March 2007 when then Environment Minister David Miliband was promoting a Climate Bill, that later became the Climate Change Act 2008.
In the last 16 years under the UNFCCC COP process there has been concerted efforts to get all countries to come “onboard”, so that the combined impact of local and country-level sacrifices produces the total benefit of stopping climate change. Has this laudable aim been achieved?
I will just go back to 2015, despite the United Nations Framework Convention on Climate Change Treaty (that set up the UNFCCC body) entering into force in March 1994. In preparation for COP 21 Paris most countries submitted “Intended Nationally Determined Contributions” (INDCs). The submissions outlined what post-2020 climate actions they intended to take under a new international agreement, now called the Paris Agreement. On the 1st November 2015 the UNFCCC produced a Synthesis Report of the aggregate impact of the INDCs submitted up to 1st October. The key chart is reproduced below.
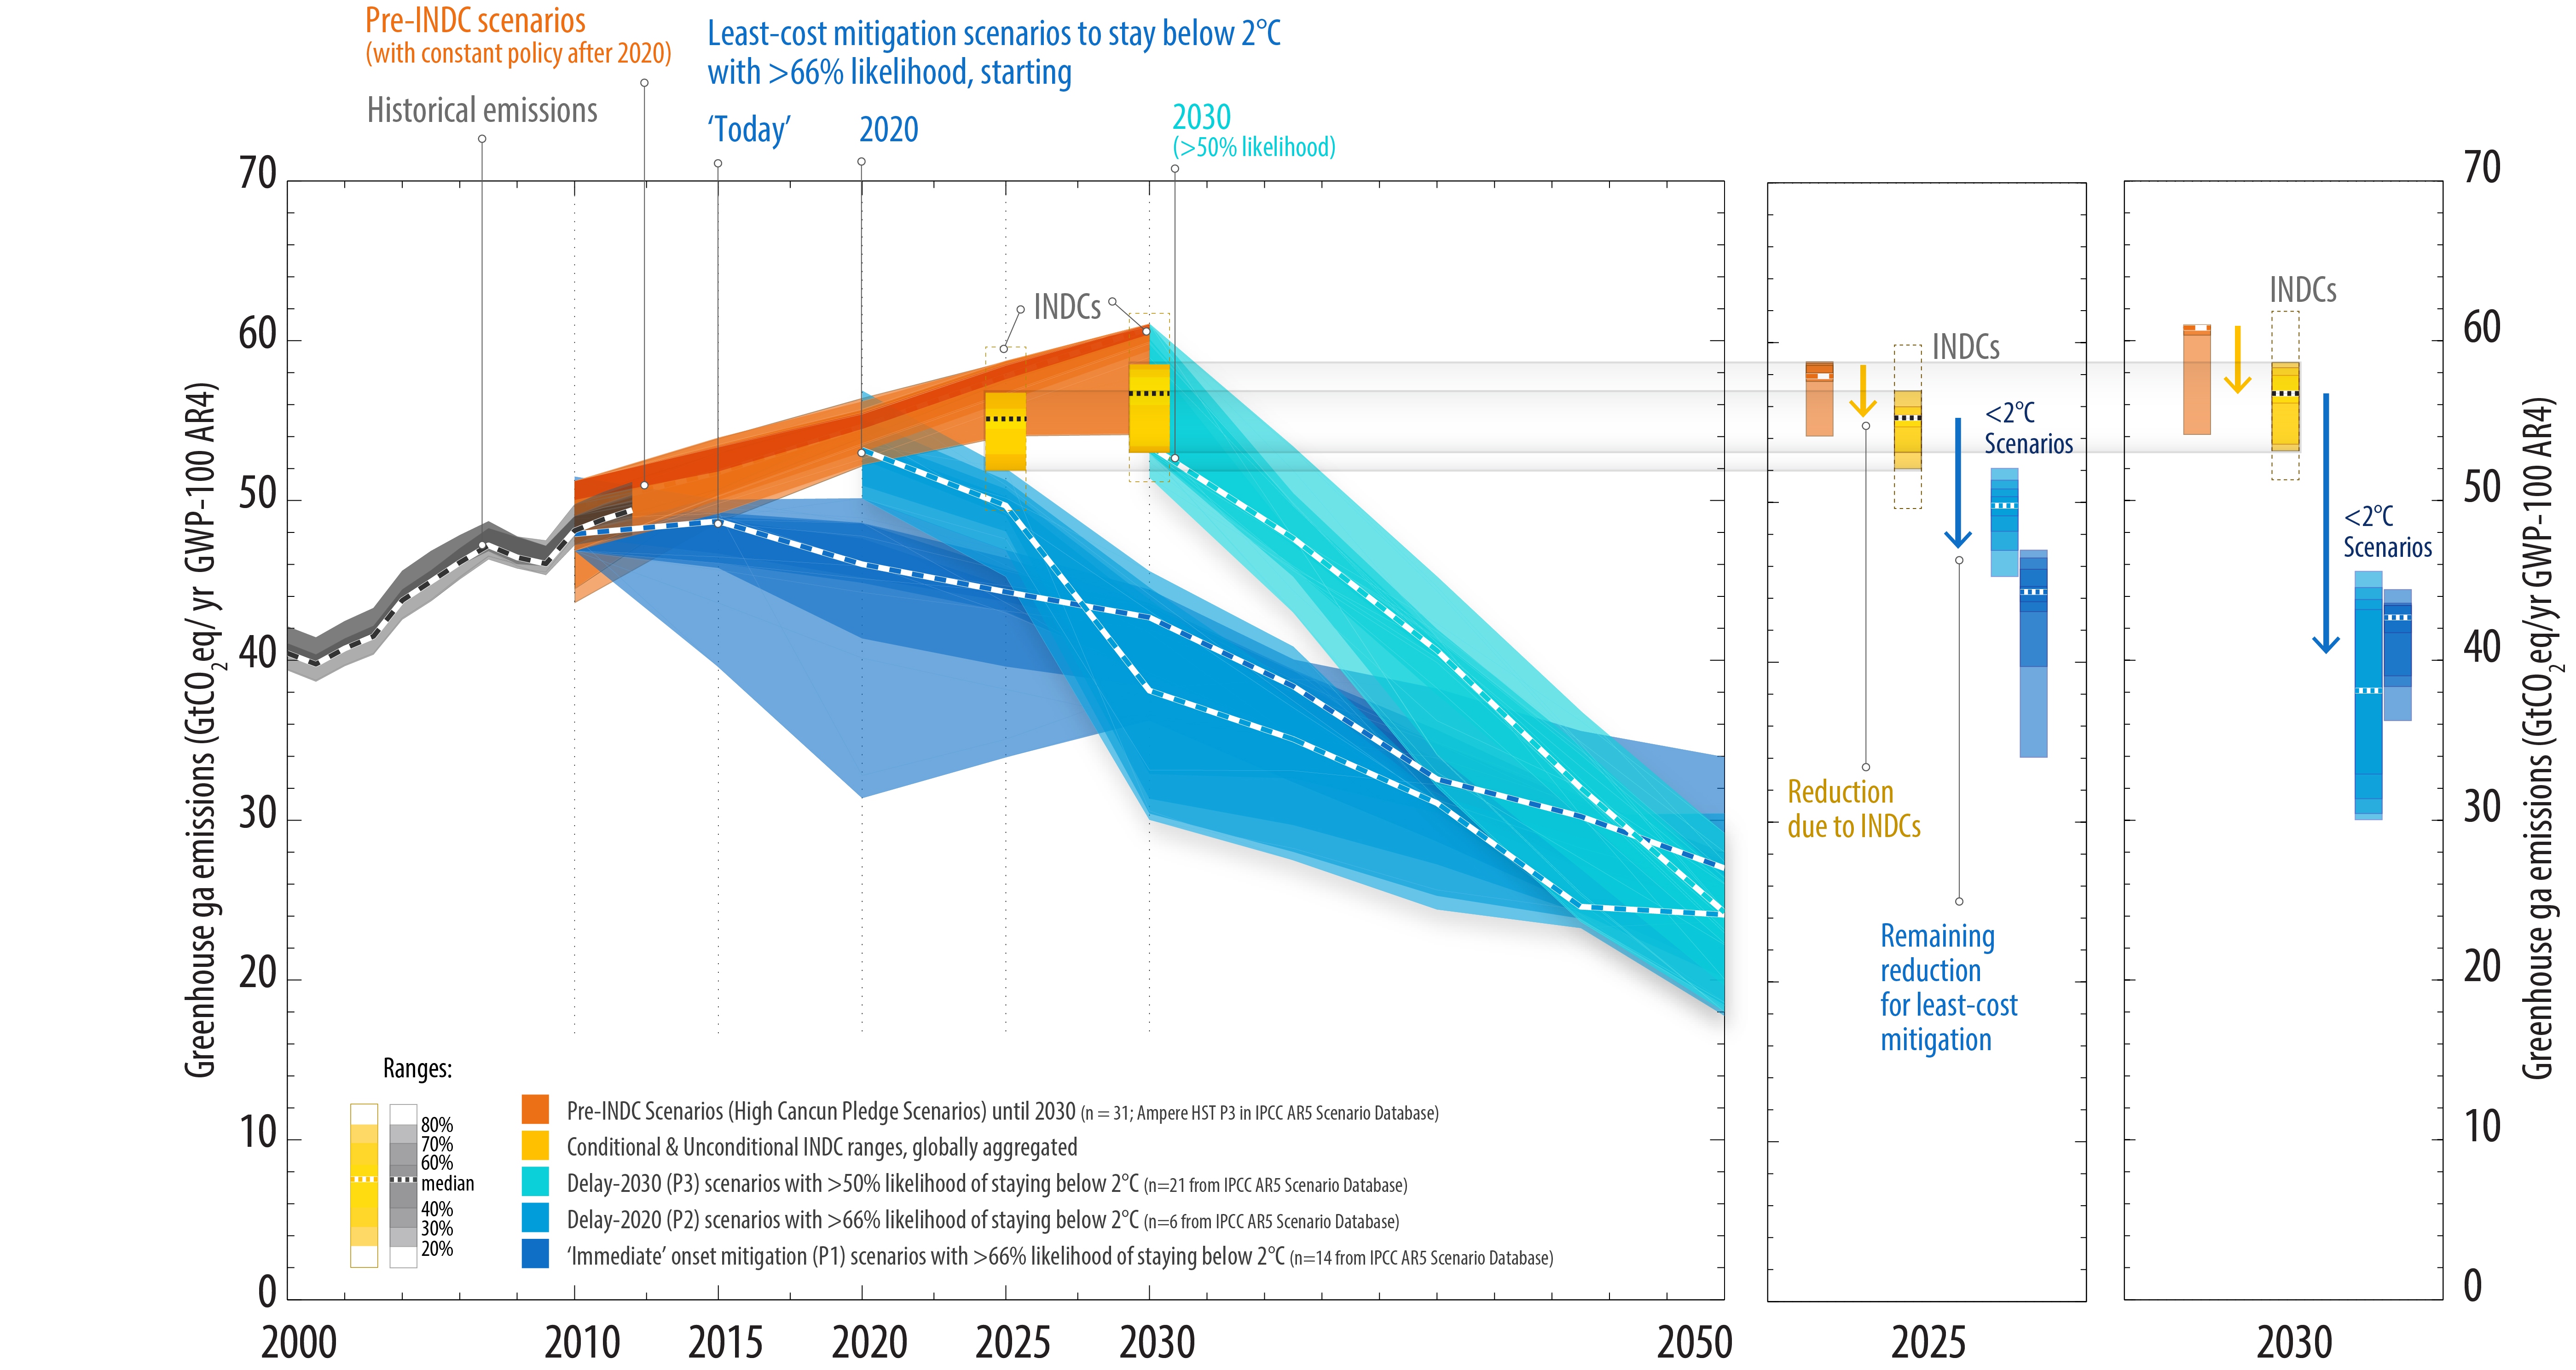
The aggregate impact is for emissions still to rise through to 2030, with no commitments made thereafter. COP21 Paris failed in it’s objectives of a plan to reduce global emissions as was admitted in the ADOPTION OF THE PARIS AGREEMENT communique of 12/12/2015.
- Notes with concern that the estimated aggregate greenhouse gas emission levels in 2025 and 2030 resulting from the intended nationally determined contributions do not fall within least-cost 2 ˚C scenarios but rather lead to a projected level of 55 gigatonnes in 2030, and also notes that much greater emission reduction efforts will be required than those associated with the intended nationally determined contributions in order to hold the increase in the global average temperature to below 2 ˚C above pre-industrial levels by reducing emissions to 40 gigatonnes or to 1.5 ˚C above pre-industrial levels by reducing to a level to be identified in the special report referred to in paragraph 21 below;
Paragraph 21 states
- Invites the Intergovernmental Panel on Climate Change to provide a special report in 2018 on the impacts of global warming of 1.5 °C above pre-industrial levels and related global greenhouse gas emission pathways;
The request lead, 32 months later, to the scary IPCC SR1.5 of 2018. The annual COP meetings have also been pushing very hard for massive changes. Has this worked?
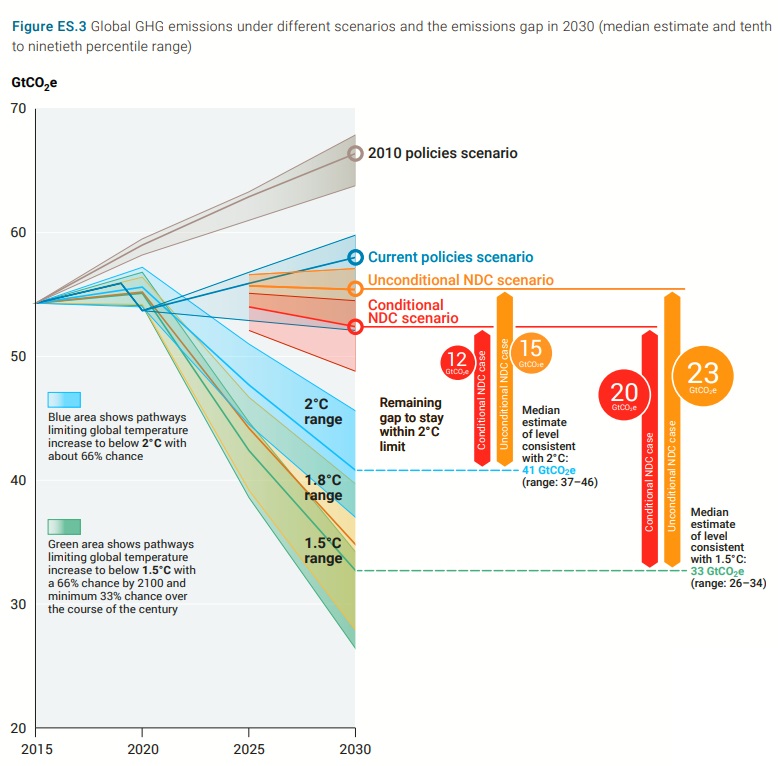
The answer from the UNEP Emissions Gap Report 2022 executive summary Fig ES.3 is a clear negative. The chart, reproduced above as Figure 3, shows that no significant changes have been made to the commitments since 2015, in that aggregate global emissions will still be higher in 2030 than in 2015. Indeed the main estimate is for emissions in 2030 is 58 GtCO2e, up from 55 GtCO2e in 2015. Attempts to control global emissions, hence the climate, have failed.
Thus, in the context of the above assumptions the question for the people of California becomes.
What’s more important: Keeping a useless policy that is causing blackouts, or not?
To help clarify the point, there is a useful analogy with medicine.
If a treatment is not working, but causing harm to the patient, should you cease treatment?
In medicine, like in climate policy, whether or not the diagnosis was correct is irrelevant. Morally it is wrong to administer useless and harmful policies / treatments. However, there will be strong resistance to any form of recognition of the reality that climate mitigation has failed.
Although the failure to reduce emissions at the global level is more than sufficient to nullify any justification for emissions reductions at sub-global levels, there are many other reasons that would further improve the case for a rational policy-maker to completely abandon all climate mitigation policies.