Indonesia Outflanks the Climate Activists in its INDC Submission

I have spent a few weeks trying to make sense of the INDC submissions. One of the most impenetrable appeared to that from Indonesia. This view is shared by The Carbon Brief.

Uncertain emissions

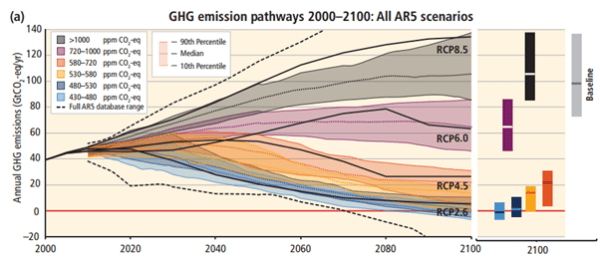
As well as being hazy on policy and financing needs, it is also difficult to gauge the ambition of Indonesia’s INDC emissions targets. This is despite the document including a projected figure for BAU emissions in 2030 of 2.9bn tonnes of CO2 equivalent (GtCO2e).

The pledge to reduce emissions by at least 29% compared to this trajectory means an effective cap in 2030 of 2GtCO2e. With the more ambitious 41% reduction compared to BAU, the cap would be 1.7GtCO2e.


Similarly the World Resources Institute states

(T)he current draft contribution still displays several important gaps in transparency and ambition, which must be addressed before submitting a final INDC to the United Nations Framework Convention on Climate Change (UNFCCC). By eliminating these gaps, the Indonesian government could bring its contribution into line with international best practices on transparency, demonstrate leadership internationally by enhancing ambition, and help ensure success at COP 21.

The context from Indonesia’s perspective is stated in the opening paragraph of Indonesia’s INDC Submission.

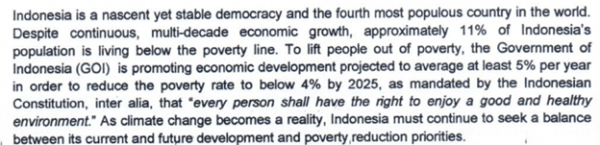
In more basic language, Indonesia has more important and immediate priorities than “climate change“. From a national point of view, imposing drastic and ineffective policies will go against the Indonesian Government’s perceived duty to its people. This will happen regardless of the truth of the projected catastrophes that await the planet without global mitigation. The policies will be ineffective because most other emerging economies have similar priorities to Indonesia, and are taking similar measures of policy avoidance. In the case of Indonesia these are

  • Cherry-picking a base year.
  • Making reductions relative to a fictional “Business as Usual” scenario with inflated economic growth figures.
  • Making sure that even the most ambitious objectives achievable within the range of an objective forecast.
  • Focus the negotiations on achieving the conditional objectives subject to outside assistance. Any failure to reach agreement then becomes the fault of rich countries failing to provide the finance.
  • Allow some room to make last minute concessions not in the original submission, contingent on further unspecified outside assistance that is so vast the money will never be forthcoming.

The calculations to achieve the figures in the submissions are fairly simple to work out with a bit of patience.


Calculating the 2030 Business as Usual 2881 MtCO2e

The Indonesian INDC submission states that in 2005 total emissions were 1800 MtCO2e and combustion of fossil fuels were 19% of this total. That implies about 342 MtCO2e from the combustion of fossil fuels. The Carbon Dioxide Information Analysis Center (CDIAC1) has an estimated figure of 341.71 MtCO2e and the UNFCCC Country Brief in 2005 “CO2 emissions from fuel combustion” were 335.71 MtCO2e. For 20112 the CDIAC estimate is 472.53 MtCO2e, rounded to 473. Let us now assume a growth rate in emissions of 6.0% per annum from 2012 to 2030, against an economic growth rate of around 5.2% from 2000 to 2010 and 5.8% from 2005 to 20103. At 6.0% compound growth fossil fuel emissions in 20304 will be 1431 MtCO2e.

The non-fossil fuel emissions are a bit more problematic to work out. In 2005 the baseline estimate is 81% of 18005 is 1458. It is only a vague estimate, so round it down to 1450 and then assume it is constant for the Business as Usual (BAU) scenario.

The BAU 2030 total emissions forecast for Indonesia is therefore 1431 + 1450 = 2881 MtCO2e.

There might be other ways to derive this figure, but none are simpler and the figures do not fall out exactly.


How does Indonesia achieve the unconditional 29% reduction against BAU?

The easiest part to achieve is outside of fossil fuel emissions. The major cause of these emissions is in the reduction of the rainforests. The Carbon Brief is claims the biggest source of non-fossil fuel emissions is due to illegal forest clearances to grow palm oil. Although in 2015 the forest fires are closing in on the record set in 1997, it is safe to say that that these will reduce considerably in the coming years as Indonesia already has 52% of world palm oil production. By assuming a 3.34% reduction per annum in these emissions from 2005, they will reduce from 1450 MtCO2e to 611 MtCO2e in 2030. Total emissions of 2042 MtCO2e (1431+611) are 29.1% lower than BAU without an expense on the part of the Indonesian Government.


How does Indonesia achieve the conditional 41% reduction against BAU?

Indonesia claims that it needs international cooperation increase the reduction against BAU to 41%. In whole numbers, if BAU is 2881 a 41% reduction would make 1700. Not 1699 or 1701, but 1700. This is 100 less than the estimated 1800 MtCO2e total GHG emissions for 2005. This will be achieved without any “international cooperation“, a euphemism for foreign aid. The reason is simple. From the UNFCCC Indonesia Country Brief for Indonesia GDP growth for 1990 to 2012 average GDP growth per annum was 4.9% and CO2 emissions from fuel combustion was 5.1%. Normally GDP growth exceeds emissions growth. As a country develops this gap will widen until emissions growth ceases altogether and will even fall slightly. In India GDP growth from 1990 to 2012 averaged 6.5% and emissions growth was 5.7%. In China the respective figures are 10.3% and 6.1%. In China, emissions will peak around 2025 to 2030 without any policy change. It is reasonable to assume therefore that forecast fossil fuel emissions growth will be at a lower rate than the forecast GDP growth of 6.0%. A conservative estimate is that the fossil fuel emissions growth rate will be 25% lower than GDP growth rate from 2011 to 2030 at 4.50%. Rounding as before4 gives forecast emissions of 1089 MtCO2e as against a BAU of 1431.

The revised 2030 total emissions forecast for Indonesia is 1089 + 611 = 1700 MtCO2e. This is a 41.0% reduction on the BAU of 2881 MtCO2e.


Why should Indonesia have such a cynical manipulation of the numbers?

Indonesia is caught between a rock and a hard place. The stated major priorities for this country of 250 million people are at odds with doing its bit to save the world. In this Indonesia is not alone. India, China, and Vietnam are other major emerging nations who site other priorities. Ranged against them are the activist scientists behind the climate scare who hold the a priori truth of the prophesied global warming catastrophes that await the planet if we do not amend out wicked ways. Further, mitigation policies are good for the sole, regardless of their effectiveness, and the practice of these policies will lead others to enlightenment they have found. They will not recognize that any alternative points of view exist, whether morally, politically or scientifically. Rather than argue, the best policy is to outflank them. The activists will accept official policy objectives without question so long as it appears to fit the cause. So the Indonesians gave them massive cuts related to fictitious projected figures, cloaked with the language of climate speak to throw them off the scent. They should be applauded for protecting 250 million people, rather than inflicting ineffective burdens upon them. The real shame is that the leaders of the so-called developed economies have fallen for this rubbish.

Kevin Marshall

Notes

  1. Reference of the full global carbon budget 2014: C. Le Quéré, R. Moriarty, R. M. Andrew, G. P. Peters, P. Ciais, P. Friedlingstein, S. D. Jones, S. Sitch, P. Tans, A. Arneth, T. A. Boden, L. Bopp, Y. Bozec, J. G. Canadell, F. Chevallier, C. E. Cosca, I. Harris, M. Hoppema, R. A. Houghton, J. I. House, A. K. Jain, T. Johannessen, E. Kato, R. F. Keeling, V. Kitidis, K. Klein Goldewijk, C. Koven, C. S. Landa, P. Landschützer, A. Lenton, I. D. Lima, G. H. Marland, J. T. Mathis, N. Metzl, Y. Nojiri, A. Olsen, T. Ono, W. Peters, B. Pfeil, B. Poulter, M. R. Raupach, P. Regnier, C. Rödenbeck, S. Saito, J. E. Sailsbury, U. Schuster, J. Schwinger, R. Séférian, J. Segschneider, T. Steinhoff, B. D. Stocker, A. J. Sutton, T. Takahashi, B. Tilbrook, G. R. van der Werf, N. Viovy, Y.-P. Wang, R. Wanninkhof, A. Wiltshire, and N. Zeng 2014. Global Carbon Budget 2014. Earth System Science Data Discussions, doi:10.5194/essdd-7-521-2014
  2. 2011 is the baseline year for the IPCC reports.
  3. This can be obtained from two sources. First the INDC submission notes that “GDP Growth Rate has slowed between 2010-2015 from 6.2-6.5% per annum to only 4.0% per annum (first quarter of 2015).” A return to the higher levels of growth is an assumption of successful government policy.
  4. Each year growth of 6.0% is rounded to the nearest whole number.
  5. The 2005 total emissions estimate of 1800 MtCO2 is at odds with other estimates. The WRI CAIT 2.0 figure is 1600; the EDGAR estimate is 1171; and the UNFCCC estimate is 2828. There might be another method of estimation. Maybe it is being a bit too cynical to assume that someone could have taken the average of the three (1866) and rounded down.

Plans to Increase Global Emissions at COP21 Paris

Summary

It is a necessary, but far from sufficient, condition to cut global greenhouse gas emissions for any increases in emissions in some parts of the world to be offset by emissions cuts elsewhere. INDC submissions for the COP21 in Paris contain proposed emissions targets between 2010 and 2030 suggest the opposite will be case. For every tonne of emissions reductions in 32 leading developed countries there will be at least three tonnes of emissions increases in 7 major developing countries. The net effect of these targets being achieved from these countries (which combined make up both 60% of global emissions and 60% of global population) will be to make global emissions 20% higher in 2030 than 2010. Using UNIPCC AR5 projections, unless there are large and rapid cuts in in global greenhouse emissions post 2030, any agreement based those submissions will not save the world from two degrees of dangerous global warming and will likely not save the world from three degrees of warming. This leads to a policy problem. Emissions reduction policies will only reduce a small part of the harms of climate change. So even if the more extreme claims of climate catastrophism are true, then it might be more beneficial for a nation to avoid emissions reduction policies.

Assumptions

In the following analysis makes these assumptions.

  • UNIPCC estimates of the relationship between global average temperature and atmospheric greenhouse gas levels are accurate.
  • UNIPCC estimates of the relationship between greenhouse gas emissions and atmospheric greenhouse gas levels are accurate.
  • Policy commitments will always turn into concrete policy.
  • Climate change policy priorities will not conflict with other priorities.
  • All policy will be effectively implemented in full, implying the requisite technological and project management capacities are available.

The Context

The World’s leaders meeting from 30 November to December 11 in Paris together to thrash out a plan to save the world from a dangerous two degrees of warming. In preparation 146 countries, representing 87% of Global Emissions have submitted plans to the United Nations Framework Convention on Climate Change (UNFCCC). These are available at the submissions website here. There is no-one who has gone through to evaluate whether these submissions are consistent with this objective. I have chosen a small sample of 7 major developing nations and 32 developing nations (EU 28 have a single target) which combined represent about 60% of global emissions and 60% of global population.

The level of global emissions control required to constrain global warming is given by the IPCC in their final version of the 2014 AR5 Synthesis Report page 21 Figure SPM 11(a) and reproduced below.

The dark blue band is the maximum emissions pathway to avoid going beyond 2 degrees of warming, with RCP2.6 denoting the central pathway. The dark orange pathway would produce 2.5-3.0 degrees of warming. According to the figure SPM 5(a) Annual GHG emissions in 2010 were 49 GtCO2. They are currently increasing by at least 2% a year. The extrapolated projection for 2030 is 70-75 GtCO2, roughly following the solid black line of the RCP8.5 BAU (non-policy) scenario. In 2015 this will be about 54 GtCO2. The minimum for policy is that global emissions should be at least no higher than they were in 2010, and preferably below that level to offset the cumulative overshoot that will occur.

How does the global policy requirement fit in with the country submissions?

If the IPCC projections are correct, to avoid 2 degrees of warming being exceeded there needs to be a global cap on greenhouse gas emissions of around 50 GtCO2 almost immediately and for that level to start to start falling in the early 2020s. Alternatively, if global emissions reach 60 GtCO2 without any prospect of major reductions thereafter then from the model projections three degrees of warming is likely to be exceeded. There is a large gap between these two scenarios, but even with submissions from a limited number of the major countries it is possible to state that the lower limit will be exceeded. This can be done by calculating emissions increases in the major high growth developing countries and the proposed emissions reductions in the major developed countries. This is not straight forward, as in most country submissions there are no clear figures, so various assumptions need to be made. For developing countries this is particularly difficult, as the estimated business as usual (BAU) emissions are usually not stated and are dependent upon assumptions of economic growth, though sometimes there are clues within the text. For the developed countries the projections are easier to calculate, as they are relative to a date in the past. There is a further issue of which measure of emissions to use. I have used the UNFCCC issued estimates of GHG emissions in its Country Briefs for 1990, 2000, 2005 & 2010.1 In many of the submissions there often both conditional and unconditional estimates of 2030 emissions. For developing countries the lower estimates are dependent on external funding. For the other countries, emissions reductions are expressed as a range. In every case I have used the lower emissions figure.2

For the developing countries, those with major projected emissions increases countries are as follows.3

Estimated targeted emissions increases from 2010 to 2030 for major developing countries based on INDC Submissions
Country

Emissons Change

INDC Submission

Country Brief

Mexico

30%

Mexico

Mexico

China

55%

China

China

Indonesia

90%

Indonesia

Indonesia

Turkey

115%

Turkey

Turkey

India

138%

India

India

Bangladesh

250%

Bangladesh

Bangladesh

Vietnam

260%

Vietnam

Vietnam

The targeted total increase GHG for these seven countries between 2010 and 2030 is estimated to be in excess of 13 Gt.

According to World Bank Data there were 3300 million people in these seven countries in 2013, or 46% of the global population.

For the developed countries those with the largest quantitative emissions reductions are as follows.4

Estimated targeted emissions change from 2010 to 2030 for major developed countries from INDC Submissions
Country

Emissons Change

INDC Submission

Country Brief

Australia

-30%

Australia

Australia

Canada

-29%

Canada

Canada

EU

-40%

EU

EU

Japan

-20%

Japan

Japan

USA

-28%

USA

USA

The targeted total decrease GHG for these thirty-two countries between 2010 and 2030 is estimated to be 4 Gt.

According to World Bank Data there were 900 million people in these thirty-two countries in 2013, or 13% of the global population.

For every one tonne of emissions reduction by developed countries, it will be replaced by at least three tonnes of emissions elsewhere. Bigger reductions by these developed countries will not close the gap, as their total 2010 emissions are just 12.9 G. The developing countries do not include a single African country, nor Pakistan, Iran, Venezuela, or numerous other countries. Yet it does include all the major developed countries.

Whilst the developing countries way not achieve this increase in emissions by 2030, collectively they will achieve this increase shortly after that date. Many of the developed countries may not achieve the emissions reductions due to changing priorities. For instance the EU targets reduction may not be achieved due to Germany abandoning nuclear power in favour of coal and Southern European states reducing renewables subsidies as a response to recent economic crises.

The Elephant in the Room

In 2030, even with an agreement based on the INDC submissions signed this December in Paris, and then fully implemented without compromise there is still a problem. If the IPCC models are correct, the only way to stop the 3 degrees of warming being exceeded is through rapid reductions in emissions in those countries where emissions have recently peaked (e.g. South Korea and China) along with steep reductions in emissions of countries where they are still increasing rapidly (e.g. India and Bangladesh). Unless a technological miracle happens in the next decade this is not going to happen. More likely is that global emissions may keep on rising as many slower-growing African and Asian nations have ever larger unit increases in emissions each year.

The Policy Problem

The justification for mitigation policy is most clearly laid out in the British 2006 Stern Review Summary of Conclusions page vi

Using the results from formal economic models, the Review estimates that if we don’t act, the overall costs and risks of climate change will be equivalent to losing at least 5% of global GDP each year, now and forever. If a wider range of risks and impacts is taken into account, the estimates of damage could rise to 20% of GDP or more.

That is the unknown and random costs of climate change can be exchanged for the lesser and predictable costs of policy. A necessary, but far from sufficient, condition of this happening is that policy will eradicate all the prospective costs of climate change. It could be that if warming is constrained to less than 2 degrees the costs of climate change would be trivial, so the reality could be a close approximation of Stern’s viewpoint. But if warming exceeds 3 degrees and the alleged harms are correct, then emissions reducing policies are likely to lead to net harms for the countries implementing those policies and a small net benefit for those countries without policy.

Kevin Marshall

Notes

  1. The exception is for Bangladesh. They are one of the few countries that clearly lays out 2030 estimates in MtCO2, but the 2010 estimate is about 20% lower than the UNFCCC figure. I have just lifted the Bangladeshi figures.
  2. For instance the USA the target is to reduce is emissions 26-28% on the 2005 level. I have used the 28% figure. The United States is about the only country not providing target figures for 2030. I would be imprudent to assume any greater reductions given that it is not certain even this level will be ratified by Congress.
  3. Not all the countries outside of the rich are targeting emissions increases. Brazil and Argentina are targeting emissions reductions, whilst Thailand and South Korea would appear to be targeting to maintaining emissions at around 2010 levels.
  4. Not all developed countries have emissions reduction targets.
  5. South Korea with 1.3% of 2010 global emissions could be included in developed countries, but its target it is to roughly maintain emissions at 2010 levels. Switzerland, Norway and Singapore are all committed to emissions reductions, but combined they have less 0.3 GT of emissions.