“Were going to miss the 2°C Warming target” study and IPCC AR5 WG3 Chapter 6

WUWT had a post on 22nd January

Study: we’re going to miss (and overshoot) the 2°C warming target

This comment (from a University of Southhampton pre-publication news release) needs some explanation to relate it to IPCC AR5.

Through their projections, Dr Goodwin and Professor Williams advise that cumulative carbon emissions needed to remain below 195-205 PgC (from the start of 2017) to deliver a likely chance of meeting the 1.5°C warming target while a 2°C warming target requires emissions to remain below 395-455 PgC.

The PgC is peta-grams of Carbon. For small weights, one normally uses grams. For larger weights one uses kilograms. For still larger weights one uses tonnes. Under the Imperial measurement system, one uses ounces, pounds and tons. So one peta-gram is a billion (or giga) tonne.
Following the IPCC’s convention, GHG emissions are expressed in units of CO2, not carbon. Other GHGs are expressed in CO2e. So 1 PgC = 3.664 GtCO2e.

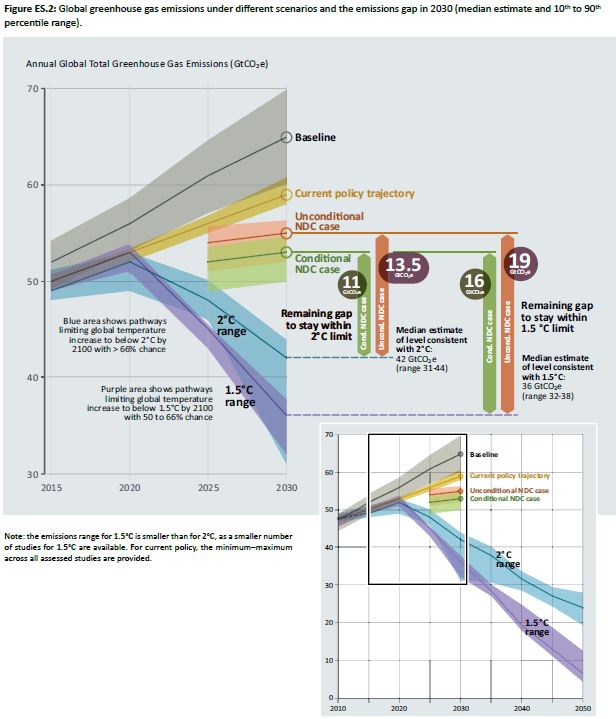
So the emissions from the start of 2017 are 715-750 GtCO2e for 1.5°C of warming and 1447-1667 GtCO2e for 2°C of warming. To make comparable to IPCC AR5, (specifically to table 6.3 from IPCC AR5 WG3 Chapter 6 p431), one needs to adjust for two things – the IPCC’s projections are from 5 years earlier, and for CO2 emissions only, about 75% of GHG emissions.

The IPCC’s projections of CO2 emissions are 630-1180 GtCO2 for 1.5-1.7°C of warming and 960-1550 GtCO2e for 1.7-2.1°C of warming.

With GHG emissions roughly 50 GtCO2e a year and CO2 emissions 40 GtCO2 a year, from the IPCC’s figures updated from the start of 2017 and expressed in GtCO2e are 570-1300 GtCO2e for 1.5-1.7°C of warming and 1010-1800 GtCO2e for 1.7-2.1°C of warming.

Taking the mid-points of the IPCC’s and the Goodwin-Williams figures, the new projections are saying that at current emissions levels, 1.5°C will be breached four years earlier, and 2°C will be breached one year later. Only the mid-points are 1.6°C and 1.9°C, so it makes no real difference whatsoever. The Goodwin-Williams figures just narrow the ranges and use different units of measure.

But there is still a major problem. Consider this mega table 6.3 reproduced, at lower quality, below.

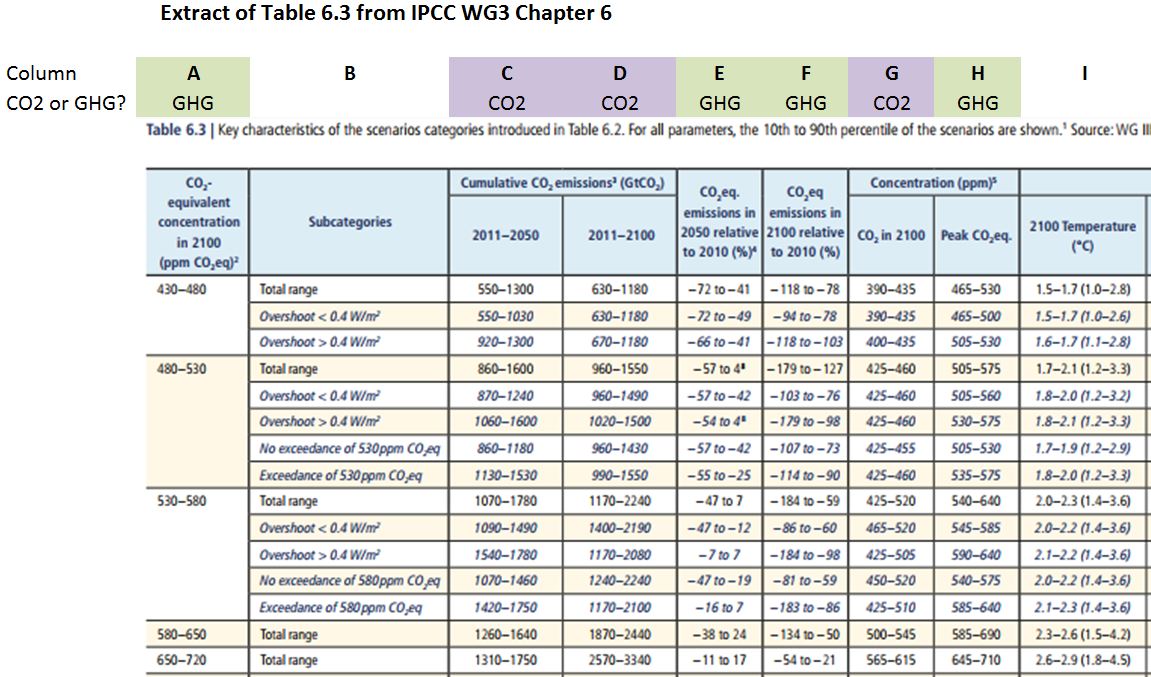
Notice Column A is for CO2 equivalent concentration in 2100 (ppm CO2eq). Current CO2 levels are around 405 ppm, but GHG gas levels are around 450 ppm CO2eq. Then notice columns G and H, with a joint heading of Concentration (ppm). Column G is for CO2 levels in 2100 and Column H is for CO2 equivalent levels. Note also that for the first few rows of data, Column H is greater than Column A, implying that sometime this century peak CO2 levels will be higher than at the end of the century, and (subject to the response period of the climate system to changes in greenhouse gas levels)  average global temperatures could (subject to the models being correct) exceed the projected 2100 levels. How much though?

Using a magic equation at the skeptical science blog, and (after correcting to make a doubling of CO2 convert to exactly 3°C of warming) assume that all changes in CO2 levels instantly translate into average temperature changes. Further, I assume that other greenhouse gases are irrelevant to the warming calculation, and peak CO2 concentrations are calculated from peak GHG, 2100 GHG, and 2100 CO2 concentrations. I derived the following table.

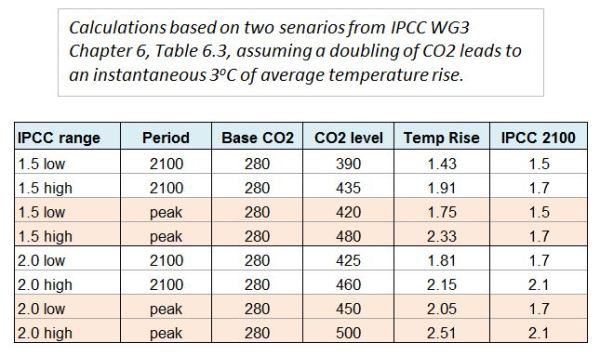
The 1.5°C warming scenario is actually 1.5-1.7°C warming in 2100, with a mid-point of 1.6°C. The peak implied temperatures are about 2°C.

The 2°C warming scenario is actually 1.7-2.1°C warming in 2100, with a mid-point of 1.9°C. The peak implied temperatures are about 2.3°C, with 2.0°C of warming in 2100 implying about 2.4°C peak temperature rise.

So when the IPCC talk about constraining temperature rise, it is about projected temperature rise in 2100, not about stopping global average temperature rise breaching 1.5°C or 2°C barriers.

Now consider the following statement from the University of Southhampton pre-publication news release, emphasis mine.

“Immediate action is required to develop a carbon-neutral or carbon-negative future or, alternatively, prepare adaptation strategies for the effects of a warmer climate,” said Dr Goodwin, Lecturer in Oceanography and Climate at Southampton. “Our latest research uses a combination of a model and historical data to constrain estimates of how long we have until 1.5°C or 2°C warming occurs. We’ve narrowed the uncertainty in surface warming projections by generating thousands of climate simulations that each closely match observational records for nine key climate metrics, including warming and ocean heat content.”

Professor Williams, Chair in Ocean Sciences at Liverpool, added: “This study is important by providing a narrower window of how much carbon we may emit before reaching 1.5°C or 2°C warming. There is a real need to take action now in developing and adopting the new technologies to move to a more carbon-efficient or carbon-neutral future as we only have a limited window before reaching these warming targets.” This work is particularly timely given the work this year of the Intergovernmental Panel on Climate Change (IPCC) to develop a Special Report on the Impacts of global warming of 1.5°C above pre-industrial levels.

Summary

The basic difference between IPCC AR5 Chapter 6 Table 6.3 and the new paper is the misleading message that various emissions policy scenarios will prevent warming breaching either 1.5°C or 2°C of warming when the IPCC scenarios are clear that this is the 2100 warming level. The IPCC scenarios imply that before 2100 warming could peak at respectively around 1.75°C or 2.4°C.  My calculations can be validated through assuming (a) a doubling of CO2 gives 3°C of warming, (b) other GHGs are irrelevant, (c) there no significant lag between the rise in CO2 level and rise in global average temperature.

Kevin Marshall


Is China leading the way on climate mitigation?

At the Conversation is an article on China’s lead in renewable energy.
China wants to dominate the world’s green energy markets – here’s why is by University of Sheffield academic Chris G Pope. The article starts:-

If there is to be an effective response to climate change, it will probably emanate from China. The geopolitical motivations are clear. Renewable energy is increasingly inevitable, and those that dominate the markets in these new technologies will likely have the most influence over the development patterns of the future. As other major powers find themselves in climate denial or atrophy, China may well boost its power and status by becoming the global energy leader of tomorrow.

The effective response ought to be put into the global context. At the end of October UNEP produced its Emissions Gap Report 2017, just in time for the COP23 meeting in Bonn. The key figure on the aimed for constraint of warming to 1.5°C to 2°C from pre-industrial levels – an “effective polcy response” – is E5.2, reproduced below.

An “effective response” by any one country is at least reducing it’s emissions substantially by 2030 compared with now at the start of 2018. To be a world leader in response to climate change requires reducing emissions in the next 12 years by more than the required global average of 20-30%.

Climate Action Tracker – which, unlike myself strongly promotes climate mitigation – rates China’s overall policies as Highly Insufficient in terms of limiting warming to 1.5°C to 2°C. The reason is that they forecast on the basis of current policies emissions will increase in China in the next few years, instead of rapidly decreasing.

So why has Chris Pope got China’s policy so radically wrong? After all, I accept the following statement.

Today, five of the world’s six top solar-module manufacturers, five of the largest wind turbine manufacturers, and six of the ten major car manufacturers committed to electrification are all Chinese-owned. Meanwhile, China is dominant in the lithium sector – think: batteries, electric vehicles and so on – and a global leader in smart grid investment and other renewable energy technologies.

Reducing net emissions means not just have lots of wind turbines, hydro schemes, solar farms and electric cars. It means those renewable forms of energy replacing CO2 energy sources. The problem is that renewables are adding to total energy production, along with fossil fuels. The principal source of China’s energy for electricity and heating is coal. The Global Coal Plant Tracker at endcoal.org has some useful statistics. In terms of coal-fired power stations, China now has 922 GW of coal-fired power stations operating (47% of the global total) with a further 153 GW “Announced + Pre-permit + Permitted” (28%) and 147 GW under construction (56%). Further, from 2006 to mid-2017, China’s Newly Operating Coal Plants had a capacity of 667 GW, fully 70% of the global total. Endcoal.org estimates that coal-fired power stations account for 72% of global GHG emissions from the energy sector, with the energy-sector contributing to 41% of global GHG emissions. With China’s coal-fired power stations accounting for 47% of the global total, assuming similar capacity utilization, China’s coal-fired power stations account for 13-14% of global GHG emissions or 7 GtCO2e of around 52 GtCO2e. It does not stop there. Many homes in China use coal for domestic heating; there is a massive coal-to-liquids program (which may not be currently operating due to the low oil price); manufacturers (such as metal refiners) burn it direct; and recently there are reports of producing gas from coal. So why would China pursue a massive renewables program?

Possible reasons for the Chinese “pro-climate” policies

First, is for strategic energy reasons. I believe that China does not want to be dependent on world oil price fluctuations, which could harm economic growth. China, therefore, builds massive hydro schemes, despite it there being damaging to the environment and sometimes displacing hundreds of thousands of people. China also pursues coal-to-liquids programs, alongside promoting solar and wind farms. Although duplicating effort, it means that if oil prices suffer another hike, China is more immune from the impact than

Second, is an over-riding policy of a fast increase in perceived living standards. For over 20 years China managed average growth rates of up to 10% per annum, increasing average incomes by up to eight times, and moving hundreds of millions of people out of grinding poverty. Now economic growth is slowing (to still fast rates by Western standards) the raising of perceived living standards is being achieved by other means. One such method is to reduce the particulate pollution, particularly in the cities. The recent heavy-handed banning of coal burning in cities (with people freezing this winter) is one example. Another, is the push for electric cars, with the electricity mostly coming from distant coal-fired power stations. In terms of reducing CO2 emissions, electric cars do not make sense, but they do make sense in densely-populated areas with an emerging middle class wanting independent means of travel.

Third, is the push to dominate areas of manufacturing. With many countries pursuing hopeless renewables policies, the market for wind turbines and solar panels is set to increase. The “rare earths” required for the wind turbine magnets, such as neodymium, are produced in large quantities in China, such as in highly polluted Baotou. With lithium (required for batteries), China might only be currently world’s third largest producer – and some way behind Australia and Chile – but its reserves are the world’s second largest and sufficient on their own to supply current global demand for decades. With raw material supplies and low, secure energy costs from coal, along with still relatively low labour costs, China is well-placed to dominate these higher added-value manufacturing areas.

Concluding Comments

The wider evidence shows that an effective response to climate change is not emanating from China. The current energy policies are dominated, and will continue to be dominated, by coal. This will far out-weigh any apparent reductions in emissions from the manufacturing of renewables. Rather, the growth of renewables should be viewed in the context of promoting the continued rapid and secure increase in living standards for the Chinese people, whether in per capita income, or in standards of the local environment.

Kevin Marshall


NOAA Future Aridity against Al Gore’s C20th Precipitation Graphic

Paul Homewood has taken a look at an article in yesterdays Daily Mail – A quarter of the world could become a DESERT if global warming increases by just 2ºC.

The article states

Aridity is a measure of the dryness of the land surface, obtained from combining precipitation and evaporation.  

‘Aridification would emerge over 20 to 30 per cent of the world’s land surface by the time the global temperature change reaches 2ºC (3.6ºF)’, said Dr Manoj Joshi from the University of East Anglia’s School of Environmental Sciences and one of the study’s co-authors.  

The research team studied projections from 27 global climate models and identified areas of the world where aridity will substantially change.  

The areas most affected areas are parts of South East Asia, Southern Europe, Southern Africa, Central America and Southern Australia.

Now, having read Al Gore’s authoritative book An Inconvenient Truth there are statements first about extreme flooding, and then about aridity (pages 108-113). The reason for flooding coming first is on a graphic of twentieth-century changes in precipitation on pages 114 & 115.

This graphic shows that, overall, the amount of precipitation has increased globally in the last century by almost 20%.

 However, the effects of climate change on precipitation is not uniform. Precipitation in the 20th century increased overall, as expected with global warming, but in some regions precipitation actually decreased.

The blue dots mark the areas with increased precipitation, the orange dots with decreases. The larger the dot, the larger the change. So, according to Nobel Laureate Al Gore, increased precipitation should be the far more common than increased aridity. If all warming is attributed to human-caused climate change (as the book seems to imply) then over a third of the dangerous 2ºC occurred in the 20th century. Therefore there should be considerable coherence between the recent arid areas and future arid areas.

The Daily Mail reproduces a map from the UEA, showing the high-risk areas.

There are a couple of areas with big differences.

Southern Australia

In the 20th century, much of Australia saw increased precipitation. Within the next two or three decades, the UEA projects it getting considerably arider. Could this change in forecast be the result of the extreme drought that broke in 2012 with extreme flooding? Certainly, the pictures of empty reservoirs taken a few years ago, alongside claims that they would never likely refill show the false predictions.

One such reservoir is Lake Eildon in Victoria. Below is a graphic of capacity levels in selected years. It is possible to compare other years by following the historical water levels for EILDON link.

Similarly, in the same post, I linked to a statement by re-insurer Munich Re stating increased forest fires in Southern Australia were due to human activity. Not by “anthropogenic climate change”, but by discarded fag ends, shards of glass and (most importantly) fires that were deliberately started.

Northern Africa

The UEA makes no claims about increased aridity in Northern Africa, particularly with respect to the Southern and Northern fringes of the Sahara. Increasing desertification of the Sahara used to be claimed as a major consequence of climate change. In the year following Al Gore’s movie and book, the UNIPCC produced its Fourth Climate Assessment Report. Working Group II report, Chapter 9 (Pg 448) on Africa made the following claim.

In other countries, additional risks that could be exacerbated by climate change include greater erosion, deficiencies in yields from rain-fed agriculture of up to 50% during the 2000-2020 period, and reductions in crop growth period (Agoumi, 2003).

Richard North took a detailed look at the background of this claim in 2010. The other African countries were Morocco, Algeria and Tunisia. Agoumi 2003 compiled three reports, only one of which – Morocco – had anything near a 50% claim. Yet Morocco seems, from Al Gore’s graphic to have had a modest increase in rainfall over the last century.

Conclusion

The UEA latest doom-laden prophesy of increased aridity flies in the face of the accepted wisdom that human-caused global warming will result in increased precipitation. In two major areas (Southern Australia and Northern Africa), increased aridity is at add odds with changes in precipitation claimed to have occurred in the 20th Century by Al Gore in An Inconvenient Truth. Yet over a third of the of the dangerous 2ºC warming limit occurred in the last century.

Kevin Marshall