Last week I posted how Miles Allen had pulled off a trick to show warming in the 21st century after that trend had stopped in 1998. According to David Middleton at Watts up with That, the BBC’s Richard Black is using a similar decadal comparison to show that warming has continued. There are two Richard Black’s claim that the GWPF are cherry-picking the data. First, that an employee of the UK state broadcaster should choose to use a foreign temperature record over the UK one. Second, why the switch to decadal comparisons, when the IPCC has long used the norm.
Let me break this down with two graphs. Like with the previous posting, I see no scientific reason to necessitate why the starting point for the earth’s orbit of the sun has to be on 1st January. I therefore include all 12 month moving averages. That is Jan-Dec, Feb-Jan, Mar-Feb etc. I have also included three lines on my analysis. First the NASA GISSTEMP; second the HADCRUT3 and third the difference between the two.
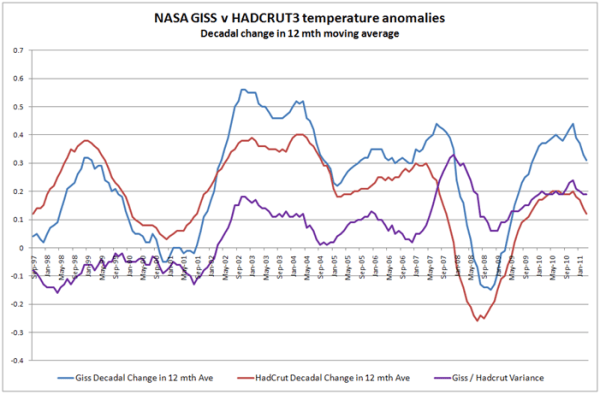
The first graph shows the decadal change in the NASA GISS figures that Richard Black is talking about. Sure enough the only period where the 12 month average temperature anomaly is lower than a decade before is in 2008. Using the HADCRUT3 data reveals a similar pattern, but the negative period is much longer. If The HADCRUT3 decadal change is subtracted from the GISSTEMP, there is shown to be a greater decadal warming trend in the NASA than in the UK figures. This might suggest the reason for Richard Black’s preference for foreign data over that paid for by the UK taxpayer’s.
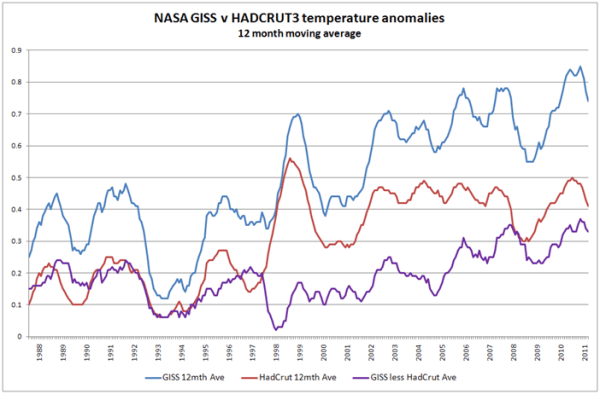
The second graph shows the 12 month moving average data – and clearly shows the reasons for both using decadal temperature changes over annual, and foreign data over British. From 1988 to 1997, there was no real warming trend if the Pinatubo cooling is removed from 1995. However the NASA anomaly seems to be around twice as volatile is the Hadley. But in 1998 the position reverses. The natural 1998 El Nino effect is twice according to the British scientists, as it is to Dr Hansen and his team. Post 1998 the story diverges. According to NASA, the warming resumes on an upward trend. According to the Hadley scientists, the 1998 El Nino causes a step change in average temperatures and the warming stops. As a result the NASA GISS warming trend is mirrored by its divergence from the more established and sober British series.

1 Comment