Milk loss yields down to heat stress

Last week, Wattupwiththat post “Climate Study: British Children Won’t Know What Milk Tastes Like”. Whilst I greatly admire Anthony Watts, I think this title entirely misses the point.
It refers to an article at the Conservation “How climate change will affect dairy cows and milk production in the UK – new study” by two authors at Aberystwyth University, West Wales. This in turn is a write up of a Plos One article published in May “Spatially explicit estimation of heat stress-related impacts of climate change on the milk production of dairy cows in the United Kingdom“. The reason I disagree is that even with very restrictive assumptions, this paper shows that even with large changes in temperature, the unmitigated costs of climate change are very small. The authors actually give some financial figures. Referring to the 2190s the PLOS One abstract ends:-

In the absence of mitigation measures, estimated heat stress-related annual income loss for this region by the end of this century may reach £13.4M in average years and £33.8M in extreme years.

The introduction states

The value of UK milk production is around £4.6 billion per year, approximately 18% of gross agricultural economic output.

For the UK on average Annual Milk Loss (AML) due to heat stress is projected to rise from 40 kg/cow to over 170 kg/cow. Based on current yields it is from 0.5% to 1.8% in average years. The most extreme region is the south-east where average AML is projected to rise from 80 kg/cow to over 320 kg/cow. That is from 1% to 4.2% in average years. That is, if UK dairy farmers totally ignore the issue of heat stress for decades the industry could see average revenue losses from heat stress rise on average from £23m to £85m. The financial losses are based on constant prices of £0.30 per litre.

With modeled estimates over very long periods, it is worth checking the assumptions.

Price per liter of milk

The profits are based upon a constant price of £0.30 a liter. But prices can fluctuate according to market conditions. Data on annual average prices paid is available from AHDB Dairy, ” a levy-funded, not-for-profit organisation working on behalf of Britain’s dairy farmers.” Each month, since 2004, there are reported the annual average prices paid by dairies over a certain size available here. That is 35-55 in any one month. I have taken the minimum and maximum prices for reported in June each year and shown in Figure 1.

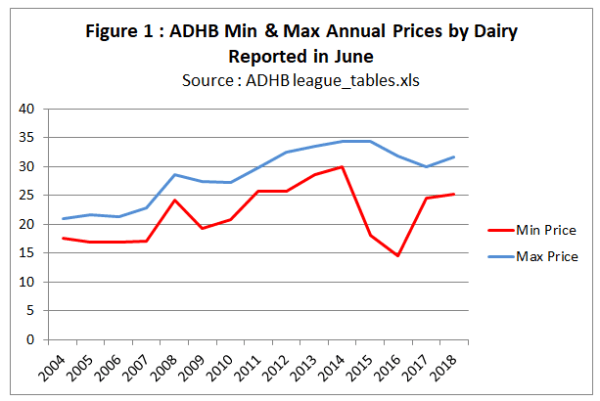
Even annual average milk prices fluctuate depending on market conditions. If milk production is reduced in summer months due to an unusual heat wave causing heat stress, ceteris paribus, prices will rise. It could be that a short-term reduction in supply would increase average farming profits if prices are not fixed. It is certainly not valid to assume fixed prices over many decades.

Dumb farmers

From the section in the paper “Milk loss estimation methods

It was assumed that temperature and relative humidity were the same for all systems, and that no mitigation practices were implemented. We also assumed that cattle were not significantly different from the current UK breed types, even though breeding for heat stress tolerance is one of the proposed measures to mitigate effects of climate change on dairy farms.

This paper is looking at over 70 years in the future. If heatwaves were increasing, so yields falling and cattle were suffering, is it valid to assume that farmers will ignore the problem? Would they not learn from areas with more extreme heatwaves in summer elsewhere such as in central Europe? After all in the last 70 years (since the late 1940s) breeding has increased milk yields phenomenally (from AHDB data, milk yields per cow have increased 15% from 2001/2 to 2016/7 alone) so a bit of breeding to cope with heatwaves should be a minor issue.

The Conversation article states the implausible assumptions in a concluding point.

These predictions assume that nothing is done to mitigate the problems of heat stress. But there are many parts of the world that are already much hotter than the UK where milk is produced, and much is known about what can be done to protect the welfare of the animals and minimise economic losses from heat stress. These range from simple adaptations, such as the providing shade, to installing fans and water misting systems.

Cattle breeding for increased heat tolerance is another potential, which could be beneficial for maintaining pasture-based systems. In addition, changing the location of farming operations is another practice used to address economic challenges worldwide.

What is not recognized here is that farmers in a competitive market have to adapt in the light of new information to stay in business. That is the authors are telling farmers what they will be fully aware of to the extent that their farms conform to the average. Effectively assuming people and dumb, then telling them obvious, is hardly going to get those people to take on board one’s viewpoints.

Certainty of global warming

The Conversation article states

Using 11 different climate projection models, and 18 different milk production models, we estimated potential milk loss from UK dairy cows as climate conditions change during the 21st century. Given this information, our final climate projection analysis suggests that average ambient temperatures in the UK will increase by up to about 3.5℃ by the end of the century.

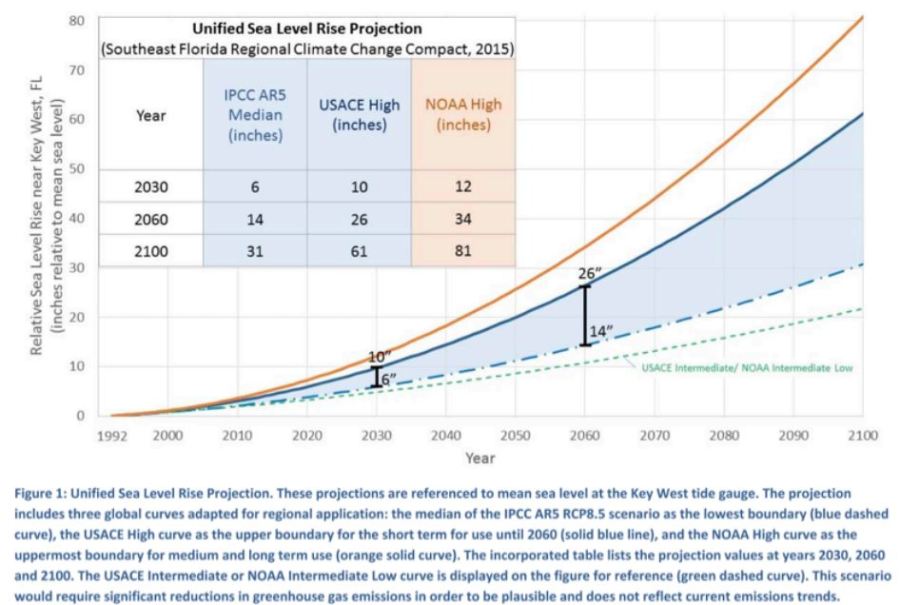
This warming is consistent with the IPCC global average warming projections using RCP8.5 non-mitigation policy scenario. There are two alternative, indeed opposite, perspectives that might lead rational decision-makers to think this quantity of warming is less than certain.

First, the mainstream media, where the message being put out is that the Paris Climate Agreement can constrain global warming to 2°C or 1.5°C above the levels of the mid-nineteenth century. With around 1°C of warming already if it is still possible to constrain additional global warming to 0.5°C, why should one assume that 3.5°C of warming for the UK is more than a remote possibility in planning?

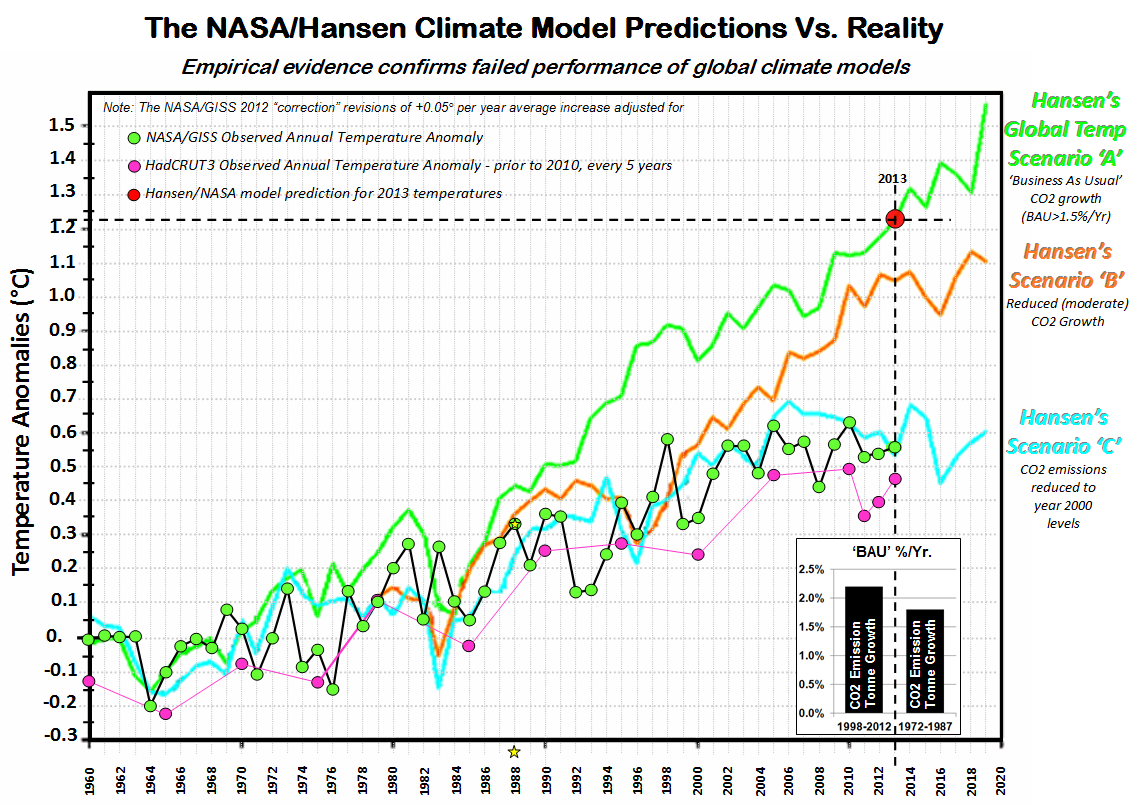
Second, one could look at the track record of global warming projections from the climate models. The real global warming scare kicked-off with James Hansen’s testimony to Congress in 1988. Despite actual greenhouse gas emissions being closely aligned with rapid warming, actual global warming has been most closely aligned with the assumption of the impact of GHG emissions being eliminated by 2000. Now, if farming decision-makers want to still believe that emissions are the major driver of global warming, they can find plenty of excuses for the failure linked from here. But, rational decision-makers tend to look at the track record and thus take consistent decision-makers with more than a pinch of salt.

Planning horizons

The Conversation article concludes

(W)e estimate that by 2100, heat stress-related annual income losses of average size dairy farms in the most affected regions may vary between £2,000-£6,000 and £6,000-£14,000 (in today’s value), in average and extreme years respectively. Armed with these figures, farmers need to begin planning for a hotter UK using cheaper, longer-term options such as planting trees or installing shaded areas.

This compares to the current the UK average annual dairy farm business income of £80,000 according to the PLOS One article.

There are two sides to investment decision-making. There are potential benefits – in this case avoidance of profit loss – netted against the potential benefits. ADHB Dairy gives some figures for the average herd size in the UK. In 2017 it averaged 146 cows, almost double the 75 cows in 1996. In South East England, that is potentially £41-£96 a cow, if the average herd size there is same as the UK average. If the costs rose in a linear fashion, that would be around 50p to just over a pound a year per cow in the most extreme affected region. But the PLOS One article states that costs will rise exponentially. That means there will be no business justification for evening considering heat stress for the next few decades.

For that investment to be worthwhile, it would require the annual cost of mitigating heat stress to be less than these amounts. Most crucially, rational decision-makers apply some sort of NPV calculation to investments. This includes a discount rate. If most of the costs are to be incurred decades from now – beyond the working lives of the current generation of farmers – then there is no rational reason to take into account heat stress even if global warming is certain.

Summary

The Paper Spatially explicit estimation of heat stress-related impacts of climate change on the milk production of dairy cows in the United Kingdom makes a number of assumptions to reach its headline conclusion of decreased milk yields due to heat stress by the end of the century. The assumption of constant prices defies the economic reality that prices fluctuate with changing supply. The assumption of dumb farmers defies the reality of a competitive market, where they have to respond to new information to stay in business. The assumption of 3.5°C warming in the UK can be taken as unlikely from either the belief Paris Climate Agreement with constrain further warming to 1°C or less OR that the inability of past climate projections to conform to the pattern of warming should give more than reasonable doubt that current projections are credible.  Further the authors seem to be unaware of the planning horizons of normal businesses. Where there will be no significant costs for decades, applying any sort of discount rate to potential investments will mean instant dismissal of any consideration of heat stress issues at the end of the century by the current generation of farmers.

Taking all these assumptions together makes one realize that it is quite dangerous for specialists in another field to take the long range projections of climate models and apply to their own areas, without also considering the economic and business realities.

Kevin Marshall 

Why Plan B’s Climate Court Action should be dismissed

Summary

Taking court action to compel Governments to enforce the Paris Climate Agreement is against the real spirit of that Agreement. Controlling global GHG emissions consistent with 2°C, or 1.5°C is only an aspiration, made unachievable by allowing developing countries to decide for themselves when to start reducing their emissions. In the foreseeable future, the aggregate impact of emissions reduction policies will fail to even reduce global emissions. Therefore, costly emissions reductions policies will always end up being net harmful to the countries where they are imposed. Governments wanting to both be players on the world stage and serve their countries give the appearance of taking action of controlling emissions, whilst in substance doing very little. This is the real spirit of the Paris Climate Agreement. To take court action to compel a change of policy action in the name of that Agreement should be struck off on that basis. I use activist group Plan B’s case before the British Court to get the British Government to make even deeper emissions cuts than those under the Climate Change Act 2008.

Plan B’s Case at the High court

Last week BBC’s environment analyst Roger Harrabin reported Court action to save young from climate bill.

The campaigners – known collectively as Plan B – argue that if the UK postpones emissions cuts, the next generation will be left to pick up the bill.

It is seeking permission from a judge to launch formal legal action.

The government has promised to review its climate commitments.

A spokesperson said it was committed to tackling emissions.

But Plan B believes ministers may breach the law if they don’t cut emissions deeper – in line with an international agreement made in Paris at the end of 2015 to restrict global temperature rise to as close to 1.5C as possible.

From an obscure website crowdjustice

Plan B claim that the government is discriminating against the young by failing to cut emissions fast enough. During the hearing, they argued that the UK government’s current target of limiting global temperature rises to 2°C was not ambitious enough, and that the target ought to be lowered to 1.5°C, in line with the Paris Agreement that the UK ratified in 2015. Justice Supperstone postponed the decision until a later date.

Plan B on their own website state

Plan B is supporting the growing global movement of climate litigation, holding governments and corporations to account for climate harms, fighting for the future for all people, all animals and all life on earth.

What is the basis of discrimination?

The widely-accepted hypothesis is that unless global greenhouse gas (GHG) emissions are reduced to near zero in little more than a generation, global average temperature rise will rise more than 2°C above pre-industrial levels. A further hypothesis is that this in turn will cause catastrophic climate change. Consequent on both hypotheses being true gives the case for policy action. Therefore, failure to reduce global GHG emissions will imperil the young.

A further conjecture is that if all signatories to the Paris Agreement fulfil their commitments it is sufficient to prevent 1.5°C or 2°C of warming. There are a number of documents to consider.

First is the INDC submissions (i.e. Nation States communications of their intended nationally determined contributions), collected together at the UNFCCC website. Most are in English.  To find a country submission I suggest clicking on the relevant letter of the alphabet.

Second, to prevent my readers being send on a wild goose chase through small country submissions, some perspective is needed on relative magnitude of emissions. A clear secondary source (but only based on CO2 emissions) BP Data Analysis Global CO2 Emissions 1965-2017. More data on GHG emissions are from the EU Commissions EDGAR Emissions data and the World Resources Institute CAIT Climate Data Explorer.

Third is the empirical scale of the policy issue. The UNEP emissions Gap Report 2017 (pdf), published in October last year is the latest attempt to estimate the scale of the policy issue. The key is the diagram reproduced below.

The total of all commitments will still see aggregate emissions rising into the future. That is, the aggregate impact of all the nationally determined contributions is to see emissions rising well into the future. So the response it to somehow persuade Nations States to change their vague commitments to such an extent that aggregate emissions pathways sufficient to prevent 1.5°C or 2°C of warming?

The relevant way to do this ought to be through the Paris Agreement.

Fourth is the Adoption Paris Agreement itself, as held on the UNFCCC website (pdf).


Paris Agreement key points

I would draw readers to Article 2.1(a)

  • Holding the increase in the global average temperature to well below 2°C above pre-industrial levels and pursuing efforts to limit the temperature increase to 1.5°C above pre-industrial levels, recognizing that this would significantly reduce the risks and impacts of climate change;

Article 2.2

  • This Agreement will be implemented to reflect equity and the principle of common but differentiated responsibilities and respective capabilities, in the light of different national circumstances.

My interpretation is that the cumulative aggregate reduction will be only achieved by if those countries that (in the light of their national circumstances) fail to follow the aggregate pathways, are offset by other countries cutting their emissions by a greater amount. It is a numbers game. It is not just a case of compelling some countries to meet the 1.5°C pathway but to compel them to exceed it by some margin.

I would also draw readers to Article 4.1

In order to achieve the long-term temperature goal set out in Article 2, Parties aim to reach global peaking of greenhouse gas emissions as soon as possible, recognizing that peaking will take longer for developing country Parties, and to undertake rapid reductions thereafter in accordance with best available science, so as to achieve a balance between anthropogenic emissions by sources and removals by sinks of greenhouse gases in the second half of this century, on the basis of equity, and in the context of sustainable development and efforts to eradicate poverty.

My reading is that any country defined as “developing” has only an aim of reducing emissions after peaking of their emissions. When they choose to do so depends on a number of criteria. There is not clear mechanism for deciding this, and no surrender of decision-making by countries to external bodies.

Implications of the Paris Agreement

Many developing countries emissions are increasing their emissions. They agreement does not compel them to change course in the near future. Empirically that means to achieve the goals the aggregate emission reductions of countries reducing their emissions must be such that they cancel out the emissions increases in the developing countries. Using EDGAR figures for GHG emissions, and the Rio Declaration 1992 for developing countries (called Non-Annex countries) I estimate they accounted for 64% of global GHG emissions in 2012, the latest year available.


All other sources sum to 19 GtCO2e, the same as the emissions gap between the unconditional INDC case and the 1.5°C case. This presents a stark picture. Even if emissions from all other sources are eliminated by 2030, AND the developing countries do not increase their emissions to 2030, cumulative global emissions are very likely to exceed the 1.5°C and the 2°C warming targets unless the developing countries reduce their emissions rapidly after 2030. That is close down fairly new fossil fuel power stations; remove from the road millions of cars, lorries and buses; and reduce the aspirations of the emerging middle classes to improving life styles. The reality is quite the opposite. No new policies are on the horizon that would significantly reduce global GHG emissions, either from the developed countries in the next couple of years, or the developing countries to start in just over a decade from now. Reading the comments in the INDC emissions (e.g. Indonesia, Pakistan, India), a major reason is that these governments are not willing to sacrifice the futures of their young through risking economic growth and political stability to cut their emissions. So rather than Plan B take the UK Government  to a UK Court, they should be persuading those Governments who do not share their views (most of them) of the greater importance of their case. After all, unlike proper pollution (such as smoke), it does not matter where the emissions are generated in relation to the people affected.

It gets worse. It could be argued that the countries that most affected by mitigation policies are not the poorest seeing economic growth and political stability smashed. It is the fossil fuel dependent countries. McGlade and Ekins 2015 (The geographical distribution of fossil fuels unused when limiting global warming to 2°C) estimated, said to achieve even 2°C target 75% of proven reserves and 100% of new discoveries must be left in the ground. Using these global estimates and the BP estimated proven reserves of fossil fuels I created the following apportionment by major countries.


The United States has the greatest proven fossil fuel reserves in terms of potential emissions. But if one looks at fossil fuel revenues relative to GDP, it is well down the league table. To achieve emission targets countries such like Russia, Saudi Arabia, Kuwait, Turkmenistan, Iraq, and Iran must all be persuaded to shut down their down sales of fossil fuels long before the reserves are exhausted, or markets from developing countries dry up. To do this in a generation would decimate their economies. However, given the increase in fossil fuel usage from developing countries, and the failure of developed countries to significantly reduce emissions through policy this hardly seems a large risk.

However, this misses the point. The spirit of the Paris Agreement is not to cut emissions, but to be seen to be doing something about climate change. For instance, China were held up by the likes of President Obama for aiming to both top out its emissions by 2030, and reduce emissions per unit of GDP. The USA and the EU did this decades ago, so China’s commitments are little more than a Business-as-usual scenario. Many other countries emissions reduction “targets” are attainable without much actual policy. For example, Brazil’s commitment is to “reduce greenhouse gas emissions by 43% below 2005 levels in 2030.” It sounds impressive, until one reads this comment under “Fairness and Ambition

Brazil’s current actions in the global effort against climate change represent one of the largest undertakings by any single country to date, having reduced its emissions by 41% (GWP-100; IPCC SAR) in 2012 in relation to 2005 levels.

Brazil intends to reduce emissions by a further 2% compared to 2005 levels. Very few targets are more than soft targets relative to current or projected trends. Yet the outcome of COP21 Paris enabled headlines throughout the world to proclaim a deal had been reached “to limit global warming to “well below” 2C, aiming for 1.5C”. It enables most Governments to juggle being key players on a world stage, have alarmists congratulating them on doing their bit on saving the planet, whilst making sure that serving the real needs of their countries is not greatly impeded. It is mostly win-win as long as countries do not really believe that targets are achievable. This is where Britain has failed. Under Tony Blair, when the fever of climate alarmism at its height, backed up by the political spin of New Labour and a Conservative opposition wanting to ditch its unelectable image, Green activists wrote the Climate Change Act 2008 with the strict targets to be passed. Britain swallowed climate alarmism whole, and now as a country that keep its promises is implementing useless and costly policies. But they have kept some form of moderation in policies until now. This is illustrated by a graphic from a Committee on Climate Change report last week “Reducing UK emissions 2018 – Progress Report to Parliament” (pdf) (and referenced at cliscep)

Whilst emissions have come down in the power sector they are flat in transport, industry and in buildings. Pushing real and deep reductions in these sectors means for young people pushing up the costs of motoring (placing driving a car out of the reach of many), of industry (raising costs relative to the countries – especially the non-policy developing countries) and buildings in a country where planning laws make home-owning unaffordable for many and where costs of renting is very high. This on top of further savings in the power industry will be ever more costly as the law of diminishing returns sets in. Forcing more urgent policy actions will increase the financial and other burdens on the young people of today, but do virtually nothing to reach the climate aspirations of the Paris Agreement due to Britain now having less than 1% of global emissions. The Government could be forced out of political fudging to impose policies that will be net harmful to the young and future generations.

Plan B are using an extreme activist interpretation. As reported in Climate Home News after the postponement.

“The UK is not doing enough,” Tim Crosland, director of Plan B told Climate Home News. “The benchmark target is now out of place. We are arguing that it is a breach of human rights.”

The UK has committed to cut emissions by at least 80% of 1990 levels by 2050, with an aim to limit global temperature rise to 2C.

Under the 2008 Climate Change Act, the secretary can revise the target to reflect significant developments in climate change science or in international law or policy.

Plan B want to see the target lowered to be in line with 1.5C, the lower target of the Paris Agreement, which the UK ratified in 2016.

As stated, insofar as the Paris Climate Agreement is a major development of policy, it is one of appearing to do a lot whilst doing very little. By these terms, the stronger case is for repealing the Act, not strengthening its clauses. 

But what if I am wrong on this Paris Agreement being just an exercise in appearances? This then it should be recognized that developing countries will only start to reduce their emissions at some time in the future. By implication, for the world to meet the 1.5°C warming limit, developing countries should be pursuing and emissions reduction pathway much steeper than the 25% reduction between 2015 and 2030 implied in the Emissions GAP Report graphic. It should be at least 50% and nearer 100% in the next decade. Given that the Climate Change Act was brought in so that Britain could lead the world on climate change, Plan B should be looking for a 100% reduction by the end of the year. 

Kevin Marshall


Hansen et al 1988 Global Warming Predictions 30 Years on

Last month marked the 30th anniversary of the James Hansen’s Congressional Testimony that kicked off the attempts to control greenhouse gas emissions. The testimony was clearly an attempt, by linking human greenhouse emissions to dangerous global warming, to influence public policy. Unlike previous attempts (such as by then Senator Al Gore), Hansen’s testimony was hugely successful. But do the scientific projections that underpinned the testimony hold up against the actual data? The key part of that testimony was a graph from the Hansen et al 1988* Global climate changes as forecast by Goddard Institute for Space Studies three-dimensional model, produced below.

Figure 1: Hansen et al 1988 – Figure 3(a) in the Congressional Testimony

Note the language of the title of the paper. This is a forecast of global average temperatures contingent upon certain assumptions. The ambiguous part is the assumptions.

The assumptions of Hansen et. al 1988

From the paper.

4. RADIATIVE FORCING IN SCENARIOS A, B AND C

4.1. Trace Gases

  We define three trace gas scenarios to provide an indication of how the predicted climate trend depends upon trace gas growth rates. Scenarios A assumes that growth rates of trace gas emissions typical of the 1970s and 1980s will continue indefinitely; the assumed annual growth averages about 1.5% of current emissions, so the net greenhouse forcing increase exponentially. Scenario B has decreasing trace gas growth rates, such that the annual increase of the greenhouse climate forcing remains approximately constant at the present level. Scenario C drastically reduces trace gas growth between 1990 and 2000 such that the greenhouse climate forcing ceases to increase after 2000.

Scenario A is easy to replicate. Each year increase emissions by 1.5% on the previous year. Scenario B assumes that growth emissions are growing, and policy takes time to be enacted. To bring emissions down to the current level (in 1987 or 1988), reduction is required. Scenario C one presumes are such that trace gas levels are not increasing. As trace gas levels were increasing in 1988 and (from Scenario B) continuing emissions at the 1988 level would continue to increase atmospheric levels the levels of emissions would have been considerably lower than in 1988 by the year 2000. They might be above zero, as small amounts of emissions may not have an appreciable impact on atmospheric levels.

The graph formed Fig. 3. of James Hansen’s testimony to Congress. The caption to the graph repeats the assumptions.

Scenario A assumes continued growth rates of trace gas emissions typical of the past 20 years, i.e., about 1.5% yr-1 emission growth; scenario B has emission rates approximately fixed at current rates; scenario C drastically reduces traces gas emissions between 1990 and 2000.

This repeats the assumptions. Scenario B fixes annual emissions at the levels of the late 1980s, whilst scenario C sees drastic emission reductions.

James Hansen in his speech gave a more succinct description.

We have considered cases ranging from business as usual, which is scenario A, to draconian emission cuts, scenario C, which would totally eliminate net trace gas growth by year 2000.

Note that the resultant warming from fixing emissions at the current rate (Scenario B) is much closer in warming impacts to Scenario A (emissions growth of +1.5% year-on-year) than Scenario C that stops global warming. Yet Scenario B results from global policy being successfully implemented to stop the rise in global emissions.

Which Scenario most closely fits the Actual Data?

To understand which scenario most closely fits the data, we need to look at that trace gas emissions data. There are a number of sources, which give slightly different results. One source, and that which ought to be the most authoritative, is the IPCC Fifth Assessment Report WG3 Summary for Policy Makers graphic SPM.1 is reproduced in Figure 2.

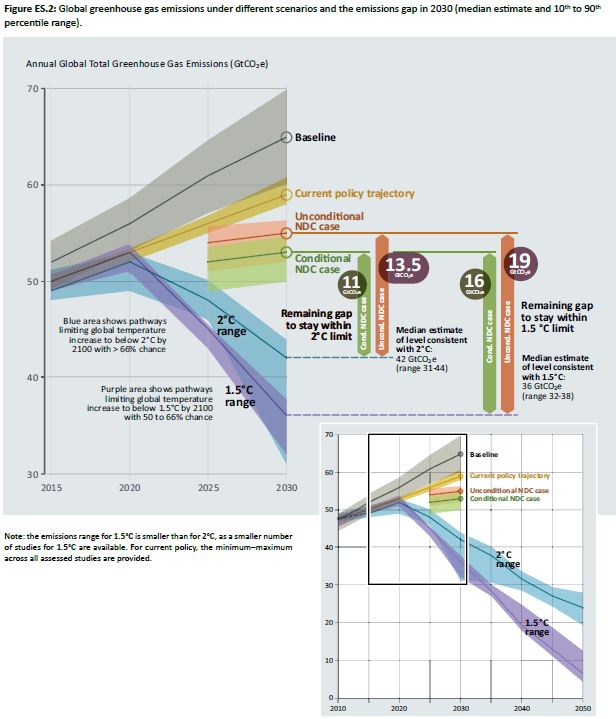
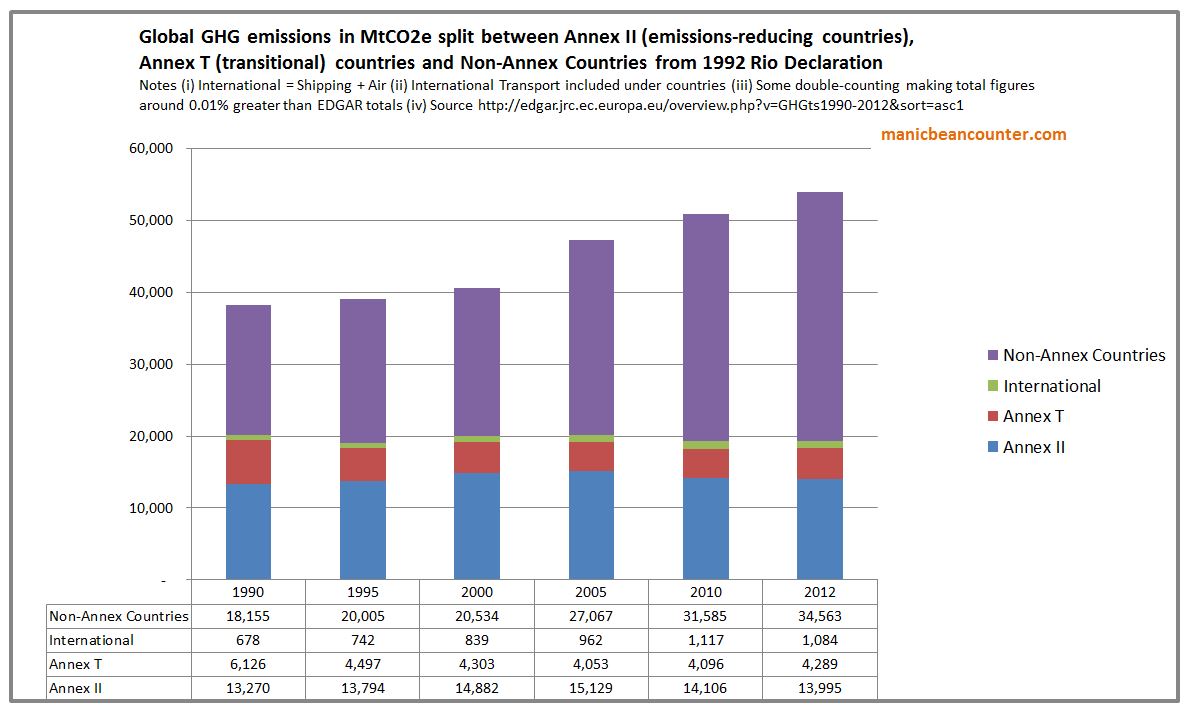
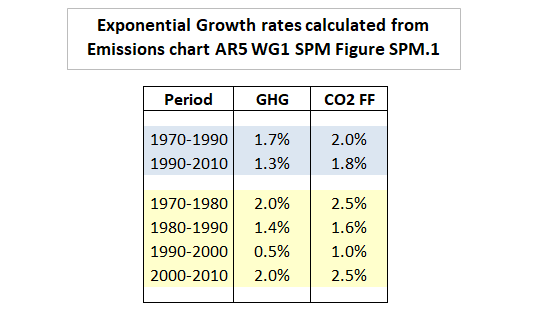
 Figure 2 : AR5 WG3 SPM.1 Total annual anthropogenic GHG emissions (GtCO2eq/yr) by groups of gases 1970-2010. FOLU is Forestry and Other Land Use.

Note that in Figure 2 the other greenhouse gases – F-Gases, N2O and CH4 – are expressed in CO2 equivalents. It is very easy to see which of the three scenarios fits. The historical data up until 1988 shows increasing emissions. After that data emissions have continued to increase. Indeed there is some acceleration, stated on the graph comparing 2000-2010 (+2.2%/yr) with 1970-2000 (+1.3%/yr) . In 2010 GHG emissions growth were not similar to those in the 1980s (about 35 GtCO2e) but much higher. By implication, Scenario C, which assumed draconian emissions cuts is the furthest away from the reality of what has happened. Before considering how closely Scenario A compares to temperature rise, the question is therefore how close actual emissions have increased compared to the +1.5%/yr in scenario A.

From my own rough calculations, total GHG emissions from 1990 to 2010 rose about 29% or 1.3% a year, compared to 41% or 1.7% a year in the period 1970 to 1990. Exponential growth of 1.3% is not far short of the 1.5%. The assumed 1.5% growth rates would have resulted in 2010 emissions of 51 GtCO2e instead of the 49 GtCO2e estimated, well within the margin of error. That is actual trends over 20 years were pretty much the business as usual scenario. The narrower CO2 emissions from fossil fuels and industrial sources from 1990 to 2010 rose about 42% or 1.8% a year, compared to 51% or 2.0% a year in the period 1970 to 1990, above the Scenario A.

The breakdown is shown in Figure 3.

Figure 3 : Rough calculations of exponential emissions growth rates from AR5 WG1 SPM Figure SPM.1 

These figures are somewhat out of date. The UNEP Emissions Gap Report 2017 (pdf) estimated GHG emissions in 2016 at 51.9 GtCO2e. This represents a slowdown in emissions growth in recent years.

Figure 4 shows are the actual decadal exponential growth trends in estimated GHG emissions (with a linear trend to the 51.9 GtCO2e of emissions in 2016 from the UNEP Emissions Gap Report 2017 (pdf)) to my interpretations of the scenario assumptions. That is, from 1990 in Scenario A for 1.5% annual growth in emissions; in Scenario B for emissions to reduce from 38 to 35 GtCO2e in(level of 1987) in the 1990s and continue indefinitely: in Scenario C to reduce to 8 GtCO2e in the 1990s.

Figure 4 : Hansen et al 1988 emissions scenarios, starting in 1990, compared to actual trends from UNIPCC and UNEP data. Scenario A – 1.5% pa emissions growth; Scenario B – Linear decline in emissions from 38 GtCO2e in 1990 to 35 GtCO2e in 2000, constant thereafter; Scenario C – Linear decline  in emissions from 38 GtCO2e in 1990 to 8 GtCO2e in 2000, constant thereafter. 

This overstates the differences between A and B, as it is the cumulative emissions that matter. From my calculations, although in Scenario B 2010 emissions are 68% of Scenario A, cumulative emissions for period 1991-2010 are 80% of Scenario A.

Looking at cumulative emissions is consistent with the claims from the various UN bodies, that limiting to global temperature rise to 1.5°C or 2.0°C of warming relative to some point is contingent of a certain volume of emissions not been exceeded. One of the most recent the key graphic from the UNEP Emissions Gap Report 2017.

Figure 5 : Figure ES.2 from the UNEP Emissions Gap Report 2017, showing the projected emissions gap in 2030 relative to 1.5°C or 2.0°C warming targets. 

Warming forecasts against “Actual” temperature variation

Hansen’s testimony was a clear case of political advocacy. By making Scenario B constant the authors are making a bold policy statement. That is, to stop catastrophic global warming (and thus prevent potentially catastrophic changes to climate systems) requires draconian reductions in emissions. Simply maintaining emissions at the levels of the mid-1980s will make little difference. That is due to the forcing being related to the cumulative quantity of emissions.

Given that the data is not in quite in line with scenario A, if the theory is correct, then I would expect:-

  1. Warming trend to be somewhere between Scenario A and Scenario B. Most people accept 4.2equilibrium climate sensitivity of the Hansen model was 4.2ºC for a doubling of CO2 was too high. The IPCC now uses 3ºC for ECS. More recent research has it much lower still. However, although the rate of the warming might be less, the pattern of warming over time should be similar.
  2. Average temperatures after 2010 to be significantly higher than in 1987.
  3. The rate of warming in the 1990s to be marginally lower than in the period 1970-1990, but still strongly positive.
  4. The rate of warming in the 2000s to be strongly positive marginally higher than in the 1990s.

From the model Scenario C, there seems to be about a five year lag in the model between changes in emission rates and changes in temperatures. However, looking at the actual temperature data there is quite a different warming pattern. Five years ago C3 Headlines had a post 2013: The NASA/Hansen Climate Model Prediction of Global Warming Vs. Climate Reality.  The main graphic is in Figure 6

Figure 6 : C3 Headlines – NASA Hansen Prediction Vs Reality

The first thing to note is that the Scenario Assumptions are incorrect. Not only are they labelled as CO2, not GHG emissions, but are all stated wrongly. Stating them correctly would show a greater contradiction between forecasts and reality. However, the Scenario data appears to be reproduced correctly, and the actual graph appears to be in line with a graphic produced last month by Gavin Schmidt last month in his defense of Hansen’s predictions.

The data contradicts the forecasts. Although average temperatures are clearly higher than in in 1987, they are not in line with the forecast of Scenario A which is closest to the actual emissions trends. The rise is way below 70% of the model implied by inputting the lower IPCC climate sensitivity, and allowing for GHG emissions being fractional below the 1.5% per annum of Scenario A. But the biggest problem is where the main divergence occurred. Rather than warming accelerating slightly in the 2000s (after a possible slowdown in the 1990s),  there was no slowdown in the 1990s, but it either collapsed to zero, or massively reduced, depending on the data set was used. This is in clear contradiction of the model. Unless there is an unambiguous and verifiable explanation (rather than a bunch of waffly and contradictory excuses ), the model should be deemed to be wrong. There could be natural and largely unknown natural factors or random data noise that could explain the discrepancy. But equally (and quite plausibly) those same factors could have contributed to the late twentieth century warming.

This simple comparison has an important implication for policy. As there is no clear evidence to link most of the observed warming to GHG emissions, by implication there is no clear support for the belief that reducing GHG emissions will constrain future warming. But reducing global GHG emissions is merely an aspiration. As the graphic in Figure 5 clearly demonstrates, over twenty months after the Paris Climate Agreement was signed there is still no prospect of aggregate GHG emissions falling through policy. Hansen et. al 1988 is therefore a double failure; both as a scientific forecast and a tool for policy advocacy in terms of reducing GHG emissions. If only the supporters would realize their failure, and the useless and costly climate policies could be dismantled.

Kevin Marshall

*Hansen, J., I. Fung, A. Lacis, D. Rind, S. Lebedeff, R. Ruedy, G. Russell, and P. Stone, 1988: Global climate changes as forecast by Goddard Institute for Space Studies three-dimensional model. J. Geophys. Res., 93, 9341-9364, doi:10.1029/JD093iD08p09341.

President Trumps Tweet on record cold in New York and Temperature Data

As Record-breaking winter weather grips North-Eastern USA (and much of Canada as well) President Donald Trump has caused quite a stir with his latest Tweet.

There is nothing new in the current President’s tweets causing controversy. This is a hard-hitting one has highlights a point of real significance for AGW theory. After decades of human-caused global warming, record cold temperatures are more significant than record warm temperatures. Record cold can be accommodated within the AGW paradigm by claiming greater variability in climate resultant on the warming. This would be a portent of the whole climate system being thrown into chaos once some tipping point had been breached. But that would also require that warm records are
(a) far more numerous than cold records and
(b) Many new warm records outstrip the old records of a few decades ago by a greater amount than the rise in average temperatures in that area.
I will illustrate with three temperature data sets I looked at a couple of years ago – Reykjavík, Iceland and Isfjord Radio and Svalbard Airport on Svalbard.

Suppose there had been an extremely high and an extremely low temperature in 2009 in Reykjavík. For the extreme high temperature to be a record it would only have to be nominally higher than a record set in 1940 to be a new record. The unadjusted average anomaly data is the same. If the previous record had been set in say 1990, a new high record would only be confirmation of more extreme climate if it was at least 1C higher than the previous record. But a new cold record in 2009 could be up to 1C higher than a 1990 low record to count as greater climate extremes. Similarly in the case of Svalbard Airport, new warm records in 2008 or 2009 would need to be over 4C higher than records set around 1980, and new cold records would need to be up to 4C higher than records set around 1980 to count as effective new warm and cold records.
By rebasing in terms of unadjusted anomaly data (and looking at monthly data) a very large number of possible records could be generated from one temperature station. With thousands of temperature stations with long records, it is possible to generate a huge number of “records” to analyze if the temperatures are becoming more extreme. But absolute record cold records should be few and far between. However, if relative cold records outstrip relative warm records, then there are questions to be asked of the average data. Similarly, if there were a lack of absolute records or a decreasing frequency of relative records, then the beliefs in impending climate chaos would be undermined.

I would not want to jump ahead with the conclusions. The most important element is to mine the temperature data and then analyze the results in multiple ways. There are likely to be surprises that could enhance understanding of climate in quite novel ways.

Kevin Marshall

Climate Necessity Defense for Minnesotan Valve Turners

Unlike the Michael Foster and other co-defendants is North Dakota, the Minnesotan Valve-Turners Emily Johnston and Annette Klapstein get their chance to present the Climate Necessity Defense. From TownHall.com (Hat tip Science Matters)

Klapstein, a retired lawyer, said they know of one case in which a judge allowed evidence about climate change but then told the jury to disregard it.

“It looks like we’re going to be able to bring in all our experts and present our evidence of how dire climate change is, so we’re pretty excited about that,” she said.

As a retired attorney, she perhaps should have read the criteria before responding.

In an order Friday, Clearwater County District Judge Robert Tiffany said the four defendants must clear a high legal bar.

In Minnesota, Tiffany wrote, a defendant asserting a necessity defense “must show that the harm that would have resulted from obeying the law would have significantly exceeded the harm actually caused by breaking the law, there was no legal alternative to breaking the law, the defendant was in danger of imminent physical harm, and there was a direct causal connection between breaking the law and preventing the harm.

The judge said it applies “only in emergency situations where the peril is instant, overwhelming, and leaves no alternative but the conduct in question.

This appears fairly clear. The Judge lays down four criteria to be met within an overriding one of emergency situations with no alternative. It is the legal equivalent of demanding that the positive impacts of an action greatly exceed the harms in very specific, very short-term, circumstances. Further, it is up to the defense to demonstrate that the circumstances apply, convincing the court in the face of cross-examinations.

There are a number of areas where I believe climate activists actions not only fails to meet these criteria, but does not even get anywhere close.

The timing issue

The emergency situations criteria are pretty immediate. An example is a police officer shooting dead a rampaging terrorist rather than maiming and performing an arrest. Another example might be destroying the car keys of someone who is drunk and intent on driving. The very short time scales of seconds or minutes exclude options that would take months or years to implement.  There are examples of where such an emergency situation does not apply to climate change policies.

If prominent climate activist Prince Charles was correct in saying in October 2009 that we have less than 100 months to save the planet, it would not have been considered an instant peril. With three months to go until the deadline, even that appears to be somewhat alarmist in the context of a lack of increase of signals of impending catastrophic consequences.

Another source is from the pinnacle of the climate establishment. The IPCC AR5 Synthesis Report gave a very rough guide to how much CO2 (or equivalent greenhouse gases) could be emitted to limit warming to less than 2°C. From 2012 it was about 1000 GtCO2e. This flowing is part of a presentation to summarize the IPCC AR5 Synthesis Report of 2014. Slide 33 of 35.

A more recent source is Miller et al 2017 Nature GeoScience. They estimate that 240 GtC (880 GtCO2e) from now will be needed to reach 1.5°C of warming. On the IPCC’s estimate then with slightly over 50GtCO2e of emissions per annum, the 2°C of warming would be reached sometime before 2032, when the climate experts are now saying the lower 1.5°C barrier will be reached sometime before 2035. Whichever you use as the barrier for breaching of dangerous climate change, that level will not be reached anytime soon according to the climate experts. There is plenty of time for a few more, tense, annual meetings with representatives of 195 nations to pontificate about mitigation policies.

So even if extreme climate alarmism is true, the expert opinion on policy strongly implies that the defendants were not “in danger of imminent physical harm”.

Finally, in 2008 the climate necessity defense was supported by James Hansen in a couple of British court cases. The detailed document prepared as written testimony for the Ratcliffe Nottingham trial is here and a 2011 commentary on the two cases by Hansen is here. As the supposed emergency in global emissions have not appeared in eight years between the testimony and the felony why should it be still considered a pressing problem? James Hansen, sometimes referred to as the Father of Climate Change after his 1988 Congressional Testimony pushed Global Warming to the fore of the political agenda, is likely to be the key witness in the necessity defence. He would have been the key witness at the trial of Micheal Foster in North Dakota last month if the necessity defense had been allowed. After the Foster Trial, Hansen wrote a long article, including arguments that will likely be presented at the Johnston and Klapstein Trail.

Indivisibility Issues

Many people in the United States believe that abortion is murder. Suppose a group managed to close down a busy abortion clinic by constant blockades and intimidation, throwing a number of people of work. An argument could be made that some of the women will not get abortions elsewhere, but will instead give birth to a child. The necessity defense criteria could, therefore, be operable. But with respect to global warming the evidence shows (and the science agrees) that it does not matter where in the world fossil fuels are burnt, the generated CO2 will be dispersed affecting the whole atmosphere. Otherwise, Eastern USA and Eastern China would have much higher concentrations of CO2 than in Africa, Antarctica or over the oceans that cover 70% of the earth’s surface.  Neither does that CO2 leave the atmosphere quickly but could remain in the atmosphere for many decades or even centuries. Therefore, the marginal impact delaying the transportation of one type of fossil fuel in one country for a few hours will have no significant impact on generations of people yet to come. As a rough estimate, the combined actions of the valve-turners (of which Micheal Foster on the Keystone Pipeline was by far the biggest contribution), was to delay the transportation of less than a million barrels of oil. That is to delay the transportation of around 1% of the daily global output of about 92 million barrels. A million barrels (140,000 tonnes) will produce around 400,000 tonnes of CO2. That is 0.4 million tonnes or 0.0004 billion tonnes. This 0.0004 GtCO2 is 0.00004% of the 1000 GtCO2e (million million) of emissions by the IPCC to breach the dangerous 2°C of warming barrier. The impact of Valve-Turners Emily Johnston and Annette Klapstein is somewhat less than this. The difference between “the harm that would have resulted from obeying the law” and “the harm actually caused by breaking the law” is infinitesimally small.

Local Harms, Wider Benefits

There is another set of harms to be considered.  That is the immediate costs of property damage and business disruption from the activists’ actions, along with the time and expense of law enforcement. Even if the action could be shown to have benefits exceeding the costs, for the actual persons or entities targeted that position will be reversed. So, hypothetically, if the benefits of stopping a few hundred thousand tonnes of emissions are even $100,000,000, and the immediate costs are just $1,000,000, the benefits are across the planet decades or centuries in the future and shared by tens of billions of people, whilst the costs are immediate and disproportionately borne by very few victims that the activists select. In reality, the benefits are likely far less, and the full costs somewhat more.

The catalyst effect of the action

As this was an act of climate activism, there was probably no intention that this act would stop climate change. Rather, that the act could serve as a catalyst for action to constrain emissions. It could serve as a wake-up call to policy-makers. A year later it is possible to see any impacts.

In the United States, less than a month after the valve turners did their deeds Donald Trump was elected President and subsequently has begun to rescind climate change policies. There appears to have been no impact on the Presidential elections. If it had, then criminal acts would have influenced the election, something that would have undermined the democratic process.

Another justification could be one of a catalyst for many more criminal actions. Again, there seems to be no surge in climate activism, whether through legal or illegal means does not seem to have happened. Further, lawyers might caution against using the catalyst argument in court to defend criminal acts.

So the catalyst defense (which may not be admissible under Judge Tiffany’s criteria) doesn’t seem to have worked out.

Non-exhaustion of legal policy initiatives

Judge Tiffany’s final specification was

leaves no alternative but the conduct in question.

Was there no alternative? There are two basic criteria necessary, but not sufficient, for the necessity defense to justify an otherwise illegal activity. First, that legal alternatives have been exhausted and second, that the illegal alternative has at least an expectation of being remotely effective. As already stated, the consensus believes that to prevent catastrophic climate change means permanently eliminating global greenhouse gas emissions. With respect to the burning of fossil fuels (about two-thirds of global GHG emissions), this is on the twin fronts of reducing global emissions to near zero and ensuring permanently leaving fossil fuels in the ground.

Possibilities for closing the policy gap

The global efforts to reduce global GHG emissions culminated in the Paris Agreement, written at the end of December 2015 and signed by most countries. The Adoption of the Paris Agreement proposal; Section II, Point 17 notes gives an indication of the gap between the aggregate impact of all the vague policy initiatives and the desired policy goal.

17. Notes with concern that the estimated aggregate greenhouse gas emission levels in 2025 and 2030 resulting from the intended nationally determined contributions do not fall within least-cost 2˚C scenarios but rather lead to a projected level of 55 gigatonnes in 2030, and also notes that much greater emission reduction efforts will be required than those associated with the intended nationally determined contributions in order to hold the increase in the global average temperature to below 2˚C above pre-industrial levels by reducing emissions to 40 gigatonnes or to 1.5˚C above pre-industrial levels by reducing to a level to be identified in the special report referred to in paragraph 21 below;

In a post last month I adapted a graphic produced by the UNFCCC in the run-up to Paris COP21 to show the gap between actual policy proposals and the Millar et al 2017 estimates to prevent 1.5˚C of warming being breached.

The aggregate impact of all policy ambitions if fully implemented fall a long way short of the targets. The majority is not due to the United States, or other Western Countries, failing to reduce emissions at a fast enough rate, but the developing countries increasing their emissions, rather than cutting emissions. When compared with  protests against President Trump’s policies (in a country with less than one-eighth of global emissions and a falling share of the total) there are no mass protests outside the embassies of Asian, Middle Eastern, African or South American countries, with over 80% if the global population and which collectively account for 100% of the growth in emissions between 1990 and 2012. Yet these countries have no expressed intention of reducing their emissions commensurate with the policy pathways. Criminal acts in the USA will do nothing to change this.

Leaving Fossil Fuels in the Ground

Arguments for targeting the output of Canadian tar sands include

(a) per unit of energy, it creates higher emissions than oil from say, Saudi Arabia.

(b) there are vast unproven reserves of oil in Canada that may exceed the current global proven reserves.

These aspects I will deal with in depth in a follow-up post. However, the two statements above are true. There are, however, wider policy aspects. Shutting down some of the global production of oil (and raising the price of oil) could increase the usage of coal instead. Push the price high enough and there will generate economic incentives to convert coal to liquids, a process that involves the generation of a number of times the CO2 emissions as from generating energy direct from oil alone.

The wider aspect is whether shutting down some proven reserves make available much less than the 1000 GtCO2e of emissions that would supposedly cause dangerous climate change. McGlade and Ekins 2015 (The geographical distribution of fossil fuels unused when limiting global warming to 2°C) estimate that the proven global reserves around 2900 GtCO2e. There is no clear breakdown by country, so I input their values of CO2 per unit into the BP’s estimates of global reserves of oil, gas and coal, coming up with a similar 2800 GtCO2e. These represent roughly 50 years of oil and gas supply and 120 years of coal supply at current usage rates. Taking into account other GHG emissions, to achieve the emissions target around 75% of proven reserves and 100% of any future discoveries must be left in the ground. I have produced a chart of the countries where these proven resources lie, measured in terms of CO2 produced from burning for energy.

McGlade and Ekins further estimate there are unproven but likely reserves of oil, gas and coal represent a further 8000 GtCO2e of emissions. Shutting down the Tar Sands permanently will not stop production of fossil fuels elsewhere in the world, particularly in the Middle East, Russia and other Asian countries.

Conclusion

There are a number of reasons that on their own ought to fail the necessity defense criteria laid down by Clearwater County District Judge Robert Tiffany last month. 

First, the climate experts at the UNIPCC, and the policy-promotors at the UNFCCC do not believe there is an imminent emergency. They estimate the threshold to dangerous climate change will not be crossed for over a decade.

Second, the cause of dangerous climate change is meant to the rise in global greenhouse levels, caused by global human greenhouse gas emissions. Shutting down fossil fuel emissions will not stop the harms in that area.

Third, the harms inflicted on the victims of the action are local, whereas any benefits in reduced emissions are global. But there is no evidence of the activists realizing this by campaigning for policy changes in other countries on anything like the level in the USA. The activist’s actions single out a particular source and are thus discriminatory.

Fourth, although the various actions on the same day stopped a vast amount of oil being moved, it was tiny in relation to oil the fossil being produced. Further, oil is only a minority source of all global greenhouse gas emissions.

Fifth, there is a large recognized global policy gap between forecast emissions if current policy proposals are fully enacted and the desired emissions pathways commensurate with 1.5°C or 2°C of warming. To meet these global pathways all countries must participate, but the evidence is that countries with over 80% of the global population have no expressed intention to get anywhere close to these policy criteria. Further, meeting the policy criteria would mean that the vast majority of proven reserves of fossil fuels are left in the group, along with any unproven reserves. Given the geographical dispersion of the proven reserves, this is not going to happen.

The principal theme that undermines the climate necessity defense is that the marginal impact of the action of shutting down a pipeline (or even a number of pipelines) is infinitesimally small compared to the required solution. For this reason, the necessity defense is still not valid even if (contrary to all the research to date) it can be proved beyond reasonable doubt that catastrophic climate changes will happen without rapid reductions in global emissions.

Kevin Marshall


The Policy Gap in Achieving the Emissions Goals

The Millar et al. 2017 has severe problems with the numbers, as my previous post suggested. But there is a more fundamental problem in achieving emissions goals. It is contained in the introductory paragraphs to an article lead author Richard Millar posted at Carbon Brief

The Paris Agreement set a long-term goal of limiting global warming to “well-below” 2C above pre-industrial levels and to pursue efforts to restrict it to 1.5C.

A key question for the upcoming rounds of the international climate negotiations, particularly when countries review their climate commitments next year, is exactly how fast would we have to cut emissions to reach these goals?

In a new paper, published in Nature Geoscience, we provide updated estimates of the remaining “carbon budget” for 1.5C. This is the total amount of CO2 emissions that we can still emit whilst limiting global average warming to 1.5C.

Our estimates suggest that we would have a remaining carbon budget equivalent to around 20 years at current emissions rates for a 2-in-3 chance of restricting end-of-century warming to below 1.5C.

This suggests that we have a little more breathing space than previously thought to achieve the 1.5C limit. However, although 1.5C is not yet a geophysical impossibility, it remains a very difficult policy challenge.

The problem is with the mixing of singular and plural statements. The third paragraph shows the problem.

In a new paper, published in Nature Geoscience, we provide updated estimates of the remaining “carbon budget” for 1.5C. This is the total amount of CO2 emissions that we can still emit whilst limiting global average warming to 1.5C.

In the first sentence, the collective “we” refers to the ten authors of the paper. That is Richard J. Millar, Jan S. Fuglestvedt, Pierre Friedlingstein, Joeri Rogelj, Michael J. Grubb, H. Damon Matthews, Ragnhild B. Skeie, Piers M. Forster, David J. Frame & Myles R. Allen.  In the second sentence, the collective “we” refers to approximately 7500 million people on the planet, who live about 195 countries. Do they speak for all the people in Russia, India, Nigeria, Iran, Iraq, China, Taiwan, North and South Korea, the United States and Australia for instance? What I would suggest is they are speaking figuratively about what they believe the world ought to be doing.

Yet the political realities are that even though most countries have signed the Paris Agreement, it does not commit them to a particular emissions pathway, nor to eliminate their emissions by a particular date. It only commits them to produce further INDC submissions every five years, along with attending meetings and making the right noises. Their INDC submissions are not scrutinized, still less sent back for “improved ambition” if they are inadequate in contributing to the aggregate global plan.

Looking at the substance of the Adoption proposal of the Paris Agreement, section II, point 17 notes gives an indication of the policy gap.

17. Notes with concern that the estimated aggregate greenhouse gas emission levels in 2025 and 2030 resulting from the intended nationally determined contributions do not fall within least-cost 2 ˚C scenarios but rather lead to a projected level of 55 gigatonnes in 2030, and also notes that much greater emission reduction efforts will be required than those associated with the intended nationally determined contributions in order to hold the increase in the global average temperature to below 2 ˚C above pre-industrial levels by reducing emissions to 40 gigatonnes or to 1.5 ˚C above pre-industrial levels by reducing to a level to be identified in the special report referred to in paragraph 21 below;

But the actual scale of the gap is best seen from the centerpiece graphic of the UNFCCC Synthesis report on the aggregate effect of INDCs, prepared in the run-up to COP21 Paris. Note that this website also has all the INDC submissions in three large Pdf files.

The graphic I have updated with estimates of the policy gap with my take on revised Millar et. al 2017 policy gaps shown by red arrows.

The extent of the arrows could be debated, but will not alter the fact that Millar et. al 2017 are assuming that by adjusting the figures and assuming that they are thinking for the whole world, that the emissions objectives will be achieved. The reality is that very few countries have committed to reducing their emissions by anything like an amount consistent with even a 2°C pathway. Further, that commitment is just until 2030, not for the 70 years beyond that. There is no legally-binding commitment in the Paris Agreement for a country to reduce emissions to zero sometime before the end of the century. Further, a number of countries (including Nigeria, Togo, Saudi Arabia, Turkmenistan, Iraq and Syria) have not signed the Paris Agreement – and the United States has given notification of coming out of the Agreement. Barring huge amounts of funding or some technological miracle most developing countries, with a majority of the world population, will go on increasing their emissions for decades. This includes most of the countries who were Non-Annex Developing Countries to the 1992 Rio Declaration. Collectively they accounted for just over 100% of the global GHG emissions growth between 1990 and  2012.

As some of these Countries’ INDC Submissions clearly state, most will not sacrifice economic growth and the expectations of their people’s for the unproven dogma of politicalized academic activists in completely different cultures say that the world ought to cut emissions. They will attend climate conferences and be seen to be on a world stage, then sign meaningless agreements afterward that commit them to nothing.

As a consequence, if catastrophic anthropogenic global warming is true (like the fairies at the bottom of the garden) and climate mitigation reduction targets are achieved, the catastrophic climate change will be only slightly less catastrophic and the most extreme climate mitigation countries will be a good deal poorer. The non-policy countries will the ones better off. It is the classic free-rider problem, which results in an underprovision of those goods or services. If AGW is somewhat milder, then even these countries will be no worse off.

This is what really irritates me. I live in Britain, where the Climate Change Act 2008 has probably the most ludicrous targets in the world. That Act was meant to lead the world on climate change. The then Environment Secretary David Miliband introduced the bill with this message in March 2007.

From the graphic above COP21 Paris showed that most of the world is not following Britain’s lead. But the “climate scientists” are so stuck in their manipulated models, they forget that their models and beliefs of their peers are not the realities of the wider world. The political realities mean that reduction of CO2 emissions are net harmful to the people of Britain, both now and for future generations of Britains. The activists are just as wilfully negligent in shutting down any independent review of policy as a pharmaceutical company who would push one of its products onto the consumers without an independent evaluation of both the benefits and potential side effects.

Kevin Marshall

New EU Vacuum Cleaner Regulations likely promoted with false claims

Summary

On September 1st, the EU Commission launched new regulations limiting the maximum power of vacuum cleaners to 900 watts.  A news item claimed

The updated rules will result in vacuum cleaners that use less energy for a better cleaning performance. This will help consumers to save money, as switching to a more efficient product can save €70 over its lifetime.

Elsewhere the is a claim that “with more efficient vacuum cleaners, Europe as a whole can save up to 20 TWh of electricity per year by 2020.

There is no reference to the source of the claims. Pulling in data from various sources I have calculated how the figures may have been derived. Based on these figures it would appear

  • The assumed savings are 200 kWh per vacuum cleaner, based on switching from a 1600 watts to a 900 watts, and 290 hours of use over the average lifetime.
  • This ignores that many vacuum cleaners are below 1600 watts due competition, not rules in place.
  • Cost savings are based on the average electricity costs in the EU, when in reality electricity costs in the most expensive country are 2.6 times that of the cheapest.
  •  Cost savings are not net of cost increases, such as more time spent cleaning and increase costs of the appliance.
  • Claims of reduction in electricity consumption are based on the requirement that all 350 million vacuum cleaners of 1600 watts are replaced by 900 watt cleaners by the start of 2020.

If any business made bald unsubstantiated claims about a new product, it would be required to back up the claims or withdraw them. Morally, I believe the EU Commission should aspire to emulate the standards that it imposes on others in marketing its own products. A law making Authority cannot be regulated and brought to account for the harms it causes. But I feel that it owes its citizens a moral duty of care to serve them, by minimizing the harms that it can cause and maximising the benefits.

The Launch of the New Regulations

BBC had an article on September 1st Sales of inefficient vacuum cleaners banned

They state

The EU’s own website says: “With more efficient vacuum cleaners, Europe as a whole can save up to 20 TWh of electricity per year by 2020.

“This is equivalent to the annual household electricity consumption of Belgium.

“It also means over 6 million tonnes of CO2 will not be emitted – about the annual emissions of eight medium-sized power plants.”

Although the BBC do not link to the webpage among millions. A search on the phrase reveals the following link.

http://ec.europa.eu/energy/en/topics/energy-efficiency/energy-efficient-products/vacuum-cleaners

Vacuum cleaners are subject to EU energy labelling and ecodesign requirements. By switching to one of the most energy efficient vacuum cleaners, you can save €70 over the lifetime of the product.  With more efficient vacuum cleaners, Europe as a whole can save up to 20 TWh of electricity per year by 2020. This is equivalent to the annual household electricity consumption of Belgium. It also means over 6 million tonnes of CO2 will not be emitted – about the annual emissions of eight medium-sized power plants.

There are no references to where the figures come from.

Another source is much nearer in the menu tree to the EU homepage and is on a news page.

http://ec.europa.eu/energy/en/news/updated-energy-efficiency-rules-vacuum-cleaners-will-save-consumers-money

Updated energy efficiency rules for vacuum cleaners will save consumers money

Friday, 01 September 2017

From today, vacuum cleaners sold in Europe will be more cost- and energy-efficient. The European Commission is making use of the latest state-of-the-art technologies to ensure that European consumers have the most energy efficient products available. The updated ecodesign requirements will lower appliances’ maximum power, annual energy consumption and noise levels. They will also increase their minimum ability to pick up dust.

The updated rules will result in vacuum cleaners that use less energy for a better cleaning performance. This will help consumers to save money, as switching to a more efficient product can save €70 over its lifetime. With more efficient vacuum cleaners, Europe as a whole will be in a position to save up to 20 TWh of electricity per year by 2020.

Like with the first EU source (which this press release links backed to) there is no reference to the source of the claims.

Establishing the calculations behind the claims

However, there the claims that together with other data and some assumptions have enabled me to piece together the numbers behind the claims. These are:-

  1. The maximum of 20 TWh of electricity that could be saved by 2020. There are one billion kilowatt hours in a terawatt hour.
  2. According to Eurostat’s Household Composition Statistics, there are 495.6 million EU citizens living in households, with an average 2.3 persons per household. That is around 215 million or maybe 210 million households.
  3. There is more than one vacuum cleaner in the average household.
  4. All vacuum cleaners are operated at maximum power all the time.
  5. All current vacuum cleaners are 1600 watts. By 2020 they will all be at 900 watts.
  6. Life of the average vacuum cleaner is five years. This I worked out from slotting in other variables.


To understand how many kilowatt hours in the maximum cost saving of €70, one needs to know the cost of a unit of electricity. In a recent post on electricity prices in South Australia, Joanne Nova provided a graphic based on data from MARKINTELL, US Energy Information Administration. Based on this I have produced a graphic showing that if Denmark, where electricity is most expensive, a person saved €70 on their electricity bill, the savings in most of the other EU countries.

If the Danes will save €70 from buying a vacuum cleaner under the new regulations, in the UK the saving will be about €49, France €39 and in Hungary and Estonia just €27. This is because of the huge difference in electricity costs, with Danish electricity being 2.6 times that in Hungary and Estonia. It is a simple step to work out the number of kilowatt hours of electricity saved for a spend of €70.  Assuming $1.00 = €0.85, the next graph shows how many units of electricity will be saved in each country.

If the EU Commission had properly checked its figures, when quoting the maximum saving, will base it on the highest electricity rates in the EU, and not the average rates. They will, therefore, assume that the maximum savings for the EU will be around 133 kilowatt hours and not 200 kilowatt hours. Otherwise, the maximum savings in Denmark, Germany, Italy and Portugal could be greater than the claimed maximum, whilst people in some other countries with lower than average electricity costs will be misled as to the extent of the possible savings.

I have put together a table that fits the assumptions and known variables based on €70 of savings in both Denmark and the fictional EU average.

The 200 kWh saving over a five-year vacuum cleaner life seems more reasonable than 133 kWh. The 350 million vacuum cleaners in the EU or two for every three people, seems more reasonable than 538 million, which is both less of a rounded estimate and would mean around 35 million more vacuum cleaners than people. The assumption that the average household spends 1 hour and 50 minutes per week vacuuming might be a bit high, but there again I know of people who regularly exceed this amount by quite a margin.

Based on how the numbers fit the maximum saving of €70 per vacuum cleaner to have been based on the average cost of electricity in the EU. As such it is an incorrect statement. There are other issues that arise.

Evaluating the claims

There are other issues that arise from consideration of these figures, though are not necessarily solely reliant upon those figures.

First, the 26TW of savings is if all the current vacuum cleaners (assumed to be at 1600W rating) will be replaced by the start of 2020. That is in just 2.33 years. If vacuum cleaners have an average five-year life, many people will be scrapping their existing vacuum cleaners before the end of their useful life. Even with a maximum marginal cost saving of €14 a year, this would mean incurring unnecessary additional costs and throwing out perfectly serviceable vacuum cleaners. However, if they replace a 2000 watt or higher vacuum cleaner purchased prior to September 2014, then the savings will be much higher. In which case the EU Commission News item should have noted that some savings were from regulations already in place.

Second is that many households have an old vacuum cleaner in reserve. They may have it for a number of reasons, such as having upgraded in the past, or purchased it prior to the regulations came into force in 2014. So when their main vacuum cleaner finally keels over, they will not purchase a low powered one. It will be therefore very many years before anything approaching 100% of existing vacuum cleaners have been replaced, especially if the perception is that the newer products are inferior.

Third, is an assumption that every vacuum cleaner is on the limit of the regulations. Greater efficiency (saving money) is something people are willing to pay for, so the market provides this anyway without the need for regulation, just as people pay for more fuel efficient cars. It is only the people who max out on the power permitted that will be affected to the full extent. As greater power is a cheap way of increasing performance, this will most affect the cheapest cleaners. The poor and those setting up a home for the first time (with severe budget constraints) are likely to be those most disadvantaged, whilst those who are willing and able to upgrade to the latest gadgets will make the lowest savings.

Fourth, the cost savings appear to be only on electricity costs. The extra costs of upgrading to a more technologically advanced machine that compensates for the loss of power, does not appear to have been taken into account in the calculations. If it had, then the electricity savings would have to be much greater, to include the additional costs. In which case, the fictional European average household would have to be saving far more on their electricity than €70. Let us say people upgrade from a €100 to €300 machine, both with a five year average life. To make €70 of savings over five years a Danish household would have to be running their vacuum cleaner for nearly three hours a week, a British or Dutch household over four hours per week, and the Hungarian and Estonian households over seven hours a week. But this defies other assumptions and would also shorten the average life of a vacuum cleaner. No allowance appears to have been made for more expensive vacuum cleaners.

Fifth, there are other, simpler ways of replacing the loss of suction from lack of power than technological wizardry that pushes up costs. The simplest is to reduce the area in contact with the floor. This means that people spend more time using the machines, offsetting some of the energy savings. Alternatively, there could be some loss of suction, which again means people spend more time cleaning, and getting frustrated due to the lack of performance. Some of this could be by more frequent swapping of cleaning heads. If you value people’s leisure time at just €5.00 an hour, then over the short five year life of a cleaner (about 290 hours based on 65 minutes a week of use), the average household will “lose” the €70 of electricity savings if they have to spend more than 5% more time cleaning. In reality it will be much more, and many people will feel aggrieved at having a less efficient machine.

Sixth is that the extra power can be used for simpler, proven and more robust technologies. Efficiency savings come about through complex optimisation strategies, reducing the life of cleaners.

So the claim by the EU that people will save money from the new regulations seems to be false for any one of a number of reasons. More likely than not people will be made net worse off by the regulations. Further the alleged benefits from the new regulations in terms of savings in electricity (and hence CO2 emissions) seems to have been grossly exaggerated.

But won’t there be a massive saving in CO2 emissions?  Even if the 6 million tonnes of emissions saved is in the more distant future, it is still a far large number. In terms of a small country like Belgium, it is a large amount. But considered in the context of EU’s INDC submission to the Paris climate talks it is quite small.

The EU and its Member States are committed to a binding target of an at least 40% domestic reduction in greenhouse gases emissions by 2030 compared to 1990,

From the accompanying country brief, the 1990 emissions were 5368 mtCO2e, so a 40% cut is 2147 mtCO2e. In 2012 emissions were 4241 mtCO2e (mostly for non-policy reasons) so there is just 1020 million tonnes to cut. 6 million is just 0.6% of that target.

On a global perspective, even with all the vague policy proposals fully enacted, global emissions by 2030 will be nearly 60,000 MtCO2e and will still be rising. There seems no prospect of additional policies being proposed that would start reducing global emissions. A policy that makes around 0.01% of the difference to the larger picture is inconsequential. To achieve the policy goals a few thousand similar-sized schemes are required. Nothing like that is going to happen. Countries in the developing world, with over half the global population, will see emissions will grow for decades, dwarfing any reductions made in the EU.

Concluding comments

The new vacuum cleaner regulations appear to be justified on the basis of grossly exaggerated and untenable claims of the benefits in terms of cost savings and reductions in GHG emissions, whilst ignoring the costs that they impose.

If any business made bald unsubstantiated claims about a new product, it would be required to back up the claims or withdraw them. If such sweeping claims were made about a new product such as anti-aging creams or vitamin pills, that could be attributed to other factors, then it would be prosecuted. Morally, I believe the EU Commission should aspire to emulate the standards that it imposes on others in marketing its own products. A law making Authority cannot be regulated and brought to account for the harms it causes. But I feel that it owes its citizens a moral duty of care to serve them, by minimizing the harms that it can cause and maximising the benefits.

Kevin Marshall


Joe Romm eco-fanaticism shown in Sea-Level Rise claims

The previous post was quite long and involved. But to see why Jo Romm is so out of order in criticizing President Trump’s withdrawal from the Paris Climate Agreement, one only has to examine the sub-heading of his rant  Trump falsely claims Paris deal has a minimal impact on warming. –

It may be time to sell your coastal property.

This follows with a graphic of Florida.

This implies that people in Southern Florida should take in account a 6 metre (236 inch) rise in sea levels as a result of President Trump’s decision. Does this implied claim stack up. As in the previous post, let us take a look at Climate Interactive’s data.

Without policy, Climate Interactive forecast that US emissions without policy will be 14.44 GtCO2e, just over 10% of global GHG emissions, and up from 6.8 GtCO2e in 2010. At most, even on CIs flawed reasoning, global emissions will be just 7% lower in 2100 with US policy. In the real world, the expensive job-destroying policy of the US will make global emissions around 1% lower even under the implausible assumption that the country were to extend the policy through to the end of the century. That would be a tiny fraction of one degree lower, even making a further assumption that a doubling of CO2 levels causes 3C of warming (an assumption contradicted by recent evidence). Now it could be that every other country will follow suit, and abandon all climate mitigation policies. This would be a unlikely scenario, given that I have not sensed a great enthusiasm for other countries to follow the lead of the current Leader of the Free World. But even if that did happen, the previous post showed that current policies do not amount to very much difference in emissions. Yet let us engage on a flight of fancy and assume for the moment that President Trump abandoning the Paris Climate Agreement will (a) make the difference between 1.5C of warming, with negligable sea-level rise and 4.2C of warming with the full impact of sea-level rise being felt (b) 5% of that rise. What difference will this make to sea-level rise?

The Miami-Dade Climate Change website has a report from The Sea Level Rise Task Force that I examined last November. Figure 1 of that report gives projections of sea-level rise assuming the no global climate policy.

Taking the most extreme NOAA projection it will be around the end of next century before sea-levels rose by 6 metres. Under the IPCC AR5 median estimates – and this is meant to be the Climate Bible for policy-makers – it would be hundreds of years before that sea-level rise would be achieved. Let us assume that the time horizon of any adult thinking of buying a property, is through to 2060, 42 years from now. The NOAA projection is 30 inches (0.76 metres) for the full difference in sea-level rise, or 1.5 inches (0.04 metres) for the slightly more realistic estimate. Using the mainstream IPCC AR5 median estimate, sea-level rise is 11 inches (0.28 metres) for the full difference in sea-level rise, or 0.6 inches (0.01 metres) for the slightly more realistic estimate. The real world evidence suggests that even these tiny projected sea level rises are exaggerated. Sea tide gauges around Florida have failed to show an acceleration in the rate of sea level rise. For example this from NOAA for Key West.

2.37mm/year is 9 inches a century. Even this might be an exaggeration, as in Miami itself, where the recorded increase is 2.45mm/year, the land is estimated to be sinking at 0.53mm/year.

Concluding Comments

If people based their evidence on the real world, President Trump pulling out of the Paris Climate Agreement will make somewhere between zero and an imperceptible difference to sea-level rise. If they base their assumptions on mainstream climate models, the difference is still imperceptible. But those with the biggest influence on policy are more influenced by the crazy alarmists like Joe Romm. The real worry should be that many policy-makers State level will be encouraged to waste even more money on unnecessary flood defenses, and could effectively make low-lying properties near worthless by planning blight when there is no real risk.

Kevin Marshall


Joe Romm inadvertently exposes why Paris Climate Agreement aims are unachievable

Summary

Joe Romm promotes a myth that the Paris Climate Agreement will make a huge difference to future greenhouse gas emissions. Below I show how the modelled impact of think tank Climate Interactive conclusion of a large difference is based on emissions forecasts of implausible large emissions growth in policy countries, and low emissions growth in the non-policy developing countries.


In the previous post I looked at how blogger Joe Romm falsely rebutted a claim that President Donald Trump had made that the Paris climate deal would only reduce only reduce future warming in 2100 by a mere 0.2°C. Romm was wrong on two fronts. He first did not check the data behind his assertions and second,  in comparing two papers by the same organisation he did not actually read the explanation in the later paper on how it differed from the first. In this post I look at how he has swallowed whole the fiction of bogus forecasts, that means the mere act of world leaders signing a bit of paper leads to huge changes in forecast emissions.

In his post  Trump falsely claims Paris deal has a minimal impact on warming, Romm states

In a speech from the White House Rose Garden filled with thorny lies and misleading statements, one pricks the most: Trump claimed that the Paris climate deal would only reduce future warming in 2100 by a mere 0.2°C. White House talking points further assert that “according to researchers at MIT, if all member nations met their obligations, the impact on the climate would be negligible… less than .2 degrees Celsius in 2100.”

The Director of MIT’s System Dynamics Group, John Sterman, and his partner at Climate Interactive, Andrew Jones, quickly emailed ThinkProgress to explain, “We are not these researchers and this is not our finding.”

They point out that “our business as usual, reference scenario leads to expected warming by 2100 of 4.2°C. Full implementation of current Paris pledges plus all announced mid-century strategies would reduce expected warming by 2100 to 3.3°C, a difference of 0.9°C [1.6°F].”

The reference scenario is RCP8.5, used in the IPCC AR5 report published in 2013 and 2014. This is essentially a baseline non-policy forecast against which the impact of climate mitigation policies can be judged. The actual RCP website produces emissions estimates by type of greenhouse gas, of which breaks around three-quarters is CO2. The IPCC and Climate Interactive add these different gases together with an estimate of global emissions in 2100. Climate Interactive current estimate as of April 2017 is 137.58 GtCO2e for the the reference scenario and the National Plans will produce 85.66 GTCO2e. These National would allegedly make global emissions 37.7% than they would have been without them, assuming they are extended beyond 2030. Climate Interactive have summarized this in a graph.

To anyone who actually reads the things, this does not make sense. The submissions made prior to the December 2015 COP21 in Paris were mostly political exercises, with very little of real substance from all but a very few countries, such as the United Kingdom. Why it does not make sense becomes clear from the earlier data that I extracted from Climate Interactives’ C-ROADS Climate Simulator version v4.026v.071 around November 2015.  This put the RCP8.5 global GHG emissions estimate in 2100 at the equivalent of 139.3 GtCO2e. But policy is decided and implemented at country level. To determine the impact of policy proposal there must be some sort of breakdown of emissions. C-ROADS does not provide a breakdown by all countries, but does to divide the world into up to 15 countries and regions. One derived break-down is into 7 countries or regions. That is the countries of USA, Russia, China and India, along with the country groups of EU27, Other Developed Countries and Other Developing Countries. Also available are population and GDP historical data and forecasts. Using this RCP8.5 and built-in population forecasts I derived the following GHG emissions per capita for the historical period 1970 to 2012 and the forecast period 2013 to 2100.

Like when I looked at Climate Interactives’ per capita CO2 emissions from fossil fuels estimates at the end of 2015, these forecasts did not make much sense. Given that these emissions are the vast majority of total GHG emissions it is not surprising that the same picture emerges.

In the USA and the EU I can think of no apparent reason for the forecast of per capita emissions to rise when they have been falling since 1973 and 1980 respectively. It would require for energy prices to keep falling, and for all sectors to be needlessly wasteful. The same goes for other developed countries, which along with Canada and Australia, includes the lesser developed countries of Turkey and Mexico. Indeed why would these countries go from per capita emissions similar to the EU27 now to those of the USA in 2100?

In Russia, emissions have risen since the economy bottomed out in the late 1990s following the collapse of communism. It might end up with higher emissions than the USA in 1973 due to the much harsher and extreme climate. But technology has vastly improved in the last half century and it should be the default assumption that it will continue to improve through the century. It looks like someone, or a number of people, have failed to reconcile the country estimate with the forecast decline in population from 143 million in 2010 to 117 million. But more than this, there is something seriously wrong with emission estimates that would imply that the Russian people become evermore inefficient and wasteful in their energy use.

In China there are similar issues. Emissions have increased massively in the last few decades on the back of even more phenomenal growth, that surpasses the growth of any large economy in history. But emissions per capita will likely peak due to economic reasons in the next couple of decades, and probably at a much lower level than the USA in 1973. But like Russia, population is also forecast to be much lower than currently. From a population of 1340 million in 2010, Climate Interactive forecasts population to peak at  1420 million in 2030 (from 2020 to 2030 growth slows to 2 million a year) to 1000 million in 2100. From 2080 (forecast population 1120) to 2100 population is forecast to decline by 6 million a year.

The emissions per capita for India I would suggest are far too low. When made, the high levels of economic growth were predicted to collapse post 2012. When I wrote the previous post on 30th December 2015, to meet the growth forecast for 2010-2015, India’s GDP would have needed to drop by 20% in the next 24 hours. It did not happen, and in the 18 months since actual growth has further widened the gap with forecast. Similarly forecast growth in GHG emissions are far too low. The impact of 1.25 billion people today (and 1.66 billion in 2100) is made largely irrelevant, nicely side-lining a country who has declared economic growth is a priority.

As with the emissions forecast for India, the emissions forecast for other developing countries is far too pessimistic, based again on too pessimistic growth forecasts. This mixed group of countries include the 50+ African nations, plus nearly all of South America. Other countries in the group include Pakistan, Bangladesh, Myanmar, Thailand, Indonesia, Vietnam, Haiti, Trinidad, Iraq, Iran and Kiribati. There are at least a score more I have omitted, in total making up around 42% of the current global population and 62% of the forecast population in 2100. That is 3 billion people today against 7 billion in 2100. A graph summarizing of Climate Interactive’s population figures is below.

This can be compared with total GHG emissions.

For the USA, the EU27, the other Developed countries and China, I have made more reasonable emissions per capita estimates for 2100.

These more reasonable estimates (assuming there is no technological breakthrough that makes zero carbon energy much cheaper than any carbon technology) produce a reduction in projected emissions of the same order of magnitude as the supposed reduction resulting from implementation of the National Plans. However, global emissions will not be this level, as non-policy developing nations are likely to have much higher emissions. Adjusting for this gives my rough estimate for global emissions in 2100.

The overall emissions forecast is not very dissimilar to that of RCP8.5. Only this time the emissions growth has shift dramatically from the policy countries to the non-policy countries. This is consistent with the data from 1990 to 2012, where I found that the net emissions growth was accounted for by the increase in emissions from developing countries who were not signatories to reducing emissions under the 1992 Rio Declaration. As a final chart I have put the revised emission estimates for India and Other Developing Countries to scale alongside Climate Interactives’ Scoreboard graphic at the top of the page.

This clearly shows that the emissions pathway consistent the constraining warming to  2°C will only be attained if the developing world collectively start reducing their emissions in a very few years from now. In reality, the priority of many is continued economic growth, which will see emissions rise for decades.

Concluding Comments

This is a long post, covering a lot of ground. In summary though it shows environmental activist has Joe Romm has failed to check the claims he is promoting. An examination of Climate Interactive (CI) data underlying the claims that current policies will reduce global temperature by 0.9°C through reducing GHG global emissions does not stand up to scrutiny. That 0.9°C claim is based on global emissions being around 35-40% lower than they would have been without policy. Breaking the CI data down into 7 countries and regions reveals that

  • the emissions per capita forecasts for China and Russia show implausibly high levels of emissions growth, when they show peak in a few years.
  • the emissions per capita forecasts for USA and EU27 show emissions increasing after being static or falling for a number of decades.
  • the emissions per capita forecasts for India and Other Developing Countries show emissions increasing as at implausibly lower rates than in recent decades.

The consequence is that by the mere act of signing an agreement makes apparent huge differences to projected future emissions. In reality it is folks playing around with numbers and not achieving anything at all, except higher energy prices and job-destroying regulations. However, it does save the believers in the climate cult from having to recognize the real world. Given the massed hordes of academics and political activists, that is a very big deal indeed.

Kevin Marshall 

Joe Romm falsely accuses President Trump understating Impact of Paris Deal on Global Warming

Joe Romm of Climate Progress had a post two weeks ago Trump falsely claims Paris deal has a minimal impact on warming

Romm states

In a speech from the White House Rose Garden filled with thorny lies and misleading statements, one pricks the most: Trump claimed that the Paris climate deal would only reduce future warming in 2100 by a mere 0.2°C. White House talking points further assert that “according to researchers at MIT, if all member nations met their obligations, the impact on the climate would be negligible… less than .2 degrees Celsius in 2100.”

The deeply prejudiced wording, written for an extremely partisan readership, encourages readers to accept the next part without question.

The 0.2°C estimate used by Trump may be from another MIT group; the Joint Program on the Science and Policy of Global Change did have such an estimate in early 2015, before all of the Paris pledges were in. But, their post-Paris 2016 analysis also concluded the impact of the full pledges was closer to 1°C.

The source for the 0.2°C claim is the MIT JOINT PROGRAM ON THE SCIENCE AND POLICY OF GLOBAL CHANGE. ENERGY & CLIMATE OUTLOOK PERSPECTIVES FROM 2015

This states

New in this edition of the Outlook are estimates of the impacts of post-2020 proposals from major countries that were submitted by mid-August 2015 for the UN Conference of Parties (COP21) meeting in Paris in December 2015.

So what INDC submissions were in by Mid-August? From the submissions page (and with the size of total 2010 GHG Emissions from the Country Briefs) we get the following major countries.

In box 4 of the outlook, it is only Korea that is not included in the 0.2°C impact estimate. That is just over half the global emissions are covered in the MIT analysis. But there were more countries who submitted after mid-August.

The major countries include

 
My table is not fully representative, as the UNFCCC did not include country briefs for Nigeria, Egypt, Saudi Arabia, Iran, Iraq, Kuwait and UAE. All these countries made INDC submissions along with a lot of more minor GHG emitters. I would suggest that by mid-August all the major countries that wanted to proclaim how virtuous they are in combating climate change were the early producers of the INDC submissions. Countries like the Gulf States, India and Indonesia tended to slip their documents in somewhat later with a lot of measly words to make it appear that they were proposing far more than token gestures and pleas for subsidies. Therefore, the 0.2°C estimate likely included two-thirds to three-quarters of all the real emission constraint proposals. So how does an analysis a few months later produce almost five times the impact on emissions?

The second paragraph of the page the later article Joe Romm links to clearly states difference in methodology between the two estimates.


A useful way to assess that impact is to simulate the effects of policies that extend the Agreement’s 188 pledges (known as Nationally Determined Contributions, or NDCs) to the end of the century. In a new study that takes this approach, a team of climate scientists and economists from the MIT Joint Program on the Science and Policy of Global Change led by research scientist Andrei Sokolov finds that by 2100, the Paris Agreement reduces the SAT considerably, but still exceeds the 2 C goal by about 1 C.

The primary difference is that the earlier study tries to measure the actual, real world, impacts of existing policy, and policy pledges, if those policies are fully enacted. In the USA, those pledges would need Congressional approval to be enacted. The later study takes these submissions, (which were only through to 2030) and tries to estimate the impact if they were extended until 2100.  That is renewables subsidies that push up domestic and business energy costs would be applied for 85 years rather than 15. It is not surprising that if you assume policy proposals are extended for over five times their original period, that they will produce almost five times the original impact. To understand this all that is required is to actually read and comprehend what is written. But Joe Romm is so full of bile for his President and so mad-crazy to save the planet from the evils of Climate Change and (mostly US) big business that he is blinded to that simple reality-check.

The fuller story is that even if all policies were fully enacted and extended to 2100, the impact on emissions would be far smaller than Joe Romm claims. That will be the subject of the next post.

Kevin Marshall