UNEP Emissions Gap Report 2018 Part 3 – UNEP tacitly admits climate mitigation is a failure

To those following the superficial political spin of climate policy, a UN organisation admitting that climate mitigation has failed may come as a surprise. Yet one does not have to go too deeply into the new UNEP Emissions Gap Report 2018 to see that this tacit admission is clearly the case. It is contained within the 3 major points in the Executive Summary.

By policy failure, I mean to achieve a global substantial reduction in GHG emissions in the near future, even if that reduction is not in line with either the 1.5°C or 2.0°C warming objective. On this measure, the UNEP is tacitly admitting failure it the summary.
The Executive Summary of the UNEP Emissions Gap Report 2018 starts on the pdf page 14 of 112, numbered page xiv.

Point 1 – Current commitments are inadequate

1. Current commitments expressed in the NDCs are inadequate to bridge the emissions gap in 2030. Technically, it is still possible to bridge the gap to ensure global warming stays well below 2°C and 1.5°C, but if NDC ambitions are not increased before 2030, exceeding the 1.5°C goal can no longer be avoided. Now more than ever, unprecedented and urgent action is required by all nations. The assessment of actions by the G20 countries indicates that this is yet to happen; in fact, global CO2 emissions increased in 2017 after three years of stagnation.

This is not a statement about a final push to get policy over the line, but a call for a complete change of direction. The tacit admission is that this is politically impossible. In the amplification it is admitted that in the G20 major economies – most of them developing countries – even the “NDC ambitions” for 2030 are not likely to be achieved. As I showed in the Part 2 post, 9 of the G20 will actually increase their emissions from 2015 to 2030 if the commitments are fully met, and the sum of the emissions increases will be greater than the emissions decreases. The exhortation for “unprecedented and urgent action” is not like Shakespeare’s Henry V rallying his men with a “once more unto the breach chaps and we will crack it” but more about like “Hey good fellows, if we are really going to breach the defenses we need to upgrade from the colorful fireworks to a few kegs of proper gunpowder, then make a few genuine sacrifices. I will be cheering you all the way from the rear“. This sentiment is contained in the following statement.

As the emissions gap assessment shows, this original level of ambition needs to be roughly tripled for the 2°C scenario and increased around fivefold for the 1.5°C scenario.

Point 2 – Emissions are increasing, not decreasing rapidly

2. Global greenhouse gas emissions show no signs of peaking. Global CO2 emissions from energy and industry increased in 2017, following a three-year period of stabilization. Total annual greenhouse gases emissions, including from land-use change, reached a record high of 53.5 GtCO2e in 2017, an increase of 0.7 GtCO2e compared with 2016. In contrast, global GHG emissions in 2030 need to be approximately 25 percent and 55 percent lower than in 2017 to put the world on a least-cost pathway to limiting global warming to 2°C and 1.5°C respectively.

In just 13 years from now global emissions need to be down by a quarter or more than a half to achieve the respective 2°C and 1.5°C targets. Emissions are still going up. Again, an admission that the progress in over two decades is small in relation to the steps needed to achieve anything like a desired outcome.

Point 3 – Scale of the gap in numbers

3. The gap in 2030 between emission levels under full implementation of conditional NDCs and those consistent with least-cost pathways to the 2°C target is 13 GtCO2e. If only the unconditional NDCs are implemented, the gap increases to 15 GtCO2e. The gap in the case of the 1.5°C target is 29 GtCO2e and 32 GtCO2e respectively. This gap has increased compared with 2017 as a result of the expanded and more diverse literature on 1.5°C and 2°C pathways prepared for the IPCC Special Report.

Some developing countries said they would change course conditional on massive amounts of funding. It is clear this will not be forthcoming. Fleshing out the 1.5°C target in the SR1.5 Report showed that it requires more onerous policies than previously thought. Each year UNEP produces a chart that nicely shows the scale of the problem. The 2018 version on page xviii is reproduced as figure 1.

Figure 1 : The emissions GAP in 2030 under the 1.5°C and 2°C scenarios, from the UNEP Emissions Gap Report 2018.

The widening gap between the 1.5°C and 2°C pathways and current projected commitments over the last five reports is shown in figure 2.

This widening gap is primarily a result of recalculations. Increased emissions in 2017 are secondary.

Conclusion

That nearly 200 nations would fail to agree to collectively and substantially reduce global emissions was obvious from the Rio Declaration in 1992. This exempted developing countries from any obligation to reduce their emissions. These developing countries now have at least four fifths of the global population and around two-thirds emissions. It was even more obvious from reading the Paris Agreement, where vague aspirations are evident. It is left to the reader to work out the implications of paragraphs like 4.1 and 4.4, which renders the UNFCCC impotent in reducing emissions. The latest UNEP Emissions Gap Report presents the magnitude of the mitigation policy failure and very clear statements about that failure.

Kevin Marshall

UNEP Emissions Gap Report 2018 Part 2 – Emissions Projections by Country

On previous UNEP Emission Gap Reports I found that although they showed the aggregate global projected emissions, there has been no breakdown by country. As mitigation policies are mostly enacted by nation states, and the aim is to reduce global emissions, it would be useful to actually see how each of the near 200 nation states have pledged contribute to that objective.  Table 2.1 on page 9 of the UNEP Emissions Gap Report 2018 (published last week) goes part way to remedy this glaring omission. The caption states

Table 2.1: Overview of the status and progress of G20 members, including on Cancun pledges and NDC targets.


The G20 economies accounted for 78% of global emissions (excluding LULUCF) in 2017. The table does not clearly show the estimate emissions in 2015 and 2030, only the emissions per capita in 2015 (including LULUCF) and the percentage change in emissions per capita from 2015 to 2030. So I have done my own calculations based on this data using the same future population estimates as UNEP. That is from the medium fertility variant of the United Nations World Population Prospects 2017 edition. There are two additional assumptions I have made in arriving at these figures. First, the share of global emissions in 2015 for each country was exactly the same as in 2017. Second, the global shares including LULUCF (Land use, land-use change and forestry) are the same as those excluding LULUCF. This second assumption will likely understate the total emissions shares of countries like Brazil and Indonesia, where land use has high, and variable, emissions impacts. It may impact the country rankings by a small amount. However, the overall picture shown in Figure 1 will not be materially changed as the report states on page XV that the land use element was just 4.2 GtCO2e of the 53.5 GtCO2e estimated emissions in 2017.

In Figure 1 it is only G20 countries with 33% of current global emissions where emissions are projected to be lower 2030 than in 2015. The other G20, with 45% of global emissions, are projected to be higher. There are wide variations. I calculate, Argentina is projected to increase its emissions by 7% or 32 MtCO2e, Turkey by 128% or 521 MtCO2e and India by 93% or 2546 MtCO2e.
To get a clearer picture I have looked at the estimates changes between 2015 and 2030  in Figure 2. Please note the assumptions made above, particularly concerning LULUCF. I also make the additional assumption that in rest of the world emissions will increase in line with projected population growth, so emissions per capita will be unchanged.

The calculated figures show a net increase of 7.4 GtCO2e, compared to EGR2018 estimates of 6 GtCO2e including LULUCF. It might be a reasonable assumption that there are net reductions in removing the rainforests by burning, and increase in trees due to more planting, and the impact of increased growth due to higher CO2 levels will be net positive.
Note that whilst the USA has given notice of exiting the Paris Agreement, and thus its pledges, the pledge was a very soft target. It is more than likely the United States will have the greatest emissions reductions of any country between 2015 and 2030, and have one of the largest percentage reductions as well. These reductions are mostly achieved without economically damaging mitigation policies.
The figures used for the G20 countries in Table 2.1 are only vague estimates as section 2.4.2 (Emissions trends and targets of individual G20 members) implies. However, the assumption of a net increase of 29% for the rest of the world might not be valid if one uses country INDC submissions as a basis for calculation. There are a few countries that have pledged to reduce emissions. Andorra and Liechtenstein are two examples. But among the more populous emerging economies, it is clear from the INDC submissions that there is no intention to reduce emissions.

Figure 3 estimates the implied increase in emissions in the more populous countries outside of the G20 for the unconditional scenarios.

I would also have liked to include DR Republic of Congo, Egypt and Iran, with a combined population of 260 million. However, lack of data in the INDCs prevented this.
Although the 8 countries in Figure 3 contain one eighth of the global population, they currently have just 4% of global emissions. But their aggregate projected emissions increase without outside assistance is 3.0 GtCO2e, on top of 2.1 GtCO2e in 2015. Combined with the 7.4 GtCO2e estimated increase for the G20 countries and it is difficult to see how the UNEP estimates an increase just 3 GtCO2e. (see Figure ES.3 on page XVIII).

There appear to be no countries with a population of more than 40 million outside of the G20 who are promising to decrease their emissions. Tanzania, Colombia, Kenya and Algeria (combined population 190 million people) are all projecting significant emissions increases, whilst Myanmar and Sudan have inadequate data to form an estimate. A quick check of 8 non G20 countries with populations of 30-40 million has the same result. Either an increase in emissions or no data. 

Implications for mitigation policy

In summary, of the 45 nations with a population above 30 million, just 10 have pledged to have emissions lower in 2030 than 2015. The United States will likely achieve this objective are well. The other 34 nations will likely have higher emissions in 2030, with most significantly higher. The 11 emissions-reducing nations have a population of 1.1 billion against 5.3 billion in the 34 other nations and 1.15 billion in nations or territories with a population of less than 30 million. In terms of emissions, barring economic disaster, I estimate it is likely that countries with in excess of 60% of global emissions in 2017 will have emissions in 2030 that exceed those of 2015.  

To put this in context, the Emissions Gap report states on page xv

According to the current policy and NDC scenarios, global emissions are not estimated to peak by 2030.

My analysis confirms this. The Report further states

Total annual greenhouse gases emissions, including from land-use change, reached a record high of 53.5 GtCO2e in 2017, an increase of 0.7 GtCO2e compared with 2016. 
In contrast, global GHG emissions in 2030 need to be approximately 25 percent and 55 percent lower than in 2017 to put the world on a least-cost pathway to limiting global warming to 2°C and 1.5°C respectively.

After over 20 years of annual meeting to achieve global reductions in emissions, there is still no chance of that happening. In the light of this failure UNEP appear to have fudged the figures. Part of this is justified, as many developing countries appear to have put through unjustifiable BAU scenarios then claimed “climate actions” that will bring the projection more into line with what would be a non-policy forecast. COP 24 at Katowice will just be another platform for radical environmentalists to denigrate capitalist nations for being successful, and for a collective finger-wagging at the United States. 

The next part will look at the coded language of the Emissions Gap Report 2018 that effectively admits the 2°C and 1.5°C ambitions are impossible.

Kevin Marshall


Charles Moore nearly gets Climate Change Politics post Paris Agreement

Charles Moore of the Telegraph has long been one of the towering figures of the mainstream media. In Donald Trump has the courage and wit to look at ‘green’ hysteria and say: no deal (see also at GWPF, Notalotofpeopleknowthat and Tallbloke) he understands not only the impact of Trump withdrawing from the climate agreement on future global emissions, but recognizes that two other major developed countries – Germany and Japan – whilst committed to reduce their emissions and spending lots of money on renewables are also investing heavily in coal. So without climate policy, the United States is reducing its emissions, but with climate commitments, emissions in Japan and Germany are increasing their emissions. However, there is one slight inaccuracy in Charles Moore’s account. He states

As for “Paris”, this is failing, chiefly for the reason that poorer countries won’t decarbonise unless richer ones pay them stupendous sums.

It is worse than this. Many of the poorer countries have not said they will decarbonize. Rather they have said that they will use the money to reduce emissions relative to a business as usual scenario.

Take Pakistan’s INDC. In 2015 they estimate emissions were 405 MtCO2e, up from 182 in 1994. As a result of ambitious planned economic growth, they forecast a BAU of 1603 MtCO2e in 2030. However, they can reduce that by 20% with about $40 billion in finance. That is, with $40bn, average annual emissions growth from 2015-2030 will still be twice that of 1994-2015. Plus Pakistan would like $7-$14bn pa for adaptation to climate change. The INDC Table 7 summarizes the figures.

Or Bangladesh’s INDC. Estimated BAU increase in emissions from 2011 to 2030 is 264%. They will unconditionally cut this by 5% and conditionally by a further 15%. The BAU is 7.75% annual emissions growth, cut to 7.5% unconditionally and 6% with lots of finance. The INDC Table 7 summarizes the figures.

I do not blame either country for taking such an approach, or the many others adopting similar strategies. They are basically saying that they will do nothing that impedes trying to raise living standards through high levels of sustained economic growth. They will play the climate change game, so long as nobody demands that Governments compromise on serving the best interests of their peoples. If only the Government’s of the so-called developed nations would play similar games, rather than impose useless burdens on the people they are supposed to be serving.

There is another category of countries that will not undertake to reduce their emissions – the OPEC members. Saudi Arabia, Iran, Venezuela, Kuwait, UAE and Qatar have all made submissions. Only Iran gives a figure. It will unilaterally cut emissions by 4% against BAU. With the removal of “unjust sanctions” and some financial assistance and technology transfer it conditional offer would be much more. But nowhere is the BAU scenario stated in figures. The reason these OPEC countries will not play ball is quite obvious. To achieve the IPCC objective of constraining warming to 2°C according to McGlade and Ekins 2015 (The geographical distribution of fossil fuels unused when limiting global warming to 2°C) would mean leaving 75% of proven reserves of fossil fuels in the ground and all of the unproven reserves. I did an approximate breakdown by major countries last year, using the BP Statistical Review of World Energy 2016.

It does not take a genius to work out that meeting the 2°C climate mitigation target would shut down a major part of the economies of fossil fuel producing countries in about two decades. No-one has proposed either compensating them, or finding alternatives.

But the climate alarmist community are too caught up in their Groupthink to notice the obvious huge harms that implementing global climate mitigation policies would entail.

Kevin Marshall

Macron calls for Climate Tariffs against most of the World

From the Independent (via Eric Worrall at WUWT)

In his speech, Mr Macron also called for an EU tariff on goods imported from countries or companies that do not share its climate goals, and pledged to work to raise the cost of carbon within the EU to €30 a tonne.

The EU INDC submission to COP21 Paris states

The EU and its Member States are committed to a binding target of an at
least 40% domestic reduction in greenhouse gas emissions by 2030
compared to 1990,

Most INDC submissions do not state they will reduce their greenhouse gas emissions. As a result, even if the proposals are fully met (and the EU is unlikely to meet its target) then emissions are forecast to be higher in 2030 than they are today. This graphic from the UNEP Emissions Gap Report published at the end of October demonstrates the situation quite nicely.

So President Macron is wanting sanctions not just against the USA, but most of the world as well? This includes China, India, nearly every African country,  most countries in SE Asia, the Middle East nations and some other nations besides. Or is it just those who stand up to the useless European climate policies, that are benefiting large businesses with subsidies financed disproportionately by the poor? The rhetoric includes “companies”, on whom sanctions cannot be applied. Further, the €30 carbon price is equivalent to €0.10 on the price of petrol (gasoline). How is a small rise in the cost of fossil fuel energy from a group of countries with less than 10% of GHG emissions going to save the world? As economics Professor Richard Tol has estimated, to achieve the targets would require a global carbon tax from 2020 of $210 and then escalated by 4-6% a year until fossil fuels were unaffordable. Chancellor Angela Merkel claims “Climate change is by far the most significant struggle of our time.” (Independent again). The falsity of this claim is shown by political newcomer President Macron’s trying to marginalize and silence opponents with empty and ineffectual threats.

Time will run out to prevent 2°C warming barrier being breached

I have a number of times referred to a graphic “Figure 2 Summary of Results” produced by the UNFCCC for the Paris COP21 Climate Conference in December 2015. It was a centerpiece of the UNFCCC Synthesis report on the aggregate effect of INDCs.

The updated graphic (listed as Figure 2, below the Main Document pdf) is below

This shows in yellow the impact of the INDC submissions covering the period 2015 to 2030) if fully implemented against limiting warming to 2°C  and 1.5°C . This showed the gulf between the vague policy reality and the targets. Simply put, the net result of the INDCs submissions would insufficient for global emissions to peal Yet in reaching an “agreement” the representatives of the entire world collectively put off recognizing that gulf.

For the launch of the UNIPCC AR5 synthesis report in 2014, there were produced a set of slides to briefly illustrate the policy problem. This is slide 20 of 35, showing the  reduction pathways.


The 2°C  of warming central estimate is based upon total GHG emissions in the 21st Century being around 2500 GtCO2e.

At the launch of 2006 Stern Review Sir Nicholas Stern did a short Powerpoint presentation. Slide 4 of the PDF file is below.


The 450ppm CO2e emissions pathway is commensurate with 2°C  of warming. This is based upon total GHG emissions in the 21st Century being around 2000 GtCO2e, with the other 500 GtCO2e presumably coming in the 22nd Century.

The UNFCCC Paris graphic is also based on 2500 GtCO2e it is also possible to calculate the emissions reduction pathway if we assume (a) All INDC commitments are met (b) Forecasts are correct (c) no additional mitigation policies are enacted.

I have produced a basic graph showing the three different scenarios.

The Stern Review assumed global mitigation policy would be enacted around 2010. Cumulative 21st Century emissions would then have been around 450 GtCO2e. With 500 GtCO2e allowed for post 2100, this gave average emissions of around 17 GtCO2e per annum for the rest of the century. 17 GtCO2e, is just under 40% of the emissions in the year the policy would be enacted.

IPCC AR5  assumed global mitigation policy would be enacted around 2020. Cumulative 21st Century emissions would then have been around 950 GtCO2e. A presentation to launch the Synthesis Report rounded this to 1000 GtCO2e as shown in slide 33 of 35.

Assuming that global emissions were brought to zero by the end of the century, this gave average emissions of 20 GtCO2e per annum for the rest of the century. 20 GtCO2e, is just under 40% of the emissions in the year the theoretical global policy would be enacted. The stronger assumption of global emissions being reduced to zero before the end of the century, along with a bit of rounding, offsets the delay.

If the Paris Agreement had been fully implemented, then by 2030 cumulative 21st Century emissions would have around 1500 GtCO2e, leaving average emissions of around 14 GtCO2e per annum for the rest of the century. 17 GtCO2e, is just over 25% of the emissions in the year the policy would be enacted. The failure of the Paris Agreement makes it necessary for true global mitigation policies, if in place by 2030, to be far more drastic that those of just a few years before to achieve the same target.

But the Paris Agreement will not be fully implemented. As Manhatten Contrarian (hattip The GWPF) states, the US was the only major country proposing to reduce its emissions. It looks like China, India, Indonesia, Russia and Germany will all increase their emissions. Further, there is no indication that most countries have any intention of drastically reduce their emissions. To pretend otherwise is to ignore a truism, what I will term the First Law of Climate Mitigation

To reduce global greenhouse gas emissions, the aggregate reduction in countries that reduce their emissions must be greater than aggregate increase in emissions in all other countries.

Modeled projections and targets are rendered meaningless if this truism is ignored. Yet this is what the proposers of climate mitigation policy have been effectively doing for many years. Emissions will therefore breach the mythical 2°C warming barrier, but based on recent data I believe warming will be nowhere near that level.

Kevin Marshall


Joe Romm inadvertently exposes why Paris Climate Agreement aims are unachievable

Summary

Joe Romm promotes a myth that the Paris Climate Agreement will make a huge difference to future greenhouse gas emissions. Below I show how the modelled impact of think tank Climate Interactive conclusion of a large difference is based on emissions forecasts of implausible large emissions growth in policy countries, and low emissions growth in the non-policy developing countries.


In the previous post I looked at how blogger Joe Romm falsely rebutted a claim that President Donald Trump had made that the Paris climate deal would only reduce only reduce future warming in 2100 by a mere 0.2°C. Romm was wrong on two fronts. He first did not check the data behind his assertions and second,  in comparing two papers by the same organisation he did not actually read the explanation in the later paper on how it differed from the first. In this post I look at how he has swallowed whole the fiction of bogus forecasts, that means the mere act of world leaders signing a bit of paper leads to huge changes in forecast emissions.

In his post  Trump falsely claims Paris deal has a minimal impact on warming, Romm states

In a speech from the White House Rose Garden filled with thorny lies and misleading statements, one pricks the most: Trump claimed that the Paris climate deal would only reduce future warming in 2100 by a mere 0.2°C. White House talking points further assert that “according to researchers at MIT, if all member nations met their obligations, the impact on the climate would be negligible… less than .2 degrees Celsius in 2100.”

The Director of MIT’s System Dynamics Group, John Sterman, and his partner at Climate Interactive, Andrew Jones, quickly emailed ThinkProgress to explain, “We are not these researchers and this is not our finding.”

They point out that “our business as usual, reference scenario leads to expected warming by 2100 of 4.2°C. Full implementation of current Paris pledges plus all announced mid-century strategies would reduce expected warming by 2100 to 3.3°C, a difference of 0.9°C [1.6°F].”

The reference scenario is RCP8.5, used in the IPCC AR5 report published in 2013 and 2014. This is essentially a baseline non-policy forecast against which the impact of climate mitigation policies can be judged. The actual RCP website produces emissions estimates by type of greenhouse gas, of which breaks around three-quarters is CO2. The IPCC and Climate Interactive add these different gases together with an estimate of global emissions in 2100. Climate Interactive current estimate as of April 2017 is 137.58 GtCO2e for the the reference scenario and the National Plans will produce 85.66 GTCO2e. These National would allegedly make global emissions 37.7% than they would have been without them, assuming they are extended beyond 2030. Climate Interactive have summarized this in a graph.

To anyone who actually reads the things, this does not make sense. The submissions made prior to the December 2015 COP21 in Paris were mostly political exercises, with very little of real substance from all but a very few countries, such as the United Kingdom. Why it does not make sense becomes clear from the earlier data that I extracted from Climate Interactives’ C-ROADS Climate Simulator version v4.026v.071 around November 2015.  This put the RCP8.5 global GHG emissions estimate in 2100 at the equivalent of 139.3 GtCO2e. But policy is decided and implemented at country level. To determine the impact of policy proposal there must be some sort of breakdown of emissions. C-ROADS does not provide a breakdown by all countries, but does to divide the world into up to 15 countries and regions. One derived break-down is into 7 countries or regions. That is the countries of USA, Russia, China and India, along with the country groups of EU27, Other Developed Countries and Other Developing Countries. Also available are population and GDP historical data and forecasts. Using this RCP8.5 and built-in population forecasts I derived the following GHG emissions per capita for the historical period 1970 to 2012 and the forecast period 2013 to 2100.

Like when I looked at Climate Interactives’ per capita CO2 emissions from fossil fuels estimates at the end of 2015, these forecasts did not make much sense. Given that these emissions are the vast majority of total GHG emissions it is not surprising that the same picture emerges.

In the USA and the EU I can think of no apparent reason for the forecast of per capita emissions to rise when they have been falling since 1973 and 1980 respectively. It would require for energy prices to keep falling, and for all sectors to be needlessly wasteful. The same goes for other developed countries, which along with Canada and Australia, includes the lesser developed countries of Turkey and Mexico. Indeed why would these countries go from per capita emissions similar to the EU27 now to those of the USA in 2100?

In Russia, emissions have risen since the economy bottomed out in the late 1990s following the collapse of communism. It might end up with higher emissions than the USA in 1973 due to the much harsher and extreme climate. But technology has vastly improved in the last half century and it should be the default assumption that it will continue to improve through the century. It looks like someone, or a number of people, have failed to reconcile the country estimate with the forecast decline in population from 143 million in 2010 to 117 million. But more than this, there is something seriously wrong with emission estimates that would imply that the Russian people become evermore inefficient and wasteful in their energy use.

In China there are similar issues. Emissions have increased massively in the last few decades on the back of even more phenomenal growth, that surpasses the growth of any large economy in history. But emissions per capita will likely peak due to economic reasons in the next couple of decades, and probably at a much lower level than the USA in 1973. But like Russia, population is also forecast to be much lower than currently. From a population of 1340 million in 2010, Climate Interactive forecasts population to peak at  1420 million in 2030 (from 2020 to 2030 growth slows to 2 million a year) to 1000 million in 2100. From 2080 (forecast population 1120) to 2100 population is forecast to decline by 6 million a year.

The emissions per capita for India I would suggest are far too low. When made, the high levels of economic growth were predicted to collapse post 2012. When I wrote the previous post on 30th December 2015, to meet the growth forecast for 2010-2015, India’s GDP would have needed to drop by 20% in the next 24 hours. It did not happen, and in the 18 months since actual growth has further widened the gap with forecast. Similarly forecast growth in GHG emissions are far too low. The impact of 1.25 billion people today (and 1.66 billion in 2100) is made largely irrelevant, nicely side-lining a country who has declared economic growth is a priority.

As with the emissions forecast for India, the emissions forecast for other developing countries is far too pessimistic, based again on too pessimistic growth forecasts. This mixed group of countries include the 50+ African nations, plus nearly all of South America. Other countries in the group include Pakistan, Bangladesh, Myanmar, Thailand, Indonesia, Vietnam, Haiti, Trinidad, Iraq, Iran and Kiribati. There are at least a score more I have omitted, in total making up around 42% of the current global population and 62% of the forecast population in 2100. That is 3 billion people today against 7 billion in 2100. A graph summarizing of Climate Interactive’s population figures is below.

This can be compared with total GHG emissions.

For the USA, the EU27, the other Developed countries and China, I have made more reasonable emissions per capita estimates for 2100.

These more reasonable estimates (assuming there is no technological breakthrough that makes zero carbon energy much cheaper than any carbon technology) produce a reduction in projected emissions of the same order of magnitude as the supposed reduction resulting from implementation of the National Plans. However, global emissions will not be this level, as non-policy developing nations are likely to have much higher emissions. Adjusting for this gives my rough estimate for global emissions in 2100.

The overall emissions forecast is not very dissimilar to that of RCP8.5. Only this time the emissions growth has shift dramatically from the policy countries to the non-policy countries. This is consistent with the data from 1990 to 2012, where I found that the net emissions growth was accounted for by the increase in emissions from developing countries who were not signatories to reducing emissions under the 1992 Rio Declaration. As a final chart I have put the revised emission estimates for India and Other Developing Countries to scale alongside Climate Interactives’ Scoreboard graphic at the top of the page.

This clearly shows that the emissions pathway consistent the constraining warming to  2°C will only be attained if the developing world collectively start reducing their emissions in a very few years from now. In reality, the priority of many is continued economic growth, which will see emissions rise for decades.

Concluding Comments

This is a long post, covering a lot of ground. In summary though it shows environmental activist has Joe Romm has failed to check the claims he is promoting. An examination of Climate Interactive (CI) data underlying the claims that current policies will reduce global temperature by 0.9°C through reducing GHG global emissions does not stand up to scrutiny. That 0.9°C claim is based on global emissions being around 35-40% lower than they would have been without policy. Breaking the CI data down into 7 countries and regions reveals that

  • the emissions per capita forecasts for China and Russia show implausibly high levels of emissions growth, when they show peak in a few years.
  • the emissions per capita forecasts for USA and EU27 show emissions increasing after being static or falling for a number of decades.
  • the emissions per capita forecasts for India and Other Developing Countries show emissions increasing as at implausibly lower rates than in recent decades.

The consequence is that by the mere act of signing an agreement makes apparent huge differences to projected future emissions. In reality it is folks playing around with numbers and not achieving anything at all, except higher energy prices and job-destroying regulations. However, it does save the believers in the climate cult from having to recognize the real world. Given the massed hordes of academics and political activists, that is a very big deal indeed.

Kevin Marshall 

Joe Romm falsely accuses President Trump understating Impact of Paris Deal on Global Warming

Joe Romm of Climate Progress had a post two weeks ago Trump falsely claims Paris deal has a minimal impact on warming

Romm states

In a speech from the White House Rose Garden filled with thorny lies and misleading statements, one pricks the most: Trump claimed that the Paris climate deal would only reduce future warming in 2100 by a mere 0.2°C. White House talking points further assert that “according to researchers at MIT, if all member nations met their obligations, the impact on the climate would be negligible… less than .2 degrees Celsius in 2100.”

The deeply prejudiced wording, written for an extremely partisan readership, encourages readers to accept the next part without question.

The 0.2°C estimate used by Trump may be from another MIT group; the Joint Program on the Science and Policy of Global Change did have such an estimate in early 2015, before all of the Paris pledges were in. But, their post-Paris 2016 analysis also concluded the impact of the full pledges was closer to 1°C.

The source for the 0.2°C claim is the MIT JOINT PROGRAM ON THE SCIENCE AND POLICY OF GLOBAL CHANGE. ENERGY & CLIMATE OUTLOOK PERSPECTIVES FROM 2015

This states

New in this edition of the Outlook are estimates of the impacts of post-2020 proposals from major countries that were submitted by mid-August 2015 for the UN Conference of Parties (COP21) meeting in Paris in December 2015.

So what INDC submissions were in by Mid-August? From the submissions page (and with the size of total 2010 GHG Emissions from the Country Briefs) we get the following major countries.

In box 4 of the outlook, it is only Korea that is not included in the 0.2°C impact estimate. That is just over half the global emissions are covered in the MIT analysis. But there were more countries who submitted after mid-August.

The major countries include

 
My table is not fully representative, as the UNFCCC did not include country briefs for Nigeria, Egypt, Saudi Arabia, Iran, Iraq, Kuwait and UAE. All these countries made INDC submissions along with a lot of more minor GHG emitters. I would suggest that by mid-August all the major countries that wanted to proclaim how virtuous they are in combating climate change were the early producers of the INDC submissions. Countries like the Gulf States, India and Indonesia tended to slip their documents in somewhat later with a lot of measly words to make it appear that they were proposing far more than token gestures and pleas for subsidies. Therefore, the 0.2°C estimate likely included two-thirds to three-quarters of all the real emission constraint proposals. So how does an analysis a few months later produce almost five times the impact on emissions?

The second paragraph of the page the later article Joe Romm links to clearly states difference in methodology between the two estimates.


A useful way to assess that impact is to simulate the effects of policies that extend the Agreement’s 188 pledges (known as Nationally Determined Contributions, or NDCs) to the end of the century. In a new study that takes this approach, a team of climate scientists and economists from the MIT Joint Program on the Science and Policy of Global Change led by research scientist Andrei Sokolov finds that by 2100, the Paris Agreement reduces the SAT considerably, but still exceeds the 2 C goal by about 1 C.

The primary difference is that the earlier study tries to measure the actual, real world, impacts of existing policy, and policy pledges, if those policies are fully enacted. In the USA, those pledges would need Congressional approval to be enacted. The later study takes these submissions, (which were only through to 2030) and tries to estimate the impact if they were extended until 2100.  That is renewables subsidies that push up domestic and business energy costs would be applied for 85 years rather than 15. It is not surprising that if you assume policy proposals are extended for over five times their original period, that they will produce almost five times the original impact. To understand this all that is required is to actually read and comprehend what is written. But Joe Romm is so full of bile for his President and so mad-crazy to save the planet from the evils of Climate Change and (mostly US) big business that he is blinded to that simple reality-check.

The fuller story is that even if all policies were fully enacted and extended to 2100, the impact on emissions would be far smaller than Joe Romm claims. That will be the subject of the next post.

Kevin Marshall

Climate Interactive’s Bogus INDC Forecast

Summary

Joe Romm wrote a post in early November claiming UNFCCC Executive Secretary Christiana Figueres had misled the public in claiming that the “INDCs have the capability of limiting the forecast temperature rise to around 2.7 degrees Celsius by 2100”. Using Climate Interactive’s figures Romm claims the correct figure is 3.5°C. That Romm had one of two sources of the 2.7°C staring at him is a side issue. The major question is how Climate Interactive can achieve a full 1.0°C reduction in expected temperature rise in 2100 and a reduction of 40% in 2100 GHG emissions from pledges covering the period 2015, when the UNFCCC estimates will have a much smaller impact in 2030? Looking at the CO2 emissions, which account for 75-80% of GHG emissions, I have found the majority answer. For OECD countries where emissions per capita have been stable or falling for decades, the “No Action” scenario forecasts that they will rise for decades. For Russia and China, where per capita emissions are likely to peak before 2030 without any policy action, the “No Action” scenario forecasts that they will rise for decades. This is largely offset by Climate Interactive assuming that both emissions and economic growth in India and Africa (where there are no real attempts to control emissions) will stagnate in the coming decades. Just by making more reasonable CO2 emissions forecasts for the OECD, Russia and China can account for half of the claimed 2100 reduction in GHG emissions from the INDC. Climate Interactive’s “No Action” scenario is bogus.


Joe Romm’s use of the Climate Interactive projection

A couple of months ago, prior to the COP21 Paris climate talks, Joe Romm at Climate Progress criticized the claim made in a press release by UNFCCC Executive Secretary Christiana Figueres:

The INDCs have the capability of limiting the forecast temperature rise to around 2.7 degrees Celsius by 2100, by no means enough but a lot lower than the estimated four, five, or more degrees of warming projected by many prior to the INDCs

Romm’s note to the media is

If countries go no further than their current global climate pledges, the earth will warm a total of 3.5°C by 2100.

At a basic level Romm should have done some proper research. As I found out, there are two sources of the claim that are tucked away at the end of a technical appendix to the UNFCCC Synthesis report on the aggregate effect of INDCs. One of these is Climate Action Tracker. On their home page they have a little thermometer which shows the 2.7°C figure. Romm would have seen this, as he refers in the text to CAT’s page on China. The significance may not have registered.

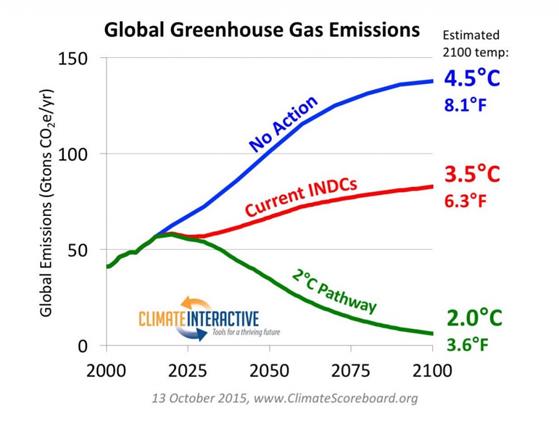
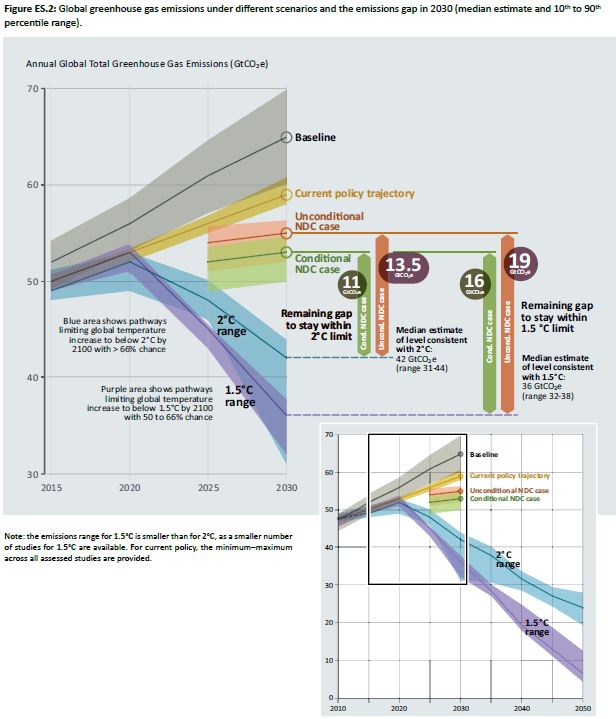
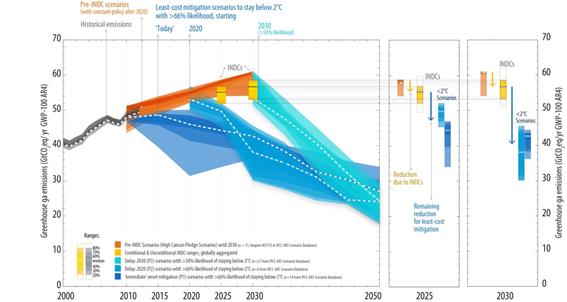
However, the purpose of this post is not to criticize Romm, but the Climate Interactive analysis that Romm uses as the basis of his analysis. Is the Climate Interactive Graph (reproduced in Figure 1) a reasonable estimate of the impact of the INDC submissions (policy pledges) on global emissions?1

Figure 1. Climate Interactive’s graph of impact of the INDC submissions to 2100

What struck me as odd when I first saw this graph was how the INDCs could make such a large impact beyond the 2015-2030 timeframe that they covered when the overall impact was fairly marginal within that timeframe. This initial impression is confirmed by the UNFCCC’s estimate of the INDCs

Figure 2. UNFCCC’s estimate of emissions impact of the INDCs, with the impact shown by the yellow bars. Original here.

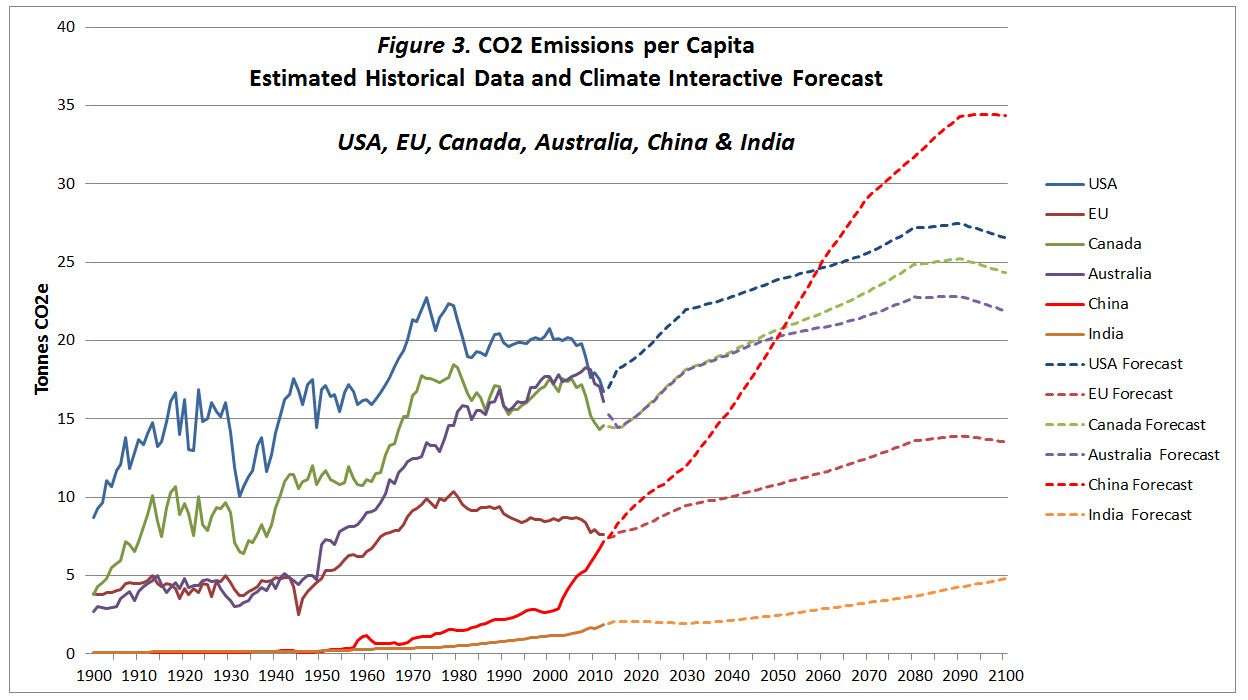
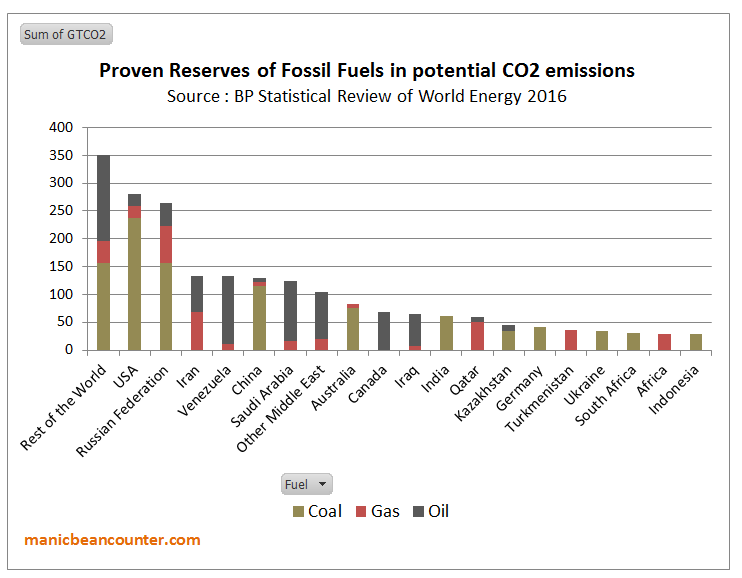
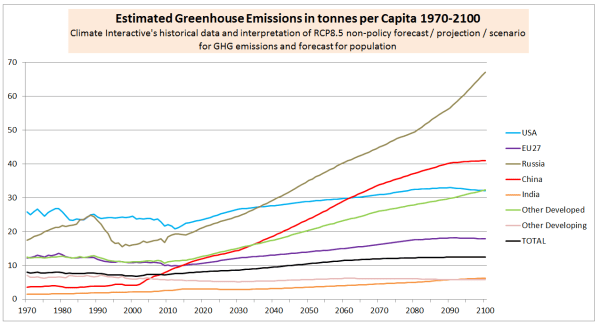
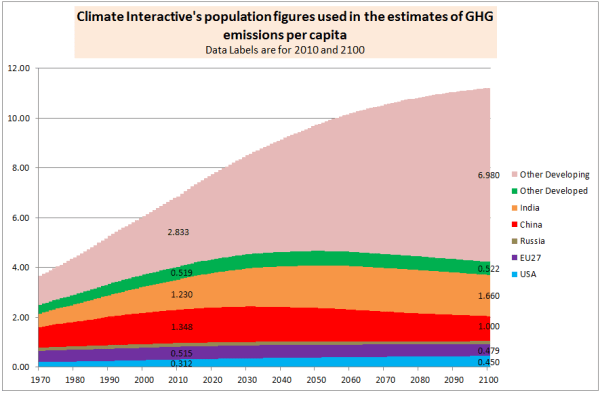
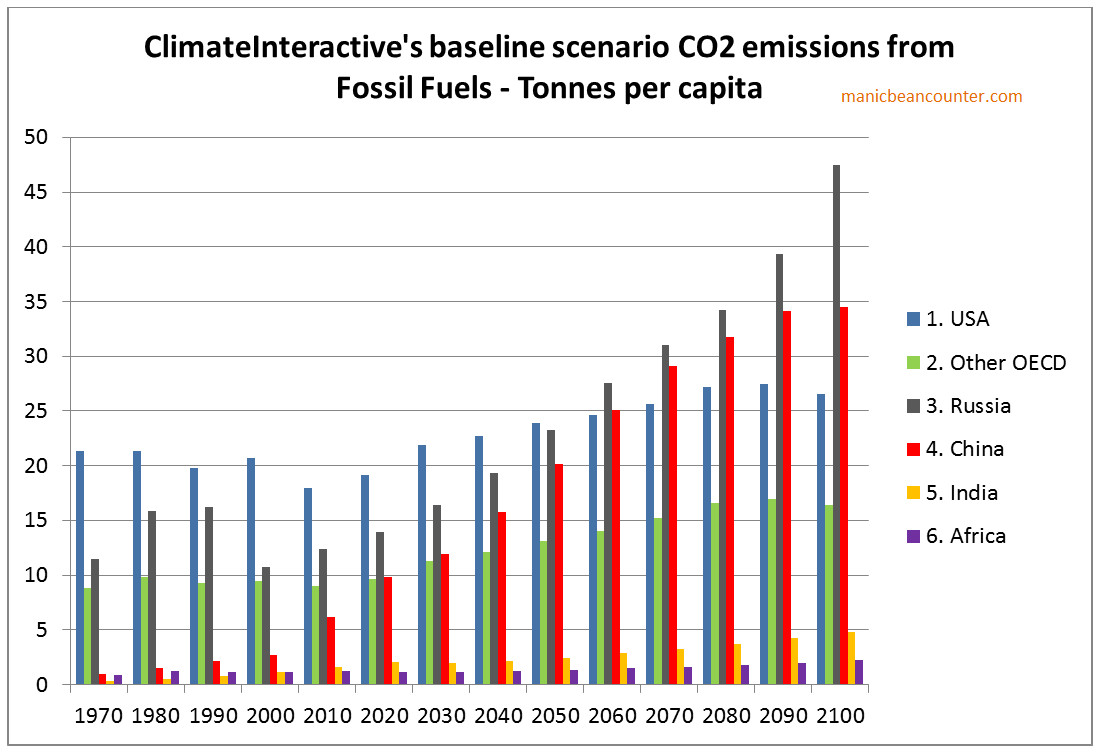
There are two things that do not stack up. First is that the “No Action” scenario appears to be a fairly reasonable extrapolation of future emissions without policy. Second, and contrary to that is the first, is that the “Current INDCs” scenario does not make sense in terms of what I have read in the INDCs and is confirmed by the INDCs. To resolve this requires looking at the makeup of the “No Action” scenario. Climate Interactive usefully provide the model for others to do their own estimates,2 With the “User Reference Scenario” giving the “no action” data3, split by type of greenhouse gas and into twenty regions or countries. As about 75-80% of emissions with the model are CO2 Fossil Fuel emissions, I will just look at this area. For simplicity I have also reduced the twenty regions or countries into just seven. That is USA, Other OECD, Russia, China, India, Africa and Rest of the World. There are also lots of ways to look at the data, but some give better understanding of the data than others. Climate Interactive also have population estimates. Population changes over a long period can themselves result in changed emissions, so looking at emissions per capita gives a better sense of the reasonableness of the forecast. I have graphed the areas in figure 3 for the historical period 1970-2010 and the forecast period 2020-2100.

Figure 3 : Fossil Fuel Emissions per capita for six regions from the Climate Interactive “No Action” Scenario.

Understanding the CO2 emissions forecasts

In the USA, emissions per capita peaked at the time of 1973 oil embargo. Since then they have declined slightly. There are a number of reasons for this.

First, higher oil prices gave the economic incentives to be more efficient in usage of oil. In cars there have been massive improvements in fuel efficiency since that time. Industry has also used energy more efficiently. Second, there has been a growth in the use of nuclear power for strategic reasons more than economic. Third is that some of the most energy intensive industries have shifted to other countries, particularly steel and chemicals. Fourth, is that growth in developed countries is mostly in the service sector, whereas growth in developing countries is mostly in manufacturing. Manufacturing tends to have much higher energy usage per unit of output than services. Fifth, is that domestic energy usage is from cars and power for the home. In an emerging economy energy usage will rise rapidly as a larger proportion of the population acquire cars and full heating and lighting systems in the home. Growth is much slower once most households have these luxuries. Sixth is that in the near future emissions might continue to fall with the development of shale gas, with its lower emissions per unit of power than from coal.

I therefore cannot understand why anyone would forecast increasing emissions per capita in the near future, when they have been stable or falling in for decades. Will everyone start to switch to less efficient cars? When these forecasts were made oil was at $100 a barrel levels, and many thought peak oil was upon us. Would private sector companies abandon more efficient energy usage for less efficient and higher cost usage? The USA may abandon nuclear power and shift back to coal for political reasons. But in all forms of energy, production and distribution is likely to continue to become more efficient in all forms.

In the rest of the OECD, there are similar patterns. In Europe energy usage was never as high. In some countries without policy CO2 emissions may rise slightly. In Germany they are replacing nuclear power stations with coal for instance. But market incentives will increase energy efficiency and manufacturing will continue to shift to emerging nations. Again, there appears no reason for a steady increase in emissions per capita to increase in the future.

Russia has a slightly different recent past. Communist central planning was highly inefficient and lead to hugely inefficient energy usage. With the collapse of communism, energy usage fell dramatically. Since then emissions have been increasing, but more slowly than the economy as a whole. Emissions will peak again in a couple of decades. This will likely be at a lower level than in the USA in 1970, despite the harsher climate, as Russia will benefit from technological advances in the intervening period. There is no reason for emissions to go on increasing at such a rapid rate.4

China has recently had phenomenal growth rates. According to UN data, from 1990 to 2012, economic growth averaged 10.3% per annum and CO2 emissions 6.1%. In the not too distant future economic growth will slow as per capita income approaches rich country levels, and emissions growth will slow or peak. But the Climate Interactive forecast has total emissions only peaking in 2090. The reason for China’s and Russia’s forecast per capita emissions exceeding those of the USA is likely due to a failure to allow for population changes. In USA population is forecast to grow, whilst in China and Russia population is forecast to fall.

India has the opposite picture. In recently years economic and CO2 emissions growth has taken off. Current policies of Prime Minister Narendra Modi are to accelerate these growth rates. But in the Climate Interactive forecast growth, economic growth and CO2 emissions growth plummet in the near future. Economic growth is already wrong. I am writing on 30/12/15. To meet the growth forecast for 2010-2015, India’s GDP will need to drop by 20% in the next 24 hours.5

For the continent of Africa, there have been encouraging growth signs in the last few years, after decades when many countries saw stagnation or even shrinking economies. Climate Interative forecasts similar growth to India, but with a forecasts of rapid population growth, the emissions per capita will hardly move.

Revised CO2 emissions forecasts

It is extremely difficult and time consuming to make more accurate CO2 emissions forecasts. As a shortcut, I will look at the impact of revisions on 2100, then at the impact on the effect of the INDCs. This is laid out in Figure 4

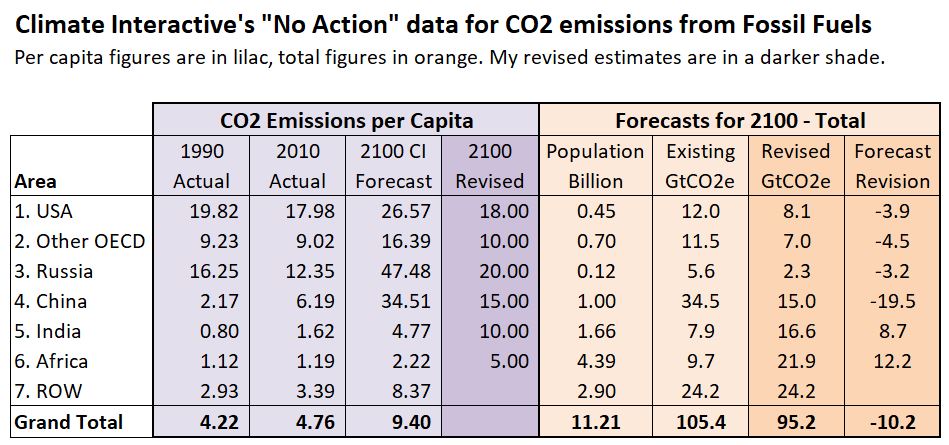
Figure 4 : Revised Forecast CO2 Emissions from Fossil Fuels

The first three columns in pale lilac are for CO2 emissions per capita calculated, from the Climate Interactive data. In the 2100 Revised column are more realistic estimates for reasons discussed in the text. In the orange part of the table are the total forecast 2100 Climate Interactive figures for population and CO2 emissions from fossil fuels. In darker orange is the revised emissions forecast (emissions per capita multiplied by forecast population) and the impact of the revision. Overall the forecast is 10.2GtCO2e lower, as no calculation has been made for the rest of the world. To balance back requires emissions of 11.89 tonnes per capita for 2.9 billion people. As ROW includes such countries as Indonesia, Bangladesh, Iran, Vietnam, Brazil and Argentina this figure might be unreasonable 85 years from now.

The revised impact on the INDC submissions

The INDC submissions can be broken down.

The USA, EU, Japan and Australia all have varying levels of cuts to total emissions. So for the OECD as a whole I estimate Climate Interactive over estimates the impact of the INDCs by 8.4GtCO2e

The Russian INDC pledge it is unclear, but it seems to be saying that emissions will peak before 2030 at below 1990 levels6. As my revised forecast is above this level, I estimate Climate Interactive over estimates the impact of the INDCs by 3.2GtCO2e

The Chinese INDC claims pledges that its emissions will have peaked by 2030. This will have happened anyway and at around 10-12 tonnes per capita. I have therefore assumed that emissions will stay constant from 2030 to 2100 whilst the population is falling. Therefore I estimate that Climate Interactive over estimates the impact of the INDCs by 19.5GtCO2e

Overall for these areas the overestimation is around 31 GtCO2e. Instead of 63.5GtCO2e forecast for these countries for 2100 it should be nearer 32.5GtCO2e. This is about half the total 2100 reduction that Climate Interactive claims that the INDC submission will make from all types of greenhouse gases. A more rigorous forecast may have lower per capita emissions in the OECD and China. There may be other countries where similar forecast issues of CO2 emissions might apply. In addition, in note 7 I briefly look at the “No Action” CH4 emissions, the second largest greenhouse gas. There appear to be similar forecast issued there.

In summary, the make-up of the CO2 emissions “No Action” forecast is bogus. It deviates from an objective and professional forecast in a way that grossly exaggerates the impact of any actions to control GHG emissions, or even pledges that constitute nothing more than saying what would happen anyway.

Notes

  1. The conversion of a given quantity of emissions into average surface temperature changes is outside the scope of this article. Also we will assume that all policy pledges will be fully implemented.
  2. On the Home page use the menu for Tools/C-ROADS. Then on the right hand side select “Download C-ROADS”. Install the software. Run the software. Click on “Create New Run” in the centre of the screen.


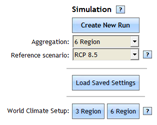
    This will generate a spreadsheet “User Scenario v3 026.xls”. The figures I use are in the User Reference Scenario tab. The software version I am working from is v4.026v.071.

  3. The “User Reference Scenario” is claimed to be RCP 8.5. I may post at another time on my reconciliation between the original and the Climate Interactive versions.
  4. The forecast estimates for economic growth and emissions for Russia look quite bizarre when the 5 year percentage changes are graphed.


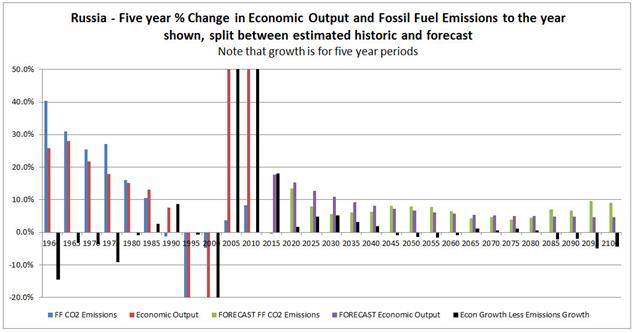
    I cannot see any reason for growth rates to fall to 1% p.a in the long term. But this is the situation with most others areas as well. Nor can I think of a reason for emissions growth rates to increase from 2030 to 2055, or after 2075 expect as a contrivance for consistency purposes.

  5. The forecast estimates for economic growth and emissions for India look even more bizarre than for Russia when the 5 year percentage changes are graphed.


    I am writing on 30/12/15. To meet the growth forecast for 2010-2015, India’s GDP will need to drop by 20% in the next 24 hours. From 2015 to 2030, the period of the INDC submissions, CO2 emissions are forecast to grow by 8.4%. India’s INDC submission implies GHG emissions growth from 2014 to 2030 of 90% to 100%. Beyond that India is forecast to stagnate to EU growth rates, despite being a lower to middle income country. Also, quite contrary to Russia, emissions growth rates are always lower than economic growth rates.

  6. The Russian Federation INDC states

    Limiting anthropogenic greenhouse gases in Russia to 70-75% of 1990 levels by the year 2030 might be a long-term indicator, subject to the maximum possible account of absorbing capacity of forests.

    This appears as ambiguous, but could be taken as meaning a long term maximum.

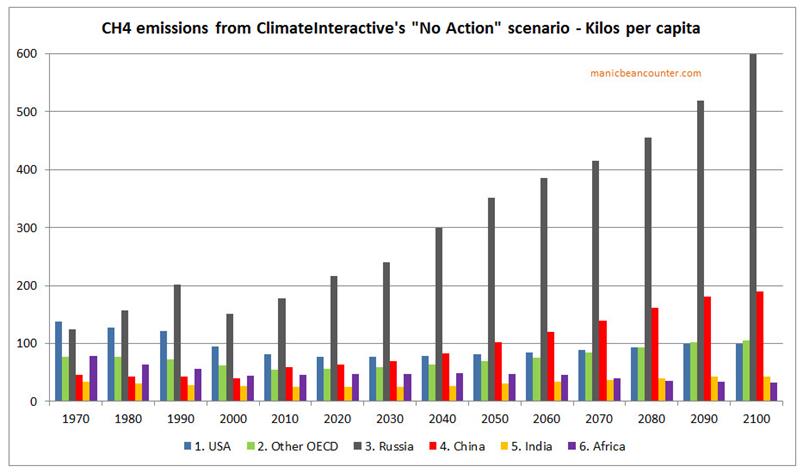
  7. CH4 (Methane) emissions per Capita

    I have quickly done a similar analysis of methane emissions per capita as in Figure 2 for CO2 emissions. The scale this time is in kilos, not tonnes.

    There are similarities

  • OECD emissions had been falling but are forecast to rise. The rise is not as great as for CO2.
  • In Russia and China emissions are forecast to rise. In Russia this is by a greater amount than for CO2, in China by a lesser amount.
  • In Africa, per capita emissions are forecast to fall slightly. Between 2010, CH4 emissions are forecast to rise 3.1 times and population by 4.3 times.
  • In both the USA and Other OECD (a composite of CI’s categories) total CH4 emissions are forecast in 2100 to be 2.778 times higher than in 2010. In both China and India total CH4 emissions are forecast in 2100 to be 2.420 times higher than in 2010.


Lomborg and the Grantham Institute on the INDC submissions

Bjorn Lomborg has a new paper published in the Global Policy journal, titled: Impact of Current Climate Proposals. (hattip Bishop Hill and WUWT)

From the Abstract

This article investigates the temperature reduction impact of major climate policy proposals implemented by 2030, using the standard MAGICC climate model. Even optimistically assuming that promised emission cuts are maintained throughout the century, the impacts are generally small. ………… All climate policies by the US, China, the EU and the rest of the world, implemented from the early 2000s to 2030 and sustained through the century will likely reduce global temperature rise about 0.17°C in 2100. These impact estimates are robust to different calibrations of climate sensitivity, carbon cycling and different climate scenarios. Current climate policy promises will do little to stabilize the climate and their impact will be undetectable for many decades.

That is pretty clear. COP21 in Paris is a waste of time.

An alternative estimate is provided in a paper by Boyd, Turner and Ward (BTW) of the LSE Grantham Institute, published at the end of October.

They state

The most optimistic estimate of global emissions in 2030 resulting from the INDCs is about halfway between hypothetical ‘business as usual’ and a pathway that is consistent with the 2°C limit

The MAGICC climate model used by both Lomborg & the IPCC predicts warming of about 4.7°C under BAU, implying up to a 1.35°C difference from the INDCs, compared to the 0.17°C maximum calculated by Lomborg, 8 times the amount. Lomborg says this is contingent on no carbon leakage (exporting industry from policy to non-policy countries), whilst citing studies showing that it could offset 10-40%, or even over 100% of the emissions reduction. So the difference between sceptic Lomborg and the mighty LSE Grantham Institute is even greater than 8 times. Yet Lomborg refers extensively to the August Edition of BTW. So why the difference? There is no explicit indication in BTW of how they arrive at their halfway conclusion. nor a comparison by Lomborg.

Two other estimates are from the UNFCCC, and Climate Action Tracker. Both estimate the INDCs will constrain warming to 2.7°C, or about 2.0°C below the MAGICC BAU scenario. They both make assumptions about massive reductions in emissions post 2030 that are not in the INDCs. But at least the UNFCCC and CAT have graphs that show the projection through to 2100. Not so with BTW.

This is where the eminent brain surgeons and Nobel-Prize winning rocket scientists among the readership will need to concentrate to achieve the penetrating analytical powers of a lesser climate scientist.

From the text of BTW, the hypothetical business as usual (BAU) scenario for 2030 is 68 GtCO2e. The most optimistic scenario for emissions from the INDCs (and pessimistic for economic growth in the emerging economies) us that 2030 emissions will be 52 GtCO2e. The sophisticated climate projection models have whispered in code to the climate scientists that to be on target for the limit of 2.0°C, 2030 emissions show be not more than 36 GtCO2e. The mathematicians will be able to determine that 52 is exactly halfway between 36 and 68.

Now for the really difficult bit. I have just spent the last half hour in the shed manically cranking the handle of my patent beancounter extrapolator machine to get this result. By extrapolating this halfway result for the forecast period 2010-2030 through to 2100 my extrapolator tells me the INDCs are halfway to reaching the 2.0°C maximum warming target.

As Bob Ward will no doubt point out in his forthcoming rebuttal of Bjorn Lomborg’s paper, it is only true climate scientists who can reach such levels of analysis and understanding.

I accept no liability for any injuries caused, whether physical or psychological, by people foolishly trying to replicate this advanced result. Please leave this to the experts.

But there is a serious side to this policy advocacy. The Grantham Institute, along with others, is utterly misrepresenting the effectiveness of policy to virtually every government on the planet. Lomborg shows by rigorous means that policy is ineffective even if loads of ridiculous assumptions are made, whether on climate science forecasting, policy theory, technological solutions, government priorities, or the ability of  current governments to make policy commitments for governments for decades ahead. My prediction is that the reaction of the Grantham Institute, along with plenty of others, is a thuggish denunciation of Lomborg. What they will not consider is the rational response to wide differences of interpretation. That is to compare and contrast the arguments and the assumptions made, both explicit and implicit. 

Kevin Marshall

Indonesia Outflanks the Climate Activists in its INDC Submission

I have spent a few weeks trying to make sense of the INDC submissions. One of the most impenetrable appeared to that from Indonesia. This view is shared by The Carbon Brief.

Uncertain emissions

As well as being hazy on policy and financing needs, it is also difficult to gauge the ambition of Indonesia’s INDC emissions targets. This is despite the document including a projected figure for BAU emissions in 2030 of 2.9bn tonnes of CO2 equivalent (GtCO2e).

The pledge to reduce emissions by at least 29% compared to this trajectory means an effective cap in 2030 of 2GtCO2e. With the more ambitious 41% reduction compared to BAU, the cap would be 1.7GtCO2e.


Similarly the World Resources Institute states

(T)he current draft contribution still displays several important gaps in transparency and ambition, which must be addressed before submitting a final INDC to the United Nations Framework Convention on Climate Change (UNFCCC). By eliminating these gaps, the Indonesian government could bring its contribution into line with international best practices on transparency, demonstrate leadership internationally by enhancing ambition, and help ensure success at COP 21.

The context from Indonesia’s perspective is stated in the opening paragraph of Indonesia’s INDC Submission.

In more basic language, Indonesia has more important and immediate priorities than “climate change“. From a national point of view, imposing drastic and ineffective policies will go against the Indonesian Government’s perceived duty to its people. This will happen regardless of the truth of the projected catastrophes that await the planet without global mitigation. The policies will be ineffective because most other emerging economies have similar priorities to Indonesia, and are taking similar measures of policy avoidance. In the case of Indonesia these are

  • Cherry-picking a base year.
  • Making reductions relative to a fictional “Business as Usual” scenario with inflated economic growth figures.
  • Making sure that even the most ambitious objectives achievable within the range of an objective forecast.
  • Focus the negotiations on achieving the conditional objectives subject to outside assistance. Any failure to reach agreement then becomes the fault of rich countries failing to provide the finance.
  • Allow some room to make last minute concessions not in the original submission, contingent on further unspecified outside assistance that is so vast the money will never be forthcoming.

The calculations to achieve the figures in the submissions are fairly simple to work out with a bit of patience.


Calculating the 2030 Business as Usual 2881 MtCO2e

The Indonesian INDC submission states that in 2005 total emissions were 1800 MtCO2e and combustion of fossil fuels were 19% of this total. That implies about 342 MtCO2e from the combustion of fossil fuels. The Carbon Dioxide Information Analysis Center (CDIAC1) has an estimated figure of 341.71 MtCO2e and the UNFCCC Country Brief in 2005 “CO2 emissions from fuel combustion” were 335.71 MtCO2e. For 20112 the CDIAC estimate is 472.53 MtCO2e, rounded to 473. Let us now assume a growth rate in emissions of 6.0% per annum from 2012 to 2030, against an economic growth rate of around 5.2% from 2000 to 2010 and 5.8% from 2005 to 20103. At 6.0% compound growth fossil fuel emissions in 20304 will be 1431 MtCO2e.

The non-fossil fuel emissions are a bit more problematic to work out. In 2005 the baseline estimate is 81% of 18005 is 1458. It is only a vague estimate, so round it down to 1450 and then assume it is constant for the Business as Usual (BAU) scenario.

The BAU 2030 total emissions forecast for Indonesia is therefore 1431 + 1450 = 2881 MtCO2e.

There might be other ways to derive this figure, but none are simpler and the figures do not fall out exactly.


How does Indonesia achieve the unconditional 29% reduction against BAU?

The easiest part to achieve is outside of fossil fuel emissions. The major cause of these emissions is in the reduction of the rainforests. The Carbon Brief is claims the biggest source of non-fossil fuel emissions is due to illegal forest clearances to grow palm oil. Although in 2015 the forest fires are closing in on the record set in 1997, it is safe to say that that these will reduce considerably in the coming years as Indonesia already has 52% of world palm oil production. By assuming a 3.34% reduction per annum in these emissions from 2005, they will reduce from 1450 MtCO2e to 611 MtCO2e in 2030. Total emissions of 2042 MtCO2e (1431+611) are 29.1% lower than BAU without an expense on the part of the Indonesian Government.


How does Indonesia achieve the conditional 41% reduction against BAU?

Indonesia claims that it needs international cooperation increase the reduction against BAU to 41%. In whole numbers, if BAU is 2881 a 41% reduction would make 1700. Not 1699 or 1701, but 1700. This is 100 less than the estimated 1800 MtCO2e total GHG emissions for 2005. This will be achieved without any “international cooperation“, a euphemism for foreign aid. The reason is simple. From the UNFCCC Indonesia Country Brief for Indonesia GDP growth for 1990 to 2012 average GDP growth per annum was 4.9% and CO2 emissions from fuel combustion was 5.1%. Normally GDP growth exceeds emissions growth. As a country develops this gap will widen until emissions growth ceases altogether and will even fall slightly. In India GDP growth from 1990 to 2012 averaged 6.5% and emissions growth was 5.7%. In China the respective figures are 10.3% and 6.1%. In China, emissions will peak around 2025 to 2030 without any policy change. It is reasonable to assume therefore that forecast fossil fuel emissions growth will be at a lower rate than the forecast GDP growth of 6.0%. A conservative estimate is that the fossil fuel emissions growth rate will be 25% lower than GDP growth rate from 2011 to 2030 at 4.50%. Rounding as before4 gives forecast emissions of 1089 MtCO2e as against a BAU of 1431.

The revised 2030 total emissions forecast for Indonesia is 1089 + 611 = 1700 MtCO2e. This is a 41.0% reduction on the BAU of 2881 MtCO2e.


Why should Indonesia have such a cynical manipulation of the numbers?

Indonesia is caught between a rock and a hard place. The stated major priorities for this country of 250 million people are at odds with doing its bit to save the world. In this Indonesia is not alone. India, China, and Vietnam are other major emerging nations who site other priorities. Ranged against them are the activist scientists behind the climate scare who hold the a priori truth of the prophesied global warming catastrophes that await the planet if we do not amend out wicked ways. Further, mitigation policies are good for the sole, regardless of their effectiveness, and the practice of these policies will lead others to enlightenment they have found. They will not recognize that any alternative points of view exist, whether morally, politically or scientifically. Rather than argue, the best policy is to outflank them. The activists will accept official policy objectives without question so long as it appears to fit the cause. So the Indonesians gave them massive cuts related to fictitious projected figures, cloaked with the language of climate speak to throw them off the scent. They should be applauded for protecting 250 million people, rather than inflicting ineffective burdens upon them. The real shame is that the leaders of the so-called developed economies have fallen for this rubbish.

Kevin Marshall

Notes

  1. Reference of the full global carbon budget 2014: C. Le Quéré, R. Moriarty, R. M. Andrew, G. P. Peters, P. Ciais, P. Friedlingstein, S. D. Jones, S. Sitch, P. Tans, A. Arneth, T. A. Boden, L. Bopp, Y. Bozec, J. G. Canadell, F. Chevallier, C. E. Cosca, I. Harris, M. Hoppema, R. A. Houghton, J. I. House, A. K. Jain, T. Johannessen, E. Kato, R. F. Keeling, V. Kitidis, K. Klein Goldewijk, C. Koven, C. S. Landa, P. Landschützer, A. Lenton, I. D. Lima, G. H. Marland, J. T. Mathis, N. Metzl, Y. Nojiri, A. Olsen, T. Ono, W. Peters, B. Pfeil, B. Poulter, M. R. Raupach, P. Regnier, C. Rödenbeck, S. Saito, J. E. Sailsbury, U. Schuster, J. Schwinger, R. Séférian, J. Segschneider, T. Steinhoff, B. D. Stocker, A. J. Sutton, T. Takahashi, B. Tilbrook, G. R. van der Werf, N. Viovy, Y.-P. Wang, R. Wanninkhof, A. Wiltshire, and N. Zeng 2014. Global Carbon Budget 2014. Earth System Science Data Discussions, doi:10.5194/essdd-7-521-2014
  2. 2011 is the baseline year for the IPCC reports.
  3. This can be obtained from two sources. First the INDC submission notes that “GDP Growth Rate has slowed between 2010-2015 from 6.2-6.5% per annum to only 4.0% per annum (first quarter of 2015).” A return to the higher levels of growth is an assumption of successful government policy.
  4. Each year growth of 6.0% is rounded to the nearest whole number.
  5. The 2005 total emissions estimate of 1800 MtCO2 is at odds with other estimates. The WRI CAIT 2.0 figure is 1600; the EDGAR estimate is 1171; and the UNFCCC estimate is 2828. There might be another method of estimation. Maybe it is being a bit too cynical to assume that someone could have taken the average of the three (1866) and rounded down.