Climate Necessity Defense for Minnesotan Valve Turners

Unlike the Michael Foster and other co-defendants is North Dakota, the Minnesotan Valve-Turners Emily Johnston and Annette Klapstein get their chance to present the Climate Necessity Defense. From TownHall.com (Hat tip Science Matters)

Klapstein, a retired lawyer, said they know of one case in which a judge allowed evidence about climate change but then told the jury to disregard it.

“It looks like we’re going to be able to bring in all our experts and present our evidence of how dire climate change is, so we’re pretty excited about that,” she said.

As a retired attorney, she perhaps should have read the criteria before responding.

In an order Friday, Clearwater County District Judge Robert Tiffany said the four defendants must clear a high legal bar.

In Minnesota, Tiffany wrote, a defendant asserting a necessity defense “must show that the harm that would have resulted from obeying the law would have significantly exceeded the harm actually caused by breaking the law, there was no legal alternative to breaking the law, the defendant was in danger of imminent physical harm, and there was a direct causal connection between breaking the law and preventing the harm.

The judge said it applies “only in emergency situations where the peril is instant, overwhelming, and leaves no alternative but the conduct in question.

This appears fairly clear. The Judge lays down four criteria to be met within an overriding one of emergency situations with no alternative. It is the legal equivalent of demanding that the positive impacts of an action greatly exceed the harms in very specific, very short-term, circumstances. Further, it is up to the defense to demonstrate that the circumstances apply, convincing the court in the face of cross-examinations.

There are a number of areas where I believe climate activists actions not only fails to meet these criteria, but does not even get anywhere close.

The timing issue

The emergency situations criteria are pretty immediate. An example is a police officer shooting dead a rampaging terrorist rather than maiming and performing an arrest. Another example might be destroying the car keys of someone who is drunk and intent on driving. The very short time scales of seconds or minutes exclude options that would take months or years to implement.  There are examples of where such an emergency situation does not apply to climate change policies.

If prominent climate activist Prince Charles was correct in saying in October 2009 that we have less than 100 months to save the planet, it would not have been considered an instant peril. With three months to go until the deadline, even that appears to be somewhat alarmist in the context of a lack of increase of signals of impending catastrophic consequences.

Another source is from the pinnacle of the climate establishment. The IPCC AR5 Synthesis Report gave a very rough guide to how much CO2 (or equivalent greenhouse gases) could be emitted to limit warming to less than 2°C. From 2012 it was about 1000 GtCO2e. This flowing is part of a presentation to summarize the IPCC AR5 Synthesis Report of 2014. Slide 33 of 35.

A more recent source is Miller et al 2017 Nature GeoScience. They estimate that 240 GtC (880 GtCO2e) from now will be needed to reach 1.5°C of warming. On the IPCC’s estimate then with slightly over 50GtCO2e of emissions per annum, the 2°C of warming would be reached sometime before 2032, when the climate experts are now saying the lower 1.5°C barrier will be reached sometime before 2035. Whichever you use as the barrier for breaching of dangerous climate change, that level will not be reached anytime soon according to the climate experts. There is plenty of time for a few more, tense, annual meetings with representatives of 195 nations to pontificate about mitigation policies.

So even if extreme climate alarmism is true, the expert opinion on policy strongly implies that the defendants were not “in danger of imminent physical harm”.

Finally, in 2008 the climate necessity defense was supported by James Hansen in a couple of British court cases. The detailed document prepared as written testimony for the Ratcliffe Nottingham trial is here and a 2011 commentary on the two cases by Hansen is here. As the supposed emergency in global emissions have not appeared in eight years between the testimony and the felony why should it be still considered a pressing problem? James Hansen, sometimes referred to as the Father of Climate Change after his 1988 Congressional Testimony pushed Global Warming to the fore of the political agenda, is likely to be the key witness in the necessity defence. He would have been the key witness at the trial of Micheal Foster in North Dakota last month if the necessity defense had been allowed. After the Foster Trial, Hansen wrote a long article, including arguments that will likely be presented at the Johnston and Klapstein Trail.

Indivisibility Issues

Many people in the United States believe that abortion is murder. Suppose a group managed to close down a busy abortion clinic by constant blockades and intimidation, throwing a number of people of work. An argument could be made that some of the women will not get abortions elsewhere, but will instead give birth to a child. The necessity defense criteria could, therefore, be operable. But with respect to global warming the evidence shows (and the science agrees) that it does not matter where in the world fossil fuels are burnt, the generated CO2 will be dispersed affecting the whole atmosphere. Otherwise, Eastern USA and Eastern China would have much higher concentrations of CO2 than in Africa, Antarctica or over the oceans that cover 70% of the earth’s surface.  Neither does that CO2 leave the atmosphere quickly but could remain in the atmosphere for many decades or even centuries. Therefore, the marginal impact delaying the transportation of one type of fossil fuel in one country for a few hours will have no significant impact on generations of people yet to come. As a rough estimate, the combined actions of the valve-turners (of which Micheal Foster on the Keystone Pipeline was by far the biggest contribution), was to delay the transportation of less than a million barrels of oil. That is to delay the transportation of around 1% of the daily global output of about 92 million barrels. A million barrels (140,000 tonnes) will produce around 400,000 tonnes of CO2. That is 0.4 million tonnes or 0.0004 billion tonnes. This 0.0004 GtCO2 is 0.00004% of the 1000 GtCO2e (million million) of emissions by the IPCC to breach the dangerous 2°C of warming barrier. The impact of Valve-Turners Emily Johnston and Annette Klapstein is somewhat less than this. The difference between “the harm that would have resulted from obeying the law” and “the harm actually caused by breaking the law” is infinitesimally small.

Local Harms, Wider Benefits

There is another set of harms to be considered.  That is the immediate costs of property damage and business disruption from the activists’ actions, along with the time and expense of law enforcement. Even if the action could be shown to have benefits exceeding the costs, for the actual persons or entities targeted that position will be reversed. So, hypothetically, if the benefits of stopping a few hundred thousand tonnes of emissions are even $100,000,000, and the immediate costs are just $1,000,000, the benefits are across the planet decades or centuries in the future and shared by tens of billions of people, whilst the costs are immediate and disproportionately borne by very few victims that the activists select. In reality, the benefits are likely far less, and the full costs somewhat more.

The catalyst effect of the action

As this was an act of climate activism, there was probably no intention that this act would stop climate change. Rather, that the act could serve as a catalyst for action to constrain emissions. It could serve as a wake-up call to policy-makers. A year later it is possible to see any impacts.

In the United States, less than a month after the valve turners did their deeds Donald Trump was elected President and subsequently has begun to rescind climate change policies. There appears to have been no impact on the Presidential elections. If it had, then criminal acts would have influenced the election, something that would have undermined the democratic process.

Another justification could be one of a catalyst for many more criminal actions. Again, there seems to be no surge in climate activism, whether through legal or illegal means does not seem to have happened. Further, lawyers might caution against using the catalyst argument in court to defend criminal acts.

So the catalyst defense (which may not be admissible under Judge Tiffany’s criteria) doesn’t seem to have worked out.

Non-exhaustion of legal policy initiatives

Judge Tiffany’s final specification was

leaves no alternative but the conduct in question.

Was there no alternative? There are two basic criteria necessary, but not sufficient, for the necessity defense to justify an otherwise illegal activity. First, that legal alternatives have been exhausted and second, that the illegal alternative has at least an expectation of being remotely effective. As already stated, the consensus believes that to prevent catastrophic climate change means permanently eliminating global greenhouse gas emissions. With respect to the burning of fossil fuels (about two-thirds of global GHG emissions), this is on the twin fronts of reducing global emissions to near zero and ensuring permanently leaving fossil fuels in the ground.

Possibilities for closing the policy gap

The global efforts to reduce global GHG emissions culminated in the Paris Agreement, written at the end of December 2015 and signed by most countries. The Adoption of the Paris Agreement proposal; Section II, Point 17 notes gives an indication of the gap between the aggregate impact of all the vague policy initiatives and the desired policy goal.

17. Notes with concern that the estimated aggregate greenhouse gas emission levels in 2025 and 2030 resulting from the intended nationally determined contributions do not fall within least-cost 2˚C scenarios but rather lead to a projected level of 55 gigatonnes in 2030, and also notes that much greater emission reduction efforts will be required than those associated with the intended nationally determined contributions in order to hold the increase in the global average temperature to below 2˚C above pre-industrial levels by reducing emissions to 40 gigatonnes or to 1.5˚C above pre-industrial levels by reducing to a level to be identified in the special report referred to in paragraph 21 below;

In a post last month I adapted a graphic produced by the UNFCCC in the run-up to Paris COP21 to show the gap between actual policy proposals and the Millar et al 2017 estimates to prevent 1.5˚C of warming being breached.

The aggregate impact of all policy ambitions if fully implemented fall a long way short of the targets. The majority is not due to the United States, or other Western Countries, failing to reduce emissions at a fast enough rate, but the developing countries increasing their emissions, rather than cutting emissions. When compared with  protests against President Trump’s policies (in a country with less than one-eighth of global emissions and a falling share of the total) there are no mass protests outside the embassies of Asian, Middle Eastern, African or South American countries, with over 80% if the global population and which collectively account for 100% of the growth in emissions between 1990 and 2012. Yet these countries have no expressed intention of reducing their emissions commensurate with the policy pathways. Criminal acts in the USA will do nothing to change this.

Leaving Fossil Fuels in the Ground

Arguments for targeting the output of Canadian tar sands include

(a) per unit of energy, it creates higher emissions than oil from say, Saudi Arabia.

(b) there are vast unproven reserves of oil in Canada that may exceed the current global proven reserves.

These aspects I will deal with in depth in a follow-up post. However, the two statements above are true. There are, however, wider policy aspects. Shutting down some of the global production of oil (and raising the price of oil) could increase the usage of coal instead. Push the price high enough and there will generate economic incentives to convert coal to liquids, a process that involves the generation of a number of times the CO2 emissions as from generating energy direct from oil alone.

The wider aspect is whether shutting down some proven reserves make available much less than the 1000 GtCO2e of emissions that would supposedly cause dangerous climate change. McGlade and Ekins 2015 (The geographical distribution of fossil fuels unused when limiting global warming to 2°C) estimate that the proven global reserves around 2900 GtCO2e. There is no clear breakdown by country, so I input their values of CO2 per unit into the BP’s estimates of global reserves of oil, gas and coal, coming up with a similar 2800 GtCO2e. These represent roughly 50 years of oil and gas supply and 120 years of coal supply at current usage rates. Taking into account other GHG emissions, to achieve the emissions target around 75% of proven reserves and 100% of any future discoveries must be left in the ground. I have produced a chart of the countries where these proven resources lie, measured in terms of CO2 produced from burning for energy.
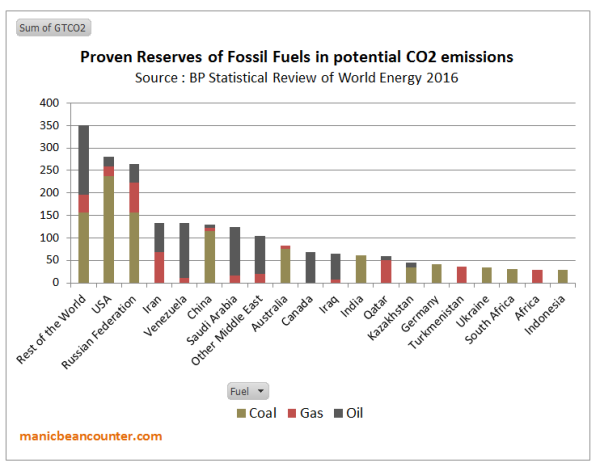
McGlade and Ekins further estimate there are unproven but likely reserves of oil, gas and coal represent a further 8000 GtCO2e of emissions. Shutting down the Tar Sands permanently will not stop production of fossil fuels elsewhere in the world, particularly in the Middle East, Russia and other Asian countries.

Conclusion

There are a number of reasons that on their own ought to fail the necessity defense criteria laid down by Clearwater County District Judge Robert Tiffany last month. 

First, the climate experts at the UNIPCC, and the policy-promotors at the UNFCCC do not believe there is an imminent emergency. They estimate the threshold to dangerous climate change will not be crossed for over a decade.

Second, the cause of dangerous climate change is meant to the rise in global greenhouse levels, caused by global human greenhouse gas emissions. Shutting down fossil fuel emissions will not stop the harms in that area.

Third, the harms inflicted on the victims of the action are local, whereas any benefits in reduced emissions are global. But there is no evidence of the activists realizing this by campaigning for policy changes in other countries on anything like the level in the USA. The activist’s actions single out a particular source and are thus discriminatory.

Fourth, although the various actions on the same day stopped a vast amount of oil being moved, it was tiny in relation to oil the fossil being produced. Further, oil is only a minority source of all global greenhouse gas emissions.

Fifth, there is a large recognized global policy gap between forecast emissions if current policy proposals are fully enacted and the desired emissions pathways commensurate with 1.5°C or 2°C of warming. To meet these global pathways all countries must participate, but the evidence is that countries with over 80% of the global population have no expressed intention to get anywhere close to these policy criteria. Further, meeting the policy criteria would mean that the vast majority of proven reserves of fossil fuels are left in the group, along with any unproven reserves. Given the geographical dispersion of the proven reserves, this is not going to happen.

The principal theme that undermines the climate necessity defense is that the marginal impact of the action of shutting down a pipeline (or even a number of pipelines) is infinitesimally small compared to the required solution. For this reason, the necessity defense is still not valid even if (contrary to all the research to date) it can be proved beyond reasonable doubt that catastrophic climate changes will happen without rapid reductions in global emissions.

Kevin Marshall


SNP Government’s Out-Sourced Propaganda on Food Waste

In the previous post I promised to provide some clear illustrations of the climate of this policy nonsense in Britain. The United Kingdom has a rather strange constitution, where three of the four countries have devolved assemblies, but largest with 83% of the population does not. The most vocal by far is the Scottish Assembly lead by Scottish Nationalist First Minister Nicola Sturgeon. The United Kingdom has the world’s most strident Climate legislation in the form of the Climate Change Act 2008. The Scottish Nationalists seek to differentiate themselves from the English by usurping the British role of leading the world on Climate Change. Scotland is therefore a useful place to look for the most extreme examples.

Zero Waste Scotland, a Stirling-based company Limited by Guarantee, almost entirely funded by the Scottish Government, exists to promote environmentalist propaganda. In their words .

Zero Waste Scotland exists to create a society where resources are valued and nothing is wasted. 

Take the page on Food Waste

Your food does its job best when it’s on a plate ready to be enjoyed. Saving food saves money and helps to slow down global warming and deforestation. Reducing the amount of food that ends up in the bin also means you can say goodbye to unnecessary packaging waste. If we all make a few small changes and start using up the food we buy, together we can make a big difference.

Look at the “we” part in relation to making a big difference to slowing global warming. It is a Scottish-based website, promoting Scottish Government policy. The context to consider this claim is

  1. Note all the Scottish people will take up the call from the website. Indeed, very few will likely visit the webpage, particularly those who are not already .
  2. Domestic food waste is less than the total food waste. There is waste in farming, food processing, restaurants, schools and retailing.
  3. Food Waste is a only a small part of total Scottish emissions. Zero Waste Scotland estimates 1.5 millions tonnes of 75 millions tonnes.
  4. Scottish emissions of 75 MtCO2E are a small part of global greenhouse emissions of 54000 MtCO2.

The slow-down if all readers of the website and reduce food waste to zero in slowing global warming (assuming the link between warming and GHG less) is much less than 0.0028% of the total.
Will people save money and reduce packaging waste by eliminating food waste? I believe that a cheap healthy diet for a family. I always tried to provide fruit and fresh vegetables for my growing children, as against cakes and ice-cream. With growing children, getting them to eat vegetables was a problem. Cabbage, leaks and mange tout were least successful. Corn on the cob was successful for a while. But we rarely had tinned of baked beans, which were popular. With fruit, some got left depending on the mood, and other foods eaten. Peels and cores added to the waste, along with the unsightly bits of cheaper potatoes and residue of roast chicken, leg of lamb and pork shoulder. (We are not keen on the fat, nor soup made from the stock). We could have saved waste by spending more on quality, or reduced waste by careful planning. For hard-working families there are other considerations. On a weekly shop it is a case of chucking some things in the trolley that will provide quick meals. Detailed planning of meals and careful preparation is sacrificed for family time, relaxation and sleeping. In terms of focusing on food waste could cause other harms, like failing to provide a varied diet to children and maybe spending more. The loss of leisure and family time are potential non-monetary costs.

Zero Waste Scotland gets a 10% reduction from the 5.5 million people in Scotland, that is just 0.00028%, But the people reading are individuals, and maybe decision-makers for the families. A family going from average to zero food waste might reduce global emissions by 0.000000001%.

Imagine is a business making such a grossly misleading claims in the benefits, and hiding of potential harmful side-effects in promoting say, vitamins. They would be prosecuted. But this is not a business selling a product but environmentalist propaganda.

However, there are benefits to the Scottish Government.

First, by having fancy websites, along with signage all over the place, they can claim they are combating climate change. This enables First Minister Sturgeon being able to dream of being making serious speeches to the UN and being photographed next to other world leaders.

Further, this messaging changes peoples perceptions, meaning that anybody who perceives the absurdity is met by incomprehension and a string of half-learnt mantras. Without imposing censorship, in the name of “saving the planet” this promotes a progressive consensus that cannot be challenged.

Third, there are British Government and EU targets to reduce food waste and other environmental concerns. When persuasion does not work, there is greater justification in providing incentives to promote “better” behaviour, as with banning smoking in public places, minimum price for alcohol and a awkward charging for plastic bags. Alternatively by taking some of the decision-making powers about what people eat and how they live their lives out of their hands and placing under the guidance of those who know better. They Scottish Government already tried this with the named person child protection scheme.

Fourth, by out-sourcing (or privatizing) political propaganda, the SNP can avoid the claim of using the Scottish Government website for promoting a political hegemony.

Kevin Marshall


Guardian Images of Global Warming Part 2 – A Starved Dead Polar Bear

In the Part 2 of my look at Ashley Cooper’s photographs of global warming published in The Guardian on June 3rd I concentrate on the single image of a dead, emaciated, polar bear.
The caption reads

A male polar bear that starved to death as a consequence of climate change. Polar bears need sea ice to hunt their main prey, seals. Western fjords of Svalbard which normally freeze in winter, remained ice free all season during the winter of 2012/13, one of the worst on record for sea ice around the island archipelago. This bear headed hundreds of miles north, looking for suitable sea ice to hunt on before it finally collapsed and died.

The US National Snow and Ice Data Center (NSIDC) has monthly maps of sea ice extent. The Western Fjords were indeed ice free during the winter of 2012/13, even in March 2013 when the sea ice reaches a maximum. In March 2012 Western Fjords were also ice free, along with most of the North Coast was as well.  The maps are also available for March of 2011, 2010, 2009 and 2008. It is the earliest available year that seems to have the minimum extent. Screen shots of Svarlbard are shown below.

As the sea ice extent has been diminishing for years, maybe this had impacted on the polar bear population? This is not the case. A survey published late last year, showed that polar bear numbers has increased by 42% between 2004 and 2015 for Svarlbard and neighbouring archipelagos of Franz Josef Land and Novaya Zemlya.

Even more relevantly, studies have shown that the biggest threat to polar bear is not low sea ice levels but unusually thick spring sea ice. This affects the seal population, the main polar bear food source, at the time of year when the polar bears are rebuilding fat after the long winter.
Even if diminishing sea ice is a major cause of some starvation then it may have been a greater cause in the past. There was no satellite data prior to the late 1970s when the sea ice levels started diminishing. The best proxies are the average temperatures. Last year I looked at the two major temperature data sets for Svarlbard, both located on the West Coast where the dead polar bear was found. It would appear that there was a more dramatic rise in temperatures in Svarlbard in the period 1910-1925 than in period since the late 1970s. But in the earlier warming period polar bear numbers were likely decreasing, continuing into later cooling period. Recovery in numbers corresponds to the warming period. These changes have nothing to do with average temperatures or sea ice levels. It is because until recent decades polar bears were being hunted, a practice that has largely stopped.

The starvation of this pictured polar bear may have a more mundane cause. Polar bears are at the top of the food chain, relying on killing fast-moving seals for food. As a polar bear gets older it slows down, due to arthritis and muscles not working as well. As speed and agility are key factors in catching food, along with a bit of luck, starvation might be the most common cause of death in polar bears.

Kevin Marshall

Guardian Images of Global Warming Part 1 – Australian Droughts

On Friday June 3rd the Guardian presented some high quality images with the headline

Droughts, floods, forest fires and melting poles – climate change is impacting Earth like never before. From the Australia to Greenland, Ashley Cooper’s work spans 13 years and over 30 countries. This selection, taken from his new book, shows a changing landscape, scarred by pollution and natural disasters – but there is hope too, with the steady rise of renewable energy.

The purpose is to convince people that human-caused climate change is happening now, to bolster support for climate mitigation policies. But the real stories of what the pictures show is quite different.  I will start with three images relating to drought in Australia.

Image 5

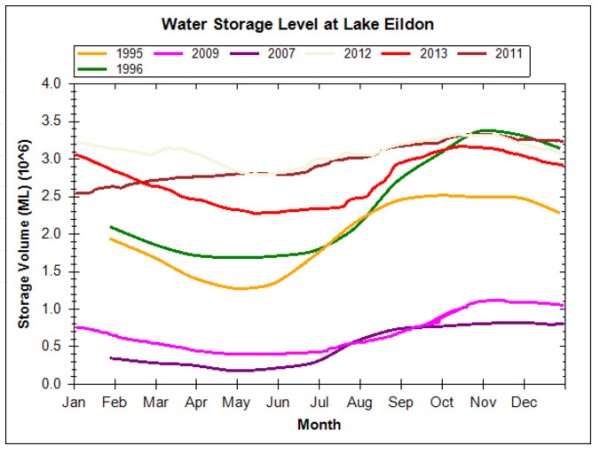
Forest ghosts: Lake Eildon in Victoria, Australia was built in the 1950’s to provide irrigation water, but the last time it was full was in 1995. The day the shot was taken it was at 29% capacity with levels down around 75ft.

Data from Lake Eildon (which is accessible with a simple search of Lake Eildon capacity) links to a graph where up to 7 years of data can be compared.

In 1995 the dam was not at full capacity, but it was full, for a short period, in the following year. However, more recently after the recent drought broke, in 2011 the reservoir was pretty much full for all the year.

But were the low levels due to more extreme drought brought on by climate change? That is very difficult to determine, as Lake Eildon is an artificial lake, constructed to provide water for irrigation occasional hydro-electric power as well as recreational facilities. The near empty levels at the end of the biggest drought in many decades could be just due a failure to predict the duration of the drought, or simply a policy of supplying irrigation water for the maximum length of time. The fact that water levels never reached full capacity for many years is indicated by a 2003 article in The Age

The dam wall at Lake Eildon, Victoria’s biggest state-run water storage, has been declared unsafe and will need a $30 million upgrade if the lake is to be refilled.

The dam, which is at its lowest level since being completed in 1956, will be restricted to just 65 per cent capacity because it no longer meets safety standards for earthquakes and extreme floods.

Image 6

Forest destroyed by bush fires near Michelago, New South Wales, Australia.

The inference is that this is caused by global warming.

According to Munich Re

The majority of bushfires in southeast Australia are caused by human activity

Bushfire is the only natural hazard in which humans have a direct influence on the hazard situation. The majority of bushfires near populated areas are the consequence of human activity. Lightning causes the smaller portion naturally. Sometimes, a carelessly discarded cigarette or a glass shard, which can focus the sun’s rays is all it takes to start a fire. Heat from motors or engines, or electric sparks from power lines and machines can ignite dry grass. Besides this accidental causes, a significant share of wildfires are started deliberately.

Humans also change the natural fire frequency and intensity. They decrease the natural fire frequency due to deliberate fire suppression near populated areas. If there is no fuel-reduction burning in forests for the purposes of fire prevention, large quantities of combustible material can accumulate at ground level.

Surface fires in these areas can become so intense due to the large amounts of fuel that they spread to the crowns of the trees and rapidly grow into a major fire. If humans had not intervened in the natural bushfire regime, more frequent low-intensity fires would have consumed the forest undergrowth and ensured that woodland grasses and scrubs do not proliferate excessively.

David Evans expands on the issue of fuel load in a 2013 article.

Like with the water levels in an artificial lake, forest fires are strongly influenced by the management of those forests. Extinguishing forest fires before they have run their natural course results in bigger and more intense fires at a later date. More frequent or intense droughts would not change this primary cause of many horrific forest fire disasters seen in recent years.

Image 7

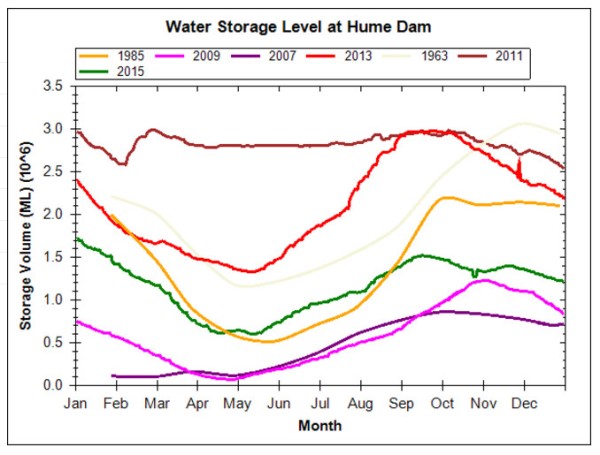
Where has all the water gone?: Lake Hume is the largest reservoir in Australia and was set up to provide irrigation water for farms further down the Murray Basin and drinking water for Adelaide. On the day this photograph was taken it was at 19.6% capacity. By the end of the summer of 2009 it dropped to 2.1 % capacity. Such impacts of the drought are likely to worsen as a result of climate change. The last time the water was anywhere near this road bridge was 10 years ago, rendering this no fishing sign, somewhat redundant.

Again this is old data. Like for Lake Eildon, it is easy to construct graphs.

Following the end of the drought, the reservoir came back to full capacity. Worsening drought is only apparent to those who look over a short time range.

When looking at drought in Australia, Dorothea Mackellar’s 1908 poem “My Country” provides some context. Written for a British audience, the poem begins

I love a sunburnt country,

A land of sweeping plains,

Of ragged mountain ranges,

Of droughts and flooding rains

To understand the difference that human-caused climate change is having on the climate first requires an understanding of natural climatic variation over multiple time-scales. It then requires an understanding of how other human factors are influencing the environment, both intended and unintended.

Kevin Marshall

Assessing the UNIPCC fifth assessment report

The first part of the UNIPCC AR5 is due to be published in the coming days. At the Conversation, Research Fellows Roger Jones and Celeste Young at Victoria University have posted Explainer: how to read an IPCC report. It contains some useful stuff on penetrating the coded language of the IPCC report. You will be better able to decode what the IPCC mean by various levels of confidence. However, the authors are very careful not to give people a free rein in thinking for themselves. Therefore they stress that the language is complex, and any questions need to be answered by an expert. After all, it would not do to have people misinterpreting the science.

I suggest an alternative method of understanding the science. That is comparing what is said now with what the consensus said back in 2007 in AR4. The AR4 is available at the United Nations Intergovernmental Panel on Climate Change website at the following location.

http://www.ipcc.ch/publications_and_data/publications_ipcc_fourth_assessment_report_synthesis_report.htm

Figure 2.4 Radiative forcing components of SYR.

It would be nice to see the comparative estimates, particularly on whether aerosols have a comparatively large negative role and whether natural factors are still less than 10% of the net total.

.

Figure 2.4. Global average radiative forcing (RF) in 2005 (best estimates and 5 to 95% uncertainty ranges) with respect to 1750 for CO2, CH4, N2O and other important agents and mechanisms, together with the typical geographical extent (spatial scale) of the forcing and the assessed level of scientific understanding (LOSU). Aerosols from explosive volcanic eruptions contribute an additional episodic cooling term for a few years following an eruption. The range for linear contrails does not include other possible effects of aviation on cloudiness. {WGI Figure SPM.2}

Figure SPM.6. Projected surface temperature changes for the late 21st century (2090-2099).

An updated map on a comparable basis would be useful, especially for the most concerning area of the Arctic.


Figure SPM.6. Projected surface temperature changes for the late 21st century (2090-2099). The map shows the multi-AOGCM average projection for the A1B SRES scenario. Temperatures are relative to the period 1980-1999. {Figure 3.2}

Table SPM.2. Examples of some projected regional impacts.


It would be nice to have an update on how the short term impacts are doing. These all had high confidence or very high confidence

In Africa

By 2020, between 75 and 250 million of people are projected to be exposed to increased water stress due to climate change.

By 2020, in some countries, yields from rain-fed agriculture could be reduced by up to 50%. Agricultural production, including access to food, in many African countries is projected to be severely compromised. This would further adversely affect food security and exacerbate malnutrition.

In Australia and New Zealand

By 2020, significant loss of biodiversity is projected to occur in some ecologically rich sites, including the Great Barrier Reef and Queensland Wet Tropics.

Small Islands

Sea level rise is expected to exacerbate inundation, storm surge, erosion and other coastal hazards, thus threatening vital infrastructure, settlements and facilities that support the livelihood of island communities.

Please note the graphs used are available at this website and are IPCC Copyright.


Watermelon Energy Policy – Green Renewables backed by Red Diesel

My last past was on the Fulcrum Power application to build a 20MW diesel power station. I predict that this will be part of the next big scandal to hit so-called renewables sector.

Fulcrum Power are planning to become part of the National Grid’s STOR (Short Term Operating Reserve) scheme. The STOR End of Year Report 2011/12 summary is

In 2011/12 National Grid procured on average 3230 megawatts (MW) for the six seasons, at a cost of £70.4m in availability payments. This was made up on average of 2160 MW for the Committed service and 1071 MW for the Flexible service. The actual MW availability provided through STOR during the peak demand of each day between 1st April 2011 and 31st March 2012, averaged out at 2172 MW. This represents an increase of 6.2% over the average MW availability for peak of each day during the 2010/11 term.

There were 421 successful STOR tenders in 2011/12, of which 191 units were Committed service providers and 230 units were Flexible service providers.

The average availability price for both Committed and Flexible STOR was £9.13/MW/h and the average utilisation price was £232.37/MWh. This represents an increase of 0.6% on 2010/11 average availability prices and a decrease of 7.7% on 2010/11 average utilisation prices.

National Grid utilised a total of 173.3 gigawatt hours (GWh) of STOR, yielding utilisation payments of £32.3m; and thus marks increases of 73% and 66%, respectively, when compared with the total STOR utilisation for 2010/11 and its cost.

The total expenditure for STOR during the 2011/12 term was £102.7m.

This 20MW scheme would add less than 1% to the total STOR capacity, which is currently costing just over £100m per year. Neither is this the

The STOR scheme is used at the moment in case of the emergency shut-down of a major power station. In the future I predict it is likely to be to cover two sources.

  • With increasing reliance on wind turbines, for in the sub-zero winter temperatures, caused by windless high pressure systems.
  • With the shutting down of the older generations of coal and nuclear capacity without new base-load power coming along, to provide peak time capacity on windless days.

The BBC report on the Fulcrum Power planning application stated

Two diesel power stations planned in Plymouth will compensate for fluctuations in supplies from green energy, say developers.

Green Frog Power got planning permission last year and Fulcrum Power has made an application for a similar power station.

Green Frog Power recently received financing of £75m to build 200MW of standby power. They must have these mini stations all over the place. They are not alone. The “STOR Market Information for TR19” report notes that in Year 7 showed that whilst the accepted STOR was around 3000MW, the rejected applications were about 6300MW. There is a huge amount of generating capacity out there of 3MW or more. However, much of this will be old diesel engines, with efficiencies far less than the coal-fired or nuclear power stations than are being shut down. The cost per kwh would also be about two or three times those of the coal-fired power stations, if used as base-load. But used as peak demand carrying load on windless days, they could be five to ten times the cost. The gas-fired power stations currently used for peak times could be switched to base load. All the extra diesel being used could hit car drivers in the wallets as well in the winter.

So the good point here is that the lights are unlikely to go out. We have plenty of temporary capacity. The bad news is that the dithering over shale gas and the banning of new coal-fired power stations could push energy costs through the roof and might even increase CO2 emissions.

James Delingpole likes to call the green movement “watermelons“. That is, they are politically green on the outside, but socialist red on the inside. In Britain, diesel not used for transport does not carry excise duties. It carries a red dye, to easily identify its illicit use in road vehicles. British energy policy is likely to become a watermelon policy – green renewables on the surface, but red diesel at the safety core.

Green Frog Power

STOR scheme description

STOR scheme documents

STOR End of Year Report 2011/12

STOR Market Information for TR19

BBC on the Fulcrum Power planning application


Tung and Zhou claim of constant decadal anthropogenic warming rates in last 100 years

Bishop Hill reports on

A new paper in PNAS entitled ‘Using data to attribute episodes of warming and cooling in instrumental records’ looks important. Ka-Kit Tung and Jiansong Zhou of the University of Washington report that anthropogenic global warming has been overcooked. A lot.

My comment was:-

My prediction is that this paper will turn out to have exaggerated the anthropogenic influence, rather than have under-estimated it.

The relevant quote:-

The underlying net anthropogenic warming rate in the industrial era is found to have been steady since 1910 at 0.07–0.08 °C/decade

Greenhouse gas emissions have not been increasing at a steady rate. The most important is CO2. A couple of years ago I tried to estimate from country data (filling in important gaps) how global CO2 emissions had increased. The increases per quarter century were

1900-1925 85%

1925-1950 60%

1950-1975 185%

1975-2000 45%

That meant global CO2 emissions increased more than 12 times (1100%) in 100 years. The conversion rate to retained CO2 seems to be roughly constant – 4Gt of carbon equivalent to increase CO2 levels by 1ppm. Furthermore, the C20th warming was nearly all in two phases. 1910-1945 and 1975-1998. Rather than temperature rise being related to CO2 emissions, it seems out of step. That would imply a combination of two things for the anthropogenic warming rate to be constant at 0.07–0.08 °C/decade. First is that CO2 has massively diminishing returns. Second is that CO2 emissions alone have a much smaller impact on the global average temperature changes (as reported in HADCRUT4), than this paper concludes.

Supplementary Information

This source of the emissions data is

Boden, T.A., G. Marland, and R.J. Andres. 2010. Global, Regional, and National Fossil-Fuel CO2 Emissions. Carbon Dioxide Information Analysis Center, Oak Ridge National Laboratory, U.S. Department of Energy, Oak Ridge, Tenn., U.S.A. doi 10.3334/CDIAC/00001_V2010

The CO2 levels are for Mauna Loa back to 1959, and estimated backwards from there to 1780.


The above chart shows by estimated CO2 emissions (expressed in units of 10Gt of carbon equivalents) shown as against the HADCRUT3 data set. This shows a slow rate of increase in CO2 emissions in the first half of the twentieth century, with falls in emissions during the Great Depression (1929-1933) and at the end of the Second World War (1945). From 1950 to 1973 there was a huge upsurge in emissions with the post-war economic boom, then stalls in 1973 (The OPEC oil embargo) and 1980-83 (global recession). After 2000 there was another surge in emissions, mostly due to rapid growth in China.

The temperature increases followed a different pattern. There were two periods of increasing temperatures in the twentieth century – From 1910-1945 and 1975-1998. The decadal changes graph below shows clearly the change in emissions. The temperature changes by decade exaggerate the falls in temperature in the Edwardian decade and the 1940s.


What is clearly illustrated is why I believe the anthropogenic influence on temperature was not similar in every decade from 1910, as Ka-Kit Tung and Jiansong Zhou claim.

Electric Cars – toys of the rich, subsidised by the masses

Joanna Nova reports on a new study showing that electric cars produce more CO2 that either petrol or diesel cars if that electricity is produced principally from coal-fired power stations.

The most practical electric car

In Britain there is more a market for electric vehicles, but still puny sales. The European Car of the Year is the Chevrolet Volt, which has a 1.4 petrol engine to accompany the electric motor. At £29,995 it costs 50% more than a similarly-sized Ford Focus diesel, even with the £5,000 government subsidy. In fact, it is more than a similarly-sized Audi, BMW or Mercedes and will not last nearly as long. If you look at the detail, the Volt has a claimed CO2 emission 27 g/km, as against 99 g/km for the best diesels. This takes no account of the CO2 emissions from the power stations. In Britain electricity is mostly from gas, with much of the rest from coal and nuclear.

There is also a question of equity. Domestic electricity has a 5% tax added on. Diesel has over 120% added. So the cost for 100 km (using official figures and 15p per kwh + 5% vat) is £2.66 for the Volt and £6.00 for the equivalent diesel car (combined 67.3mpg and £1.43 per litre). But tax is £0.13 and £3.30, so most of the cost saving is in tax. In the UK the average is 12,000 miles or 19,300km per year. So the tax saving from driving the Volt is up to £610 per annum. Although if you travel that distance per annum there will be a number of long distance journeys. Let us assume half the 12,000 miles is on the petrol engine at 50mpg, with petrol at £1.38. Then the annual tax saving drops to just £70.

The biggest saving for electric car owners is in London, with the congestion charge. Drive 5 days a week for 11 months of the year into London, and the conventional car owner will pay £2,750 a year. Drive an electric car or hybrid and the charge is zero.

So what sort of people would be persuaded to buy such a device? It is the small minority who have money for at least two cars, but want to appear concerned about the environment. They have the open-top sports car for summer days, the luxury car for long journeys, and the Volt for trips to the supermarket or to friend’s houses. It is the new form of conspicuous consumption for the intelligentsia, making the Toyota Prius so last year.

The least practical electric car

Launched this year the Renault Twizy is claimed to be about the cheapest “car” available today. As a car it is also by far the smallest available as well, being more a quadricycle, with no proper doors. The cost is kept low by not including the battery which is rented for at least £48 a month. As the Telegraph concludes, it is an expensive toy. My 12 year old son said he would love one when he saw it in a car showroom recently. But he would soon regret it if he was transported to school in it every day, instead of riding on the top-deck of a bus. At least if his dad forgot to plug it in, it would be small enough for him to push.

Is recycling rotting food hygenic?

My local council now says that I can put waste food in the green recycle bin. Oh lovely! Imagine the green bin after having the remains of a chicken carcass and all the juices after putrifying in the hot summer. Especially with some solidified milk on top. Remember the swill bin at school. Now imagine if were only emptied once a fortnight and you get the idea.

My own view is to continue with what I currently do. Double-bag the solid food and swill the liquid or jellified material down the sink with a good dose of detergent.

I will change if some will volunteer to clean out the green bin occasionally. It needs doing as the grass cuttings in the bottom are well composted. But the flies and stench from the rotting fruit put me off at present.

MCC Waste Food

Ann Widdecombe on Climate Change

Total Politics Magazine has interviewed Ann Widdecombe. Of note was the views expressed on climate change.


It so happens that I know that an awful lot of people in our party – and by that I mean a lot – are deeply unhappy with the way that we’ve signed up apparently quite blindly to the climate change agenda. It isn’t that they don’t want sensible things like recycling, it isn’t a silly rebellion. But there is a deep unease that we’re rushing in virtually to a theology: those who asked questions are ‘deniers’. The language is theological. We’re rushing in to what has become a theology imposed by the equivalent of what has become the mediaeval church and that nobody’s allowed to question it. And that even by questioning it, you’re doing the world a massive disservice and bringing it under perdition.


For those conservatives who share that unease, here are some basic points that may help get the issue in perspective.


  1. The rise in  temperatures over the past century of 0.70C is nothing unusual in the climate since the last ice-age. For much of the Roman Period 250 BC to 450 AD and the Medieval Period (900 to 1300) there is considerable evidence that temperatures were warmer than today. The view that recent temperatures are the highest in many thousands of years (held by the UN IPCC and Al Gore) is based on a single, now-discredited paper. (Shorter, but older, statement here) If there is nothing unusual historically in the recent rise in temperatures, then it is unlikely mostly or entirely by anthropogenic factors. If this is the case, then reducing carbon emissions is a waste of time.
  2. The UN IPCC forecasts that the warming will accelerate is based on positive feedback. That is the small rise in temperatures already experienced (0.70C) will cause a much larger rise in temperatures in the future (predicted to be 2 to 4.50C this century). This view is not supported by actual evidence. See here. If there is no sign runaway warming, then there is no need to panic about drastic action now. Rather we should revise our long-term forecasts downwards.
  3. There is a certain bias in

i)                    The collection of temperature data, meaning recent warming has been overstated (most recent discussion see here)

ii)                   Reporting the news when it supports the consensus, but not when it does not (e.g. Antarctic warming, hurricanes and Himalayan glacier melt.)

iii)                 Political spin in the presentation of the data. For instance ehe IPCC’s 4th assessment report of 2007, instead of saying that warming had paused (or ceased) this century said “Eleven of the last twelve years (1995-2006) rank among the twelve warmest years in the instrumental record of global surface temperature (since 1850).” (page 30 Col 1)


 In other words, far from “the science being settled” there are huge questions that must be answered. Before a new drug is launched we ask that tests should be independently verified. If a doctor gives us a diagnosis that we do not think is right we get a second opinion. If someone calls at the door saying “Your roof is about to cave in, but I can replace it for you bargain price of £20,000 if you let me start tomorrow” we would normally see through it and get an alternative opinion from an independent surveyor.


Ann Widdecombe may be overstating her case, but we need the alternative voices to be heard, so that between the extremes of Global Warming Alarmists and Climate Change Deniers, we get an honest assessment and realistic policy.