Forest Trump – stupid is as stupid does

Last Tuesdays’ BBC climate propaganda piece for the day was ‘Donald Trump forest’ climate change project gains momentum,

A campaign to plant trees to compensate for the impact of President Trump’s climate policies has 120,000 pledges.
The project was started by campaigners upset at what they call the president’s “ignorance” on climate science.
Trump Forest allows people either to plant locally or pay for trees in a number of poorer countries.
Mr Trump says staying in the climate pact will damage the US economy, cost jobs and give a competitive advantage to countries such as India and China.
The organisers say they need to plant an area the size of Kentucky to offset the Trump effect.

Trump Forest website (motto Where ignorance grows trees) explains

Breathe easy, Mr President.

 US President Donald Trump doesn’t believe in the science of human-caused climate change. He wants to ignore one of the greatest threats to healthy life on Earth.

Trump wants to bring back coal despite scientists telling us we cannot afford to burn it, and despite economists telling us there’s more money to be made and more jobs available in renewable energy.

So we’re planting a forest to soak up the extra greenhouse gases Trump plans to put into our atmosphere.

We’re planting a global forest to offset Trump’s monumental stupidity.

The claim Trump wants to “bring back coal” or, just to rescind the policies to phase it out, is a question of that can be answered by the empirical evidence. The BP statistical review of World Energy 2016 has estimates of coal consumption by country, measured in millions of barrels of oil equivalent. For the USA I have created a graph.

US coal consumption in 2015 was 31% below the level of 2015, but it is far from being phased out. Further, much of the fall in consumption is primarily down to government policy, but from switching to cleaner and cheaper shale gas. Add the two together in terms of millions of tonnes of oil equivalent, and consumption of the two fossil fuels has hardly changed in 20 years.

Natural Gas is not only cleaner, in terms of far fewer particulates emitted when burnt, it has the added benefit, for climate alarmists, of having around half the CO2 emissions. As a result, net emissions have been falling.

However, global warming is allegedly the result of rising levels of greenhouse gases, which in turn are mostly the result of increasing fossil fuel emissions. How does the falling consumption of coal in the USA compare to the global picture? Again the BP estimates give a fairly clear answer.

In 1965 the USA accounted for 20.8% of global coal consumption, and other rich OECD countries 42.3%. Fifty years later the shares had fallen to 10.3% and 15.2%. Yet the combined OECD consumption had increased by 11%. The lesson from this is that to reduce global GHG emissions requires that developing countries reduce their emissions. China,, which now accounts for just over 50% of global coal consumption, has committed to peak its emissions by 2030. India, whose coal consumption exceeded that is the USA for the first time in 2015, has no such commitment. With a similar population to China, fast economic growth will lead to fairly high rates of increase in coal consumption over the next few years. Into the distant future, the ROW, with around half the global population, are likely to see significant increases in coal consumption.

The switch from coal to shale gas is a major reason why total USA emissions have been falling, as evidenced in this graph from the USA INDC Submission.

The 2025 target is a bit a cheat. Most of the reduction would have been achieved without any policy. In fact, about one third had been achieved by 2013.

Trump Forest have a science page to explain the thinking behind the scheme. It states

If executed in its entirety the Clean Power Plan would prevent approximately 650 million tons of carbon dioxide from reaching the atmosphere over the next 8 years. Along with other actions, including tailpipe regulations (which Trump has also moved to eliminate), the United States was steering toward meeting its target for the Paris Agreement.

Also

The Paris Agreement, negotiated in the French capital in December 2015 was agreed to by over 190 nations. It is the first time the global community has agreed to address climate change by striving to keep the average global temperature increase below 2°C.

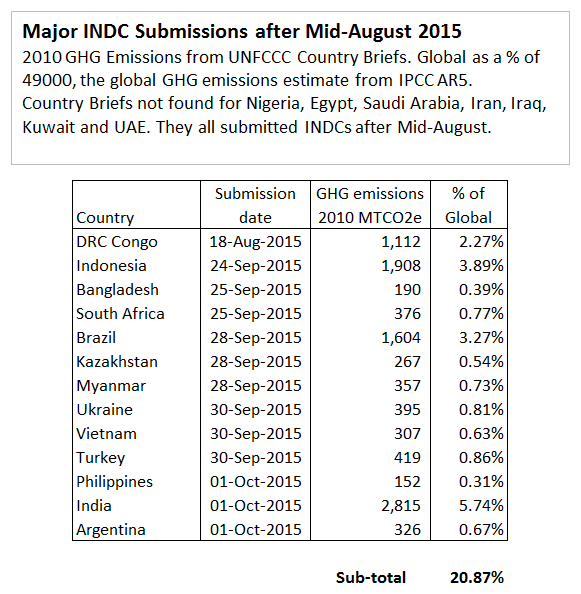
So how does the 650mtCO2e over 8 years measure up against those of the global community in the context of “striving to keep the average global temperature increase below 2°C”?

The UNFCCC produced a useful graphic, summarizing all the INDC submissions.


Without the 650mtCO2e claimed reduction from the US Clean Air Plan if fully implemented, global emissions will be just over 1% higher. Rather than global emissions being about 12.5% above the 2°C warming path they might be 14%.  In other words, even if a doubling of CO2 (or equivalent) will lead to 3°C and such warming will have catastrophic consequences (despite the lack of strong, let alone incontrovertible, evidence) the US Clean Air Plan would back no noticeable difference to climate change. using the figures presented by the UNFCCC.

It gets worse. Under the science, Trump Forest have the following graphic, lifted from Climate Interactive.

I have looked at Climate Interactive’s figure before. At least from their figures in December 2015, they claimed that future per capita emissions in the USA would rise without policy, whilst since the 1973 oil crisis per capita emissions had been falling. It was the same with the EU, only their per capita emissions had been falling since 1980. For China and Russia per capita emissions are shown rise through the rough. It is as though without them the guiding hand of the green apostles, Governments will deliberately wastefully burn ever-increasing amounts of fossil fuels. rather than promote the welfare of their nations. This is a graphic I produced from the Climate Interactives C-ROADS software version v4.026v.071 RCP8.5 baseline scenario and the built-in population forecasts.

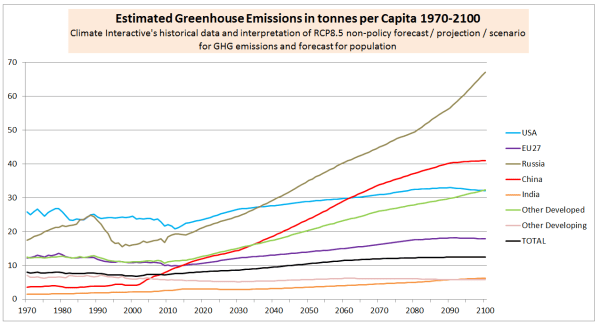
China is the most globally significant. Despite a forecast decline in population to 1.00 billion in 2100, GHG emissions are forecast to peak at nearly 43GtCO2e by in 2090. That compares with 49GtCO2e from over 7 billion people in 2010. Conversely, non-policy developing countries (who do not want to game-playing ny committing to emissions reductions), are forecast to do disasterously economically and hence have very low emissions growth. That includes India, 50+ African nations, Pakistan, Bangladesh, Philippines, Vietnam, Indonesia, Saudi Arabia, Iran, Iraq etc.

The mere act of countries signing a bit of paper produces most of the drop in emissions. The 650mtCO2e claimed reduction from the US Clean Air Plan if the marginal impact of the policy is taken into account, rather than the difference between an unreasonable forecast and an objective.

It gets worse. The elimination of cheap sources of energy, along with the plethora of regulations, make energy more expensive. Apart from directly harming the living standards of households, this will increase energy costs to business, especially the high energy using industries such as steel, aluminum, and bulk chemicals. US industries will be placed at a competitive disadvantage to their competitors in non-policy emerging economies. Some of the US savings from the policy will be from emissions increases elsewhere. There are no built-in safeguards to stop this happening.

It gets worse. Emerging economies not only have lower labour productivity per unit of output, they also have less efficient use of energy per unit of output. Further, countries like China and India have a larger element of coal in the energy mix than the USA. For these reasons an unintended consequence of reducing emissions in the USA (and other developed countries) through shifting production overseas could be a net increase global emissions. Virtue signaling achieves the opposite of intentions.

However, the real world must not be allowed to confront the anointed in their evangelical zeal to save the world from Donald Trump. They might have to accept that their Virtue signaling are both wrong and if fully implemented will cause great net harm. That would seriously hurt their feelings. Like in the 1994 film Forrest Gump, the lesson is that the really stupid people are not those with naturally low IQs, but those with intelligence who do stupid things. This is what Forest Trump’s backers have achieved.

Like in the 1994 film Forrest Gump, the lesson is that the really stupid people are not those with naturally low IQs, but those with intelligence who do stupid things. This is what Forest Trump’s backers have achieved.

Kevin Marshall


Met Office Extreme Wet Winter Projections

I saw an article in the Telegraph

Met Office warns Britain is heading for ‘unprecedented’ winter rainfall, with records broken by up to 30pc 

Britain is heading for “unprecedented” winter rainfall after the Met Office’s new super computer predicted records will be broken by up to 30 per cent.

Widespread flooding has hit the UK in the past few years leading meteorologists to search for new ways to “quantify the risk of extreme rainfall within the current climate”.

In other words, the Telegraph reporting that the Met Office is projecting that if the current record is, say, 100mm, new records of 130mm could be set.

BBC is reporting something slightly different

High risk of ‘unprecedented’ winter downpours – Met Office

There is an increased risk of “unprecedented” winter downpours such as those that caused extensive flooding in 2014, the UK Met Office says.

Their study suggests there’s now a one in three chance of monthly rainfall records being broken in England and Wales in winter.

The estimate reflects natural variability plus changes in the UK climate as a result of global warming.

The BBC has a nice graphic, of the most extreme winter month of recent years for rainfall.

The BBC goes onto say

Their analysis also showed a high risk of record-breaking rainfall in England and Wales in the coming decade.

“We found many unprecedented events in the model data and this comes out as a 7% risk of a monthly record extreme in a given winter in the next few years, that’s just over Southeast England,” Dr Vikki Thompson, the study’s lead author told BBC News.

“Looking at all the regions of England and Wales we found a 34% chance of an extreme event happening in at least one of those regions each year.”

Not only is there a greater risk, but the researchers were also able to estimate that these events could break existing records by up to 30%.

“That is an enormous number, to have a monthly value that’s 30% larger, it’s a bit like what we had in 2014, and as much again,” said Prof Adam Scaife from the Met Office.

The 30% larger is an outlier.

But over what period is the record?

The Met Office website has an extended version of what the BBC reports. But strangely no figures. There is a little video by Dr Vikki Thomson to explain.

She does say only recent data is used, but no definition of what constitutes recent. A clue lies not in the text, but an explanatory graphic.

It is from 35 years of winters, which ties into the BBC’s graphic from 1981. There are nine regions in England and Wales by the Met Office definition. The tenth political region of London is included in the South East. There could be different regions for the modeling. As Ben Pile and Paul Homewood pointed out in the comments to the Cliscep article, elsewhere the Met Office splits England and Wales into six regions. What is amazing is that the Met Office article does not clarify the number of regions, still less show the current records in the thirty-five years of data. There is therefore no possibility of ever verifying the models.

Put this into context. Northern Ireland and Scotland are excluded, which seems a bit arbitrary. If rainfall was random, then the chance of this coming winter setting a new record in a region is nearly 3%. For any one of nine regions, if data rainfall data independent between regions (which it is not) it is nearly a 26% chance. 34% is higher. But consider the many alternatives ways for the climate patterns to become more extreme and variable. After all, with global warming there climate could be thrown into chaos, so more extreme weather should be emerging as a foretaste of much worse to come. Given the many different aspects of weather, there could be hundreds of possible ways climate could get worse. With rainfall, it could be wetter or drier, in either summer or winter. That is four variables, of which the Met Office choose just one. Or could be in any 1, 2, 3… or 12 month period. Then again, climate change could mean more frequent and violent storms, such as that of 1987. Or it could mean more heatwaves. Statistically, heatwaves records could be a number of different ways, such as, say, 5 consecutive days in a month where the peak daily temperature is more than 5C about the long-term monthly average peak temperature.
So why choose rainfall in winter? Maybe it is because in recent years there have been a number of unusually wet winters. It looks like the Met Office, for all the power of their mighty computers, have fallen for a common fallacy.


Texas sharpshooter fallacy is an informal fallacy which is committed when differences in data are ignored, but similarities are stressed. From this reasoning, a false conclusion is inferred. This fallacy is the philosophical/rhetorical application of the multiple comparisons problem (in statistics) and apophenia (in cognitive psychology). It is related to the clustering illusion, which refers to the tendency in human cognition to interpret patterns where none actually exist.
The name comes from a joke about a Texan who fires some gunshots at the side of a barn, then paints a target centered on the tightest cluster of hits and claims to be a sharpshooter.

A run of extremely wet winters might be due to random clustering, or it could genuine patterns from natural variation, or it could be a sign of human-caused climate change. An indication of random clustering would be to look at many other the different aspects of weather, to see if there is a recent trend of emerging climate chaos. Living in Britain, I suspect that the recent wet weather is just drawing the target around the tightest clusters. Even then, high winter rainfall in Britain high rainfall this is usually accompanied by slightly milder temperatures than average. Extreme winter cold is usually on cloud-free days. So, if winter rainfall is genuinely getting worse it seems that the whole global warming thing for Britain is predicted to become a bit a damp squib.

Kevin Marshall


John McDonnell accusation that Grenfell fire victims were murdered examined

At Glastonbury (which people think to be a music festival) John McDonnell MP, the shadow chancellor, and closet Marxist made the accusation that the victims of the Grenfell fire were murdered. Guido Fawkes has a video recording here. He repeated these allegations in videoed interview with the NME, a publication when I was at school stood for New Musical Express. He tried to justify the comments when asked about the comments by Andrew Marr. All three are reproduced in an appendix.

From McDonnell’s perspective, any causes of the fire that can be determined by an inquiry conducted experts in their fields objectively assessing the evidence, are superficial. But before the evidence has been evaluated, the ultimate causes are the wrong decisions of political opponents, particularly the Tories, but also within the former mainstream of the Labour Party. McDonnell and his fellow travelers know the true interests of the people and can point to instances in the past where they have stated these ultimate causes, and have not been listened to. The fact that these anointed people have not been listened to is not only a failure of democracy, but the resulting in deaths are murder.

But look at it from a different perspective.

As Andrew Marr pointed out, the legal definition of murder, (the killing of a human being by a sane person, with intent, malice aforethought – see below) does not embrace acts of indirect killing. At most such unintended killings a lesser form of manslaughter. This does not change by pointing out a long tradition of its use, any more than racial theories are valid through centuries of use.

The BBC corroborates that long tradition.

It was in the 19th Century that philosopher Friedrich Engels sought to prove that society commits “social murder” in his book Condition of the Working-Class in England in 1844.
When society places hundreds of proletarians in such a position that they inevitably meet a too early and an unnatural death… When it deprives thousands of the necessaries of life… forces them, through the strong arm of the law, to remain in such conditions until that death ensues… its deed is murder,” he wrote of Victorian England.
Engels went on to found Marxist theory with fellow German philosopher, Karl Marx.

Such thinking was developed into a conspiracy theory. When society does not progress towards a socialist utopia, as the forces of history dictate, it must be due to the collective and secretive actions of the capitalist class who would lose out. “Social murder” has benefits for those perpetuating those actions. Under Stalin, when the collectivization of agriculture failed to progress towards the socialist utopia, it was due to a conspiracy by the kulaks. In a famine, this gave justification for closing the grain supplies off to these peasant farmers and feeding the cities. Similarly, when factories failed to meet arbitrary targets, it must have been due to managers sabotaging production for the capitalist enemy. Simply being “outed” by another was sufficient evidence to being shot after torture and a show trial.
English Common Law long ago developed the concept of trial by jury. Charges must be clearly stated and substantiated by evidence. The prosecution must convince a jury of the accused’s peers beyond reasonable doubt. The accused have the right to rebut any allegations. The judge overseas proceeding to make sure established rules and procedures are adhered to. It recognizes that no matter how good a case might appear to be, it might be fundamentally flawed. By approaching the issue an alternative perspective, what appears to be a convincing case might not be so watertight, or could completely unravel. Of course, by allowing the defendant to speak, it might work the other way. A defense based on outright lies and contradictions will serve to convince a jury of the prosecution’s accusations. In so doing, the aim is for the decision of the court to be the truth.
The development of the British concepts of “fair play” and “a level playing field” emerged alongside those developments in criminal trial by jury. However, a new word entered the Oxford English Dictionary last month, which indicates that trend has now sharply reversed.

Post-truth

Relating to or denoting circumstances in which objective facts are less influential in shaping public opinion than appeals to emotion and personal belief.

The objective facts of the Grenfell fire can only be established by careful examination of the evidence by competent persons. In assessing those facts, real lessons can be learned, not only to prevent such a horror occurring but possible for people in social housing to be served better. What John McDonnell has achieved in his pronouncements, based on his blinkered prejudices, is to derive conclusions based on empty opinions and anger. As a result, any objective assessment that might show that non-Tory politicians share in the blame will be drowned out, along with the lessons about the limits of political competency.

Kevin Marshall

Appendix – John McDonnell’s Claims

McDonnell at Glastonbury 25th June 2017

Is democracy working? It didn’t work if you were a family living on the 20th floor of Grenfell Tower. Those families, those individuals, 79 so far and there will be more, were murdered by political decisions taken over recent decades. The decision not to build homes and to view housing as only for financial speculation rather than meeting a basic human need murdered those families. The decision to close fire stations and to cut 10,000 fire fighters and then to freeze their pay for over a decade. They were political decisions.

McDonnell Interview with NME – Grenfell Tower from 5.35

My Transcript, without editing.

We’re all angry. We’re all angry.

We are angry because we know the causes of that fire. You know, we know what we know that that the physical causes might have been a fridge that burst on fire, the cladding was wrong or .. that will come out at the inquiry, but I think we know roughly that what those causes are. But the real causes are decisions made by successive Tory Governments in particular. Who basically refused to build homes, in London in particular. And then housing then being used not for housing need but for speculative gain. And as a result you get people crammed into unsafe tower blocks and as a result people lose their lives. It’s a scandal, an absolute scandal.

We, we’ve campaigned over the years, for house building, council house building and investment in the housing program. Jeremy and I have been campaigning on that for nearly thirty years. In addition to that we have been campaigning for thirty years for safety. We were both members, in fact we set up the Fires Brigade Union Parliamentary Group that as far back as…. One speech I dug out was 2004 when I was calling for sprinklers as part of safety measures. So what we have said is when we go back into Government, first of all we will start building homes again. We have promised a million new homes. Half of them will be council houses. And that we tackle some of the housing crisis that we have got. Secondly we will ensure that we invest in our public services and that does to me making sure that homes are safe. Last year Labour put up an amendment to legislation which said that landlords should have a legal responsibility to make sure that their homes are fit for human habitation. That was voted down by Conservative MPs, 75 of whom were landlords. Absolutely disgraceful. So when we go back in we’ll build homes and make them safe.

McDonnell on Andrew Marr Show 17th July 2017 Grenfell from 10:35

Unedited Transcript

AM Do you regret saying that the people who died in the Grenfell tower were killed by political murder?

JMcD No I don’t regret that. I was extremely angry with what went on and I am a West London MP.  This site is not far from … Political decisions were made which resulted in the deaths of these people. That’s a scandal.

AM But murder means a specific thing. Murder means a volition to actually kill another human being – intentional killing.

JMcD There is a long history in this country of concept of social murder where decisions are made with no regard to the consequences of that, and as a result of that people have suffered. That whats happened here and I am angry about that.

AM Do you regard it as murder?

JMcD I believe that social murder has occurred in this instance and I believe that people should be held accountable for that.

AM So who are the murderers?

JMcD I think that it has being a consequence of political decisions over the years that have not addressed the housing crisis that we have had. That have cut back on local government, so proper inspections have not been made. Cut back 11,000 firefighters jobs been cut as well. Even the investment in aerial ladders and things like that in our country.

Appendix – definitions

manslaughter
http://dictionary.law.com/Default.aspx?selected=1209

  1. the unlawful killing of another person without premeditation or so-called “malice aforethought” (an evil intent prior to the killing). It is distinguished from murder (which brings greater penalties) by lack of any prior intention to kill anyone or create a deadly situation.

murder
http://dictionary.law.com/default.aspx?selected=1303

  1. the killing of a human being by a sane person, with intent, malice aforethought (prior intention to kill the particular victim or anyone who gets in the way) and with no legal excuse or authority.

Daniel Hannan on the selfishness of running a deficit and post-truth realities

In the latest Ici Londres production Dan Hannan looks at the morality of deficits.

Daniel Hannan starts by quoting Matthew 7:9-10

If the son shall ask bread of any of you that is a father, will you give him a stone? Or if he asks for a fish will you give him a serpent?

The passage goes onto to say the if you are evil, understand how to give good gifts to your children. By implication, to act for good, we must also understand how to act for the good, not just have the moral injunction.

Hannan goes onto say we do not run up large debts to bequeath to our children. Yet many impose a very different standard as voters, convincing themselves that they are being unselfish. By asking for more money from the State, whether to pay for care in old age or for a pay rise in the public sector, or remission of tuition fees, it might be a very good claim, but it is not an intrinsically unselfish claim, as they are asking for everybody else to chip in and pay for their cause. Conversely those who try to impose some fiscal discipline are deemed selfish. They are standing up for future generations. Austerity is not a random preference but a simple reality.

This is all pretty obvious stuff to anyone who understands basic morality and the slightest notion of finance. It is certainly within the understanding of anybody who has been brought up in a traditional British public school education. But I would suggest it is totally alien to the vast majority of the British public. This reason is described by a new word that entered the Oxford English Dictionary last month.

post-truth

Relating to or denoting circumstances in which objective facts are less influential in shaping public opinion than appeals to emotion and personal belief.

The General Election campaign is a clear illustration of the domination of post-truthers in public life. There is no understanding of public finances, just mass beliefs that are not based on any moral tradition. The spread of the beliefs is on social media, driven by those who most forcefully and repeatedly express their ideas. People are wrong because they disagree with the mass beliefs and shouted down (or trolled in the electronic version) because of it.

In a post last month – General Election 2017 is a victory for the Alpha Trolls over Serving One’s Country – I concluded

It is on the issue of policy to combat climate change that there is greatest cross-party consensus, and the greatest concentration of alpha trolls. It is also where there is the clearest illustration of policy that is objectively useless and harmful to the people of this country.

Like with public finances, climate change is an where post-truthers dominate. Two examples to illustrate.

Consensus messaging

There is no clear evidence of an emerging large human-caused problem with climate and there is no prospect of action to reduce greenhouse has emissions to near zero. Instead we have a dodgy survey that claimed 97% of academic papers on an internet search matching the topics ‘global climate change’ or ‘global warming’ expressed support (belief / assumptions) in the broadest, most banal, form of the global warming hypothesis. This was converted by Senator Bernie Sanders, in questioning Scott Pruitt, into the following:-

As you may know, some 97% of scientists who have written articles for peer-reviewed journals have concluded that climate change is real, it is caused by human activity, and it is already causing devastating problems in the US and around the world.

And

While you are not certain, the vast majority of scientists are telling us that if we do not get our act together and transform out energy system away from fossil fuel there is a real question as to the quality of the planet that we are going to be leaving our children and our grandchildren. 

The conversion from banal belief to these sweeping statements is not the fault of the Senator, though he (or his speech-writers) should have checked. Rather it is of lead author John Cook and his then PhD supervisor Cognitive Psychology Professor Stephan Lewandowsky. Post-truthers will not recognize the glaring difference between the dodgy survey and the Senator’s statements, as it is appeals to emotion and belief that are primary in evaluating political realities.

Mitigating Climate Change

Dangerous climate change is allegedly caused by human greenhouse emissions. The proposed solution is to reduce those emissions (mostly CO2 emissions from the burning of fossil fuels) to near zero. The key for policy is that emissions are global, yet most countries, covering over 80% of the global population have no primary obligation under the 1992 Rio Declaration to reduce their emissions. These developing “non-Annex” countries have accounted for all the in emissions since 1990, as shown in this graph.

The problem can be expressed in my First Law of Climate Mitigation

To reduce global greenhouse gas emissions, the aggregate reduction in countries that reduce their emissions must be greater than aggregate increase in emissions in all other countries.

All the ranting about supporting the Paris Agreement ignores this truism. As a result, countries like the UK who pursue climate mitigation will increase their energy costs and make life harder for the people, whilst not achieving the policy aims. It is the poorest in those policy countries who will bear the biggest burden and create comparative disadvantages compared to the non-policy countries. For the developing countries (shown in purple in the graph) to reduce their emissions would destroy their economic growth, thus preventing the slow climb out of extreme poverty still endured by the majority of people on this planet. In so doing we ignore the moral tradition from our Christian heritage that the primary moral concern of public policy should be the help the poor, the disadvantaged and the marginalized. Ignoring the truism and pursuing bequeaths a worse future for our children and our grandchildren. This is the same for climate change as for public finances. But in both cases it is the post-truth “reality” that prevent this recognition of basic logic and wider morality.

Kevin Marshall


Time will run out to prevent 2°C warming barrier being breached

I have a number of times referred to a graphic “Figure 2 Summary of Results” produced by the UNFCCC for the Paris COP21 Climate Conference in December 2015. It was a centerpiece of the UNFCCC Synthesis report on the aggregate effect of INDCs.

The updated graphic (listed as Figure 2, below the Main Document pdf) is below

This shows in yellow the impact of the INDC submissions covering the period 2015 to 2030) if fully implemented against limiting warming to 2°C  and 1.5°C . This showed the gulf between the vague policy reality and the targets. Simply put, the net result of the INDCs submissions would insufficient for global emissions to peal Yet in reaching an “agreement” the representatives of the entire world collectively put off recognizing that gulf.

For the launch of the UNIPCC AR5 synthesis report in 2014, there were produced a set of slides to briefly illustrate the policy problem. This is slide 20 of 35, showing the  reduction pathways.


The 2°C  of warming central estimate is based upon total GHG emissions in the 21st Century being around 2500 GtCO2e.

At the launch of 2006 Stern Review Sir Nicholas Stern did a short Powerpoint presentation. Slide 4 of the PDF file is below.


The 450ppm CO2e emissions pathway is commensurate with 2°C  of warming. This is based upon total GHG emissions in the 21st Century being around 2000 GtCO2e, with the other 500 GtCO2e presumably coming in the 22nd Century.

The UNFCCC Paris graphic is also based on 2500 GtCO2e it is also possible to calculate the emissions reduction pathway if we assume (a) All INDC commitments are met (b) Forecasts are correct (c) no additional mitigation policies are enacted.

I have produced a basic graph showing the three different scenarios.

The Stern Review assumed global mitigation policy would be enacted around 2010. Cumulative 21st Century emissions would then have been around 450 GtCO2e. With 500 GtCO2e allowed for post 2100, this gave average emissions of around 17 GtCO2e per annum for the rest of the century. 17 GtCO2e, is just under 40% of the emissions in the year the policy would be enacted.

IPCC AR5  assumed global mitigation policy would be enacted around 2020. Cumulative 21st Century emissions would then have been around 950 GtCO2e. A presentation to launch the Synthesis Report rounded this to 1000 GtCO2e as shown in slide 33 of 35.

Assuming that global emissions were brought to zero by the end of the century, this gave average emissions of 20 GtCO2e per annum for the rest of the century. 20 GtCO2e, is just under 40% of the emissions in the year the theoretical global policy would be enacted. The stronger assumption of global emissions being reduced to zero before the end of the century, along with a bit of rounding, offsets the delay.

If the Paris Agreement had been fully implemented, then by 2030 cumulative 21st Century emissions would have around 1500 GtCO2e, leaving average emissions of around 14 GtCO2e per annum for the rest of the century. 17 GtCO2e, is just over 25% of the emissions in the year the policy would be enacted. The failure of the Paris Agreement makes it necessary for true global mitigation policies, if in place by 2030, to be far more drastic that those of just a few years before to achieve the same target.

But the Paris Agreement will not be fully implemented. As Manhatten Contrarian (hattip The GWPF) states, the US was the only major country proposing to reduce its emissions. It looks like China, India, Indonesia, Russia and Germany will all increase their emissions. Further, there is no indication that most countries have any intention of drastically reduce their emissions. To pretend otherwise is to ignore a truism, what I will term the First Law of Climate Mitigation

To reduce global greenhouse gas emissions, the aggregate reduction in countries that reduce their emissions must be greater than aggregate increase in emissions in all other countries.

Modeled projections and targets are rendered meaningless if this truism is ignored. Yet this is what the proposers of climate mitigation policy have been effectively doing for many years. Emissions will therefore breach the mythical 2°C warming barrier, but based on recent data I believe warming will be nowhere near that level.

Kevin Marshall


Larson C ice-shelf break-away is not human-caused but Guardian tries hard to imply otherwise

A couple of days ago the BBC had an article Giant iceberg splits from Antarctic.

The giant block is estimated to cover an area of roughly 6,000 sq km; that’s about a quarter the size of Wales.

A US satellite observed the berg on Wednesday while passing over a region known as the Larsen C Ice Shelf.

Scientists were expecting it. They’d been following the development of a large crack in Larsen’s ice for more than a decade.

The rift’s propagation had accelerated since 2014, making an imminent calving ever more likely.

After looking at various evidence the BBC concludes

“Most glaciologists are not particularly alarmed by what’s going on at Larsen C, yet. It’s business as usual.”

Researchers will be looking to see how the shelf responds in the coming years, to see how well it maintains a stable configuration, and if its calving rate changes.

There was some keen interest a while back when the crack, which spread across the shelf from a pinning point known as the Gipps Ice Rise, looked as though it might sweep around behind another such anchor called the Bawden Ice Rise. Had that happened, it could have prompted a significant speed-up in the shelf’s seaward movement once the berg came off.

As it is, scientists are not now expecting a big change in the speed of the ice.

That is the theory about a link with accelerating global warming is no longer held due to lack of evidence. But the Guardian sees things differently.

Unlike thin layers of sea ice, ice shelves are floating masses of ice, hundreds of metres thick, which are attached to huge, grounded ice sheets. These ice shelves act like buttresses, holding back and slowing down the movement into the sea of the glaciers that feed them.

“There is enough ice in Antarctica that if it all melted, or even just flowed into the ocean, sea levels [would] rise by 60 metres,” said Martin Siegert, professor of geosciences at Imperial College London and co-director of the Grantham Institute for Climate Change & Environment. 

Despite the lack of evidence for the hypothesis about accelerating ice loss due to glaciers slipping into the sea the Guardian still quotes the unsupported hypothesis. Then the article has a quote from someone who seems to extend the hypothesis to the entire continent. Inspection of their useful map of the location of Larson C might have been helpful.

Larsen C is located mid-way up the Antarctic Peninsula, which comprises around 2% of the area of Antarctica. The Peninsula has seen some rapid warming, quite unlike East Antarctica where very little warming has been detected. That is the Antarctic Peninsula is climatically different from the vast majority of the continent, where nearly all of the ice mass is located.

The article the goes on to contradict the implication with climate change, so the quote is out of context.

Andrew Shepherd, professor of Earth Observation at the University of Leeds, agreed. “Everyone loves a good iceberg, and this one is a corker,” he said. “But despite keeping us waiting for so long, I’m pretty sure that Antarctica won’t be shedding a tear when it’s gone because the continent loses plenty of its ice this way each year, and so it’s really just business as usual!”

However, the Guardian then slips in another out of context quote at the end of the article.

The news of the giant iceberg comes after US president Donald Trump announced that the US will be withdrawing from the 2015 Paris climate accord – an agreement signed by more than 190 countries to tackle global warming. 

Another quote from the BBC article helps give more perspective.

How does it compare with past bergs?

The new Larsen berg is probably in the top 10 biggest ever recorded.

The largest observed in the satellite era was an object called B-15. It came away from the Ross Ice Shelf in 2000 and measured some 11,000 sq km. Six years later, fragments of this super-berg still persisted and passed by New Zealand.

In 1956, it was reported that a US Navy icebreaker had encountered an object of roughly 32,000 sq km. That is bigger than Belgium. Unfortunately, there were no satellites at the time to follow up and verify the observation.

It has been known also for the Larsen C Ice Shelf itself to spawn bigger bergs. An object measuring some 9,000 sq km came away in 1986. Many of Larsen’s progeny can get wound up in a gyre in the Weddell sea or can be despatched north on currents into the Southern Ocean, and even into the South Atlantic.

A good number of bergs from this sector can end up being caught on the shallow continental shelf around the British overseas territory of South Georgia where they gradually wither away.

Bigger events have happened in the past. It is only due to recent technologies that we are able to measure the break-up of ice shelves, or even to observe icebergs the size of small countries.

Note that the Guardian graphic is sourced from Swansea University. Bloomberg has a quote that puts the record straight.

Although this is a natural event, and we’re not aware of any link to human-induced climate change,” said Martin O’Leary, a glaciologist at Swansea University, in a statement.

Kevin Marshall

The Closest yet to my perspective on Climate Change

 Michael S. Bernstam of the Hoover Institution has produced a short post Inconvenient Math. (hattip The GWPF). The opening paragraphs are:-

Climate change faces a neglected actuarial problem. Too many conditions must be met to warrant a policy action on climate change. The following four stipulations must each be highly probable:

1. Global warming will accumulate at 0.12 degrees Celsius or higher per decade.

2. It is anthropogenic, due largely to carbon dioxide emissions.

3. The net effect is harmful to human well-being in the long run.

4. Preventive measures are efficient, that is, feasible at the costs not exceed-ing the benefits.

But even if the probability of each of these stipulations is as high as 85 percent, their compound probability is as low as 50 percent. This makes a decision to act or not to act on climate change equivalent to flipping a coin.

Bernstam later states

In the case of climate change, the conditions are four. They are not random, nor are they arbitrary. To see this, one can run a thought experiment and drop or ignore any of the above foursome. At once, the entire call for action on climate change becomes pointless. If global warming is not ongoing, there is no need to stop it. If it is not anthropogenic, there is no need to curb carbon dioxide emissions. If it is not harmful, there is no need to worry. If preventive measures are inefficient, they would not help and there is no use applying them. It follows that all four conditions are necessary. If just one of them does not hold, action is unnecessary or useless.

That is, for action on climate change to be justified (in terms of having a reasonable expectation that by acting to combat climate change a better future will be created than by not acting) there must be human-caused warming of sufficient magnitude to produce harmful consequences, AND measures that cost less than the expected future costs that they offset.

These sentiments are a simplified version of a series of posts I made in October 2013, where I very crudely deriving two cost curves (costs of climate change and climate mitigation). This aimed to replicate a takeaway quote from the Stern Review.

Using the results from formal economic models, the Review estimates that if we don’t act, the overall costs and risks of climate change will be equivalent to losing at least 5% of global GDP each year, now and forever. If a wider range of risks and impacts is taken into account, the estimates of damage could rise to 20% of GDP or more. In contrast, the costs of action – reducing greenhouse gas emissions to avoid the worst impacts of climate change – can be limited to around 1% of global GDP each year.

I looked at the idea of multiplying the various probabilities together, at least for the costs of climate change.  But instead of the boundary it is a continuous function of an infinite number of possible scenarios. In general I believe the more extreme the costs of warming, the less likely it is to happen. The reason is that we derive the non-visible part of the cost curve can only be objectively derived from the revealed warming from the recent past. Separation of the costs of warming-induced climate change are extremely difficult from the costs of random extreme weather events. Even worse, the costs of extreme natural weather events (especially in terms of death toll) has been falling over time, as Indur Goklany has documented. The fall-back for global-warming theory is to use the late Milton Friedman’s Methodology of Positive Economics. That is to evaluate theory credibility on its predictive ability. If in the short-run climate scientists (or anyone who believes in climate alarmism like Al Gore) are able to make predictions about the signals of impending climate apocalypse, then this should give some credibility for claims of substantially worse to come. The problem is there are a huge number of failed predictions of climate worsening, but not a single one that has come true. This would signify that the true risk (as opposed to the perceived risk from the climate community) of climate change is approximately zero. The divergence of belief from the evidence is likely from the collective navel-gazing of post normal science.

The policy aspect that Bernstam fails to explore is the re-distributional aspects of policy. The theory is that global warming is caused by global greenhouse gas emissions. Therefore climate mitigation must comprise of reducing those global emissions. However, as the COP21 Paris showed most of the worlds population live in countries where there are no GHG emissions reduction policies even proposed. But actually reducing emissions means increasing energy costs, and hampering businesses with onerous regulations. Policy countries are given a comparative disadvantage to non-policy countries, as I tried to show here. The implication is that if developed countries strongly pursue high cost mitigation policies, the marginal cost of non-policy emerging economies switching to emissions reduction policies increases. Thus, whilst Donald Trump’s famous tweet that Global Warming is a Chinese hoax to make US manufacturing non-competitive is false, the impact of climate mitigation policies as currently pursued are the same as if it were true.

There is also a paradox with the costs of climate change. The costs of climate change are largely related to the unexpected nature of the costly events. For instance, ceteris paribus. a category 1 hurricane could be more costly in a non-hurricane area than a stronger hurricane in say Florida. The reason is that in the non-hurricane area buildings will not be as resistant to storms, nor will there be early warning procedures in place as in Florida. The paradox is that more successful climate scientists are in forecasting the risks of climate change, the more people can adapt to climate change, reducing the costs. The current focus on climate consensus, rather than focusing on increasing competency and developing real expertise in the field is actually harmful to future generations if climate change is a actually a serious emerging problem. But the challenge for the climate alarmists is that in developing the real expertise may result in their beliefs about the world are false.

Finally, Bernstam fails to acknowledge an immutable law of public policy. Large complex public policy projects with vague aims; poorly defined plans and lack of measurable costs tend to overshoot on costs and under-perform of benefits. Climate mitigation is an extreme example of complexity, lack of clear objects and lack object measurement of costs per unit of emissions saved.

Kevin Marshall

Joe Romm eco-fanaticism shown in Sea-Level Rise claims

The previous post was quite long and involved. But to see why Jo Romm is so out of order in criticizing President Trump’s withdrawal from the Paris Climate Agreement, one only has to examine the sub-heading of his rant  Trump falsely claims Paris deal has a minimal impact on warming. –

It may be time to sell your coastal property.

This follows with a graphic of Florida.

This implies that people in Southern Florida should take in account a 6 metre (236 inch) rise in sea levels as a result of President Trump’s decision. Does this implied claim stack up. As in the previous post, let us take a look at Climate Interactive’s data.

Without policy, Climate Interactive forecast that US emissions without policy will be 14.44 GtCO2e, just over 10% of global GHG emissions, and up from 6.8 GtCO2e in 2010. At most, even on CIs flawed reasoning, global emissions will be just 7% lower in 2100 with US policy. In the real world, the expensive job-destroying policy of the US will make global emissions around 1% lower even under the implausible assumption that the country were to extend the policy through to the end of the century. That would be a tiny fraction of one degree lower, even making a further assumption that a doubling of CO2 levels causes 3C of warming (an assumption contradicted by recent evidence). Now it could be that every other country will follow suit, and abandon all climate mitigation policies. This would be a unlikely scenario, given that I have not sensed a great enthusiasm for other countries to follow the lead of the current Leader of the Free World. But even if that did happen, the previous post showed that current policies do not amount to very much difference in emissions. Yet let us engage on a flight of fancy and assume for the moment that President Trump abandoning the Paris Climate Agreement will (a) make the difference between 1.5C of warming, with negligable sea-level rise and 4.2C of warming with the full impact of sea-level rise being felt (b) 5% of that rise. What difference will this make to sea-level rise?

The Miami-Dade Climate Change website has a report from The Sea Level Rise Task Force that I examined last November. Figure 1 of that report gives projections of sea-level rise assuming the no global climate policy.

Taking the most extreme NOAA projection it will be around the end of next century before sea-levels rose by 6 metres. Under the IPCC AR5 median estimates – and this is meant to be the Climate Bible for policy-makers – it would be hundreds of years before that sea-level rise would be achieved. Let us assume that the time horizon of any adult thinking of buying a property, is through to 2060, 42 years from now. The NOAA projection is 30 inches (0.76 metres) for the full difference in sea-level rise, or 1.5 inches (0.04 metres) for the slightly more realistic estimate. Using the mainstream IPCC AR5 median estimate, sea-level rise is 11 inches (0.28 metres) for the full difference in sea-level rise, or 0.6 inches (0.01 metres) for the slightly more realistic estimate. The real world evidence suggests that even these tiny projected sea level rises are exaggerated. Sea tide gauges around Florida have failed to show an acceleration in the rate of sea level rise. For example this from NOAA for Key West.

2.37mm/year is 9 inches a century. Even this might be an exaggeration, as in Miami itself, where the recorded increase is 2.45mm/year, the land is estimated to be sinking at 0.53mm/year.

Concluding Comments

If people based their evidence on the real world, President Trump pulling out of the Paris Climate Agreement will make somewhere between zero and an imperceptible difference to sea-level rise. If they base their assumptions on mainstream climate models, the difference is still imperceptible. But those with the biggest influence on policy are more influenced by the crazy alarmists like Joe Romm. The real worry should be that many policy-makers State level will be encouraged to waste even more money on unnecessary flood defenses, and could effectively make low-lying properties near worthless by planning blight when there is no real risk.

Kevin Marshall


Joe Romm inadvertently exposes why Paris Climate Agreement aims are unachievable

Summary

Joe Romm promotes a myth that the Paris Climate Agreement will make a huge difference to future greenhouse gas emissions. Below I show how the modelled impact of think tank Climate Interactive conclusion of a large difference is based on emissions forecasts of implausible large emissions growth in policy countries, and low emissions growth in the non-policy developing countries.


In the previous post I looked at how blogger Joe Romm falsely rebutted a claim that President Donald Trump had made that the Paris climate deal would only reduce only reduce future warming in 2100 by a mere 0.2°C. Romm was wrong on two fronts. He first did not check the data behind his assertions and second,  in comparing two papers by the same organisation he did not actually read the explanation in the later paper on how it differed from the first. In this post I look at how he has swallowed whole the fiction of bogus forecasts, that means the mere act of world leaders signing a bit of paper leads to huge changes in forecast emissions.

In his post  Trump falsely claims Paris deal has a minimal impact on warming, Romm states

In a speech from the White House Rose Garden filled with thorny lies and misleading statements, one pricks the most: Trump claimed that the Paris climate deal would only reduce future warming in 2100 by a mere 0.2°C. White House talking points further assert that “according to researchers at MIT, if all member nations met their obligations, the impact on the climate would be negligible… less than .2 degrees Celsius in 2100.”

The Director of MIT’s System Dynamics Group, John Sterman, and his partner at Climate Interactive, Andrew Jones, quickly emailed ThinkProgress to explain, “We are not these researchers and this is not our finding.”

They point out that “our business as usual, reference scenario leads to expected warming by 2100 of 4.2°C. Full implementation of current Paris pledges plus all announced mid-century strategies would reduce expected warming by 2100 to 3.3°C, a difference of 0.9°C [1.6°F].”

The reference scenario is RCP8.5, used in the IPCC AR5 report published in 2013 and 2014. This is essentially a baseline non-policy forecast against which the impact of climate mitigation policies can be judged. The actual RCP website produces emissions estimates by type of greenhouse gas, of which breaks around three-quarters is CO2. The IPCC and Climate Interactive add these different gases together with an estimate of global emissions in 2100. Climate Interactive current estimate as of April 2017 is 137.58 GtCO2e for the the reference scenario and the National Plans will produce 85.66 GTCO2e. These National would allegedly make global emissions 37.7% than they would have been without them, assuming they are extended beyond 2030. Climate Interactive have summarized this in a graph.

To anyone who actually reads the things, this does not make sense. The submissions made prior to the December 2015 COP21 in Paris were mostly political exercises, with very little of real substance from all but a very few countries, such as the United Kingdom. Why it does not make sense becomes clear from the earlier data that I extracted from Climate Interactives’ C-ROADS Climate Simulator version v4.026v.071 around November 2015.  This put the RCP8.5 global GHG emissions estimate in 2100 at the equivalent of 139.3 GtCO2e. But policy is decided and implemented at country level. To determine the impact of policy proposal there must be some sort of breakdown of emissions. C-ROADS does not provide a breakdown by all countries, but does to divide the world into up to 15 countries and regions. One derived break-down is into 7 countries or regions. That is the countries of USA, Russia, China and India, along with the country groups of EU27, Other Developed Countries and Other Developing Countries. Also available are population and GDP historical data and forecasts. Using this RCP8.5 and built-in population forecasts I derived the following GHG emissions per capita for the historical period 1970 to 2012 and the forecast period 2013 to 2100.

Like when I looked at Climate Interactives’ per capita CO2 emissions from fossil fuels estimates at the end of 2015, these forecasts did not make much sense. Given that these emissions are the vast majority of total GHG emissions it is not surprising that the same picture emerges.

In the USA and the EU I can think of no apparent reason for the forecast of per capita emissions to rise when they have been falling since 1973 and 1980 respectively. It would require for energy prices to keep falling, and for all sectors to be needlessly wasteful. The same goes for other developed countries, which along with Canada and Australia, includes the lesser developed countries of Turkey and Mexico. Indeed why would these countries go from per capita emissions similar to the EU27 now to those of the USA in 2100?

In Russia, emissions have risen since the economy bottomed out in the late 1990s following the collapse of communism. It might end up with higher emissions than the USA in 1973 due to the much harsher and extreme climate. But technology has vastly improved in the last half century and it should be the default assumption that it will continue to improve through the century. It looks like someone, or a number of people, have failed to reconcile the country estimate with the forecast decline in population from 143 million in 2010 to 117 million. But more than this, there is something seriously wrong with emission estimates that would imply that the Russian people become evermore inefficient and wasteful in their energy use.

In China there are similar issues. Emissions have increased massively in the last few decades on the back of even more phenomenal growth, that surpasses the growth of any large economy in history. But emissions per capita will likely peak due to economic reasons in the next couple of decades, and probably at a much lower level than the USA in 1973. But like Russia, population is also forecast to be much lower than currently. From a population of 1340 million in 2010, Climate Interactive forecasts population to peak at  1420 million in 2030 (from 2020 to 2030 growth slows to 2 million a year) to 1000 million in 2100. From 2080 (forecast population 1120) to 2100 population is forecast to decline by 6 million a year.

The emissions per capita for India I would suggest are far too low. When made, the high levels of economic growth were predicted to collapse post 2012. When I wrote the previous post on 30th December 2015, to meet the growth forecast for 2010-2015, India’s GDP would have needed to drop by 20% in the next 24 hours. It did not happen, and in the 18 months since actual growth has further widened the gap with forecast. Similarly forecast growth in GHG emissions are far too low. The impact of 1.25 billion people today (and 1.66 billion in 2100) is made largely irrelevant, nicely side-lining a country who has declared economic growth is a priority.

As with the emissions forecast for India, the emissions forecast for other developing countries is far too pessimistic, based again on too pessimistic growth forecasts. This mixed group of countries include the 50+ African nations, plus nearly all of South America. Other countries in the group include Pakistan, Bangladesh, Myanmar, Thailand, Indonesia, Vietnam, Haiti, Trinidad, Iraq, Iran and Kiribati. There are at least a score more I have omitted, in total making up around 42% of the current global population and 62% of the forecast population in 2100. That is 3 billion people today against 7 billion in 2100. A graph summarizing of Climate Interactive’s population figures is below.

This can be compared with total GHG emissions.

For the USA, the EU27, the other Developed countries and China, I have made more reasonable emissions per capita estimates for 2100.

These more reasonable estimates (assuming there is no technological breakthrough that makes zero carbon energy much cheaper than any carbon technology) produce a reduction in projected emissions of the same order of magnitude as the supposed reduction resulting from implementation of the National Plans. However, global emissions will not be this level, as non-policy developing nations are likely to have much higher emissions. Adjusting for this gives my rough estimate for global emissions in 2100.

The overall emissions forecast is not very dissimilar to that of RCP8.5. Only this time the emissions growth has shift dramatically from the policy countries to the non-policy countries. This is consistent with the data from 1990 to 2012, where I found that the net emissions growth was accounted for by the increase in emissions from developing countries who were not signatories to reducing emissions under the 1992 Rio Declaration. As a final chart I have put the revised emission estimates for India and Other Developing Countries to scale alongside Climate Interactives’ Scoreboard graphic at the top of the page.

This clearly shows that the emissions pathway consistent the constraining warming to  2°C will only be attained if the developing world collectively start reducing their emissions in a very few years from now. In reality, the priority of many is continued economic growth, which will see emissions rise for decades.

Concluding Comments

This is a long post, covering a lot of ground. In summary though it shows environmental activist has Joe Romm has failed to check the claims he is promoting. An examination of Climate Interactive (CI) data underlying the claims that current policies will reduce global temperature by 0.9°C through reducing GHG global emissions does not stand up to scrutiny. That 0.9°C claim is based on global emissions being around 35-40% lower than they would have been without policy. Breaking the CI data down into 7 countries and regions reveals that

  • the emissions per capita forecasts for China and Russia show implausibly high levels of emissions growth, when they show peak in a few years.
  • the emissions per capita forecasts for USA and EU27 show emissions increasing after being static or falling for a number of decades.
  • the emissions per capita forecasts for India and Other Developing Countries show emissions increasing as at implausibly lower rates than in recent decades.

The consequence is that by the mere act of signing an agreement makes apparent huge differences to projected future emissions. In reality it is folks playing around with numbers and not achieving anything at all, except higher energy prices and job-destroying regulations. However, it does save the believers in the climate cult from having to recognize the real world. Given the massed hordes of academics and political activists, that is a very big deal indeed.

Kevin Marshall 

Joe Romm falsely accuses President Trump understating Impact of Paris Deal on Global Warming

Joe Romm of Climate Progress had a post two weeks ago Trump falsely claims Paris deal has a minimal impact on warming

Romm states

In a speech from the White House Rose Garden filled with thorny lies and misleading statements, one pricks the most: Trump claimed that the Paris climate deal would only reduce future warming in 2100 by a mere 0.2°C. White House talking points further assert that “according to researchers at MIT, if all member nations met their obligations, the impact on the climate would be negligible… less than .2 degrees Celsius in 2100.”

The deeply prejudiced wording, written for an extremely partisan readership, encourages readers to accept the next part without question.

The 0.2°C estimate used by Trump may be from another MIT group; the Joint Program on the Science and Policy of Global Change did have such an estimate in early 2015, before all of the Paris pledges were in. But, their post-Paris 2016 analysis also concluded the impact of the full pledges was closer to 1°C.

The source for the 0.2°C claim is the MIT JOINT PROGRAM ON THE SCIENCE AND POLICY OF GLOBAL CHANGE. ENERGY & CLIMATE OUTLOOK PERSPECTIVES FROM 2015

This states

New in this edition of the Outlook are estimates of the impacts of post-2020 proposals from major countries that were submitted by mid-August 2015 for the UN Conference of Parties (COP21) meeting in Paris in December 2015.

So what INDC submissions were in by Mid-August? From the submissions page (and with the size of total 2010 GHG Emissions from the Country Briefs) we get the following major countries.

In box 4 of the outlook, it is only Korea that is not included in the 0.2°C impact estimate. That is just over half the global emissions are covered in the MIT analysis. But there were more countries who submitted after mid-August.

The major countries include

 
My table is not fully representative, as the UNFCCC did not include country briefs for Nigeria, Egypt, Saudi Arabia, Iran, Iraq, Kuwait and UAE. All these countries made INDC submissions along with a lot of more minor GHG emitters. I would suggest that by mid-August all the major countries that wanted to proclaim how virtuous they are in combating climate change were the early producers of the INDC submissions. Countries like the Gulf States, India and Indonesia tended to slip their documents in somewhat later with a lot of measly words to make it appear that they were proposing far more than token gestures and pleas for subsidies. Therefore, the 0.2°C estimate likely included two-thirds to three-quarters of all the real emission constraint proposals. So how does an analysis a few months later produce almost five times the impact on emissions?

The second paragraph of the page the later article Joe Romm links to clearly states difference in methodology between the two estimates.


A useful way to assess that impact is to simulate the effects of policies that extend the Agreement’s 188 pledges (known as Nationally Determined Contributions, or NDCs) to the end of the century. In a new study that takes this approach, a team of climate scientists and economists from the MIT Joint Program on the Science and Policy of Global Change led by research scientist Andrei Sokolov finds that by 2100, the Paris Agreement reduces the SAT considerably, but still exceeds the 2 C goal by about 1 C.

The primary difference is that the earlier study tries to measure the actual, real world, impacts of existing policy, and policy pledges, if those policies are fully enacted. In the USA, those pledges would need Congressional approval to be enacted. The later study takes these submissions, (which were only through to 2030) and tries to estimate the impact if they were extended until 2100.  That is renewables subsidies that push up domestic and business energy costs would be applied for 85 years rather than 15. It is not surprising that if you assume policy proposals are extended for over five times their original period, that they will produce almost five times the original impact. To understand this all that is required is to actually read and comprehend what is written. But Joe Romm is so full of bile for his President and so mad-crazy to save the planet from the evils of Climate Change and (mostly US) big business that he is blinded to that simple reality-check.

The fuller story is that even if all policies were fully enacted and extended to 2100, the impact on emissions would be far smaller than Joe Romm claims. That will be the subject of the next post.

Kevin Marshall