One aspect of neoclassical economics that is extremely useful is the representation of an economic theory in a graphical form. Where would any introductory course be without Alfred Marshall’s supply and demand curves? For many years, the ideas of John Maynard Keynes’s ideas were synthesised in the Sir John Hicks’s IS-LM curves. These graphs have the advantage of enabling analysis of the logical consequences of changes in the overall context of the problem under consideration. In climate, there is a lot of shouting between the different camps, but what appears to be a complete inability to put the consequences of global warming and the mitigation policy option of globally constraining the growth of greenhouse gas emissions into their proper context. Therefore, when assumptions are changed, or new information becomes available, it is difficult to put those into the overall context of the “climate change” issue.
Sir Nicholas (now Lord) Stern’s report of 2006 (In the Summary of Conclusions) had the two ideas separated when it claimed
Using the results from formal economic models, the Review estimates that if we don’t act, the overall costs and risks of climate change will be equivalent to losing at least 5% of global GDP each year, now and forever. If a wider range of risks and impacts is taken into account, the estimates of damage could rise to 20% of GDP or more. In contrast, the costs of action – reducing greenhouse gas emissions to avoid the worst impacts of climate change – can be limited to around 1% of global GDP each year.
This leads to two offsetting sets of costs. The first is the “do-nothing approach” of letting greenhouse gas emissions spiral out of control, raising global temperatures by a number of degrees and throwing the weather systems out of control. The other is the policy costs of constraining the rise in emissions by switching to “cleaner” forms of living in general and energy-production in particular. It is should not be confused with a cost-benefit approach. Stern is proposing to exchange a very high set of costs in the distant future, with a much lower set of policy costs now. His proposal is not to incur costs in exchange for a stream of benefits (like when constructing a new motorway), but to minimize total costs of climate change and policy.
Constructing the graph
We are told by the climate scientists that some of the minor consequences of around 0.8oC of warming over the last century are already visible. But their climate models project this is utterly insignificant compared to what will happen if greenhouse gases continue to increase unchecked for the next century or more. The large increases in temperature – around 4oC to 7oC or higher – would cause massive disruption to the climate system. It is fair to say that as global temperatures increase, these costs would increase exponentially. These “costs” are in the broadest sense. They are not just the human costs of property damage, failed harvests, population migrations and land being submerged by rising seas. These include the damage to the eco-systems and species extinction. Assuming a top end of 7oC the cost curve would look something like this.
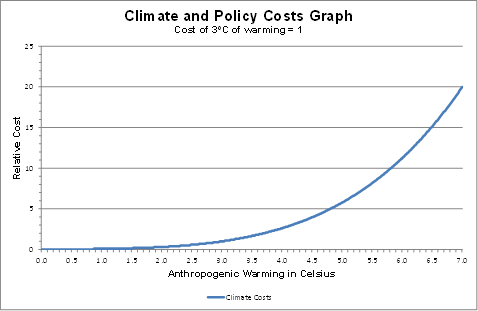
The relative cost scales 7oC of warming are set to be twenty times the costs of constraining global warming to 3oC, or the mid-range of estimates by the IPCC for a doubling of CO2 from pre-industrial levels of 280ppm, and an approximate policy target.
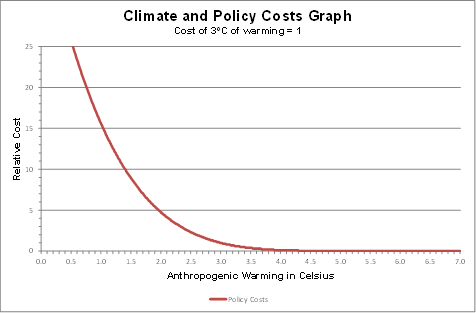
Conversely, the cost of stopping any more warming will be huge. Hugely aggressive policies would quickly stop any increases in emissions and could bring about major reductions. But such policies would bring to a halt the fast-growing economies of China and India, and would considerably worsen the recession in much of Europe. However, it is possible to postulate that low-cost policies that give the odd nudge here and there over a long period could reap large rewards. In line with climate costs, I have set the relative cost of constraining the rise in global temperatures to 3oC above the pre-industrial levels to 1. So the curve might look like the one below.
Combining the two curves gives a total cost graph.
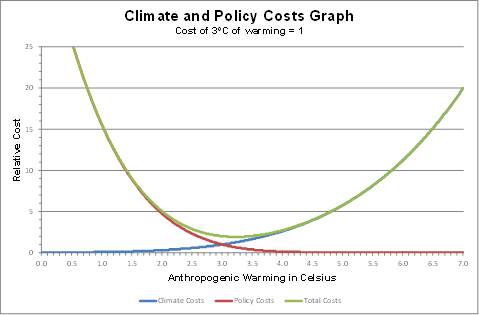
The total costs curve is derived by the addition of the climate and policy cost curves.
This replicates Stern’s statement above. The “do-nothing” scenario is ten times more expensive than the optimal cost-minimization scenario.
Some points to note.
First is that the total cost curve has quite a wide minimum area. Even if a lot of the main policy targets are missed, doing something looks to be far better than doing nothing at all.
Second, is that cost minimization strategy is at a higher temperature level than the intersection of the curves. However, a risk-averse strategy (which most people would expect in avoiding a prospective global catastrophe) would aim for a somewhat lower temperature increase.
Third is that “policy” should be called mitigation policy. That is preventing climate change costs from occurring by constraining the rise in greenhouse gases. As will be seen later, the alternative (or complementary) adaptation policies are included within the climate costs curve. The full reasons will be explained later, but the main one is that climate mitigation is something that, by definition, needs to be tackled at a global level, whereas adaptation can be done at the local, country or regional levels.
Fourth, is a clear separation of mitigation policy considerations from the projections of climate science. Yet new information from the science and policy areas can be put into a total context of acting in the best interests of the planet and the human population.
Fifth, an issue with the policy curve is the change in gradient. There must exist a set of policy options which are low cost, high impact (LC-HI) as well as the high cost, low impact (HC-LI). There are two possible types of policies which should be avoided. First are those with costs, but with zero impact (C-ZI) and second are those with a net negative impact (NNI).
Sixth, any look at climate projections and policy options show they are all over the place. The assumptions of single curves are highly restrictive ones. But like in
Finally, on climate costs there is an issue with projections about future costs. The data we have is from less than one degree of warming, and a minute fraction of projected costs. As shall be shown, the handling of this issue is crucial.
Kevin Marshall

cartoonmick
/ 06/10/2013In regard to climate change scientists and governments, the problem is, those with expertise have no power, and those with power have no expertise.
Greed will always blind, and governments are easily swayed by blind power.
Governments are voted in by the people to govern “for” the people, not “for” big business.
This cartoon refers; http://cartoonmick.wordpress.com/editorial-political/#jp-carousel-775
Cheers
Mick
Brian H
/ 11/10/2013Your second last paragraph ends telepathically. At least, there’s no text after “But like in”.
Susan Z. Marquez
/ 12/10/2013emissions levels and reduction costs. Scientists, economists, and policy makers agree that there is an increasing amount of carbon dioxide in the earth’s atmosphere. Most concede to the fact that this increase in carbon dioxide and other greenhouse gases will lead to some degree of climate change, with the potential to affect human welfare [ 13 , 18 ]. Much of the focus now centers on the development of analytical tools capable of predicting the magnitude of the effects of climate change and costs of mitigation. One commonly used tool to advise policy decisions in the climate change arena is cost benefit analysis .
Brian H
/ 19/10/2013One of the many problems with Stern is that he made the costs of warming up from whole cloth. And discounts the (far more probable) benefits almost entirely.
manicbeancounter
/ 20/10/2013A useful critique of Stern is from Richard Tol and Gary Yohe, which basically backs up this claim of making the costs of warming up – or at least choosing the most extreme forecasts available.
Click to access RM551.pdf
It is another step to translate these extreme warming rates to catastrophic impacts of great impact, and then give the maximum cost imaginable for these forecasts.
It was with Stern in mind that I looked at the elements to create a credible climate change costs curve.
You are also right about Stern discounting the far more probable positive benefits. There are two ways he does this. Stern ignores the evidence available in 2006 of the positive benefits – and that evidence has been increasing.
Further, the net benefits of warming are for the first couple of degrees.
If you reworked Stern’s methodology for this paper, my climate costs curve would go negative. If the extent of warming in the models was true, Stern’s near zero discount rate would give undue prominence to later (and less likely) costly impacts, as against the positive impacts in the more immediate and more likely future.
Much of Tol’s positive benefits of a small amount of warming come from increased CO2 levels. There is growing evidence of these benefits.
http://joannenova.com.au/2013/10/co2-emissions-in-last-50-years-made-us-3-5-trillion-wealthier/