Bishop Hill reports on
A new paper in PNAS entitled ‘Using data to attribute episodes of warming and cooling in instrumental records’ looks important. Ka-Kit Tung and Jiansong Zhou of the University of Washington report that anthropogenic global warming has been overcooked. A lot.
My comment was:-
My prediction is that this paper will turn out to have exaggerated the anthropogenic influence, rather than have under-estimated it.
The relevant quote:-
The underlying net anthropogenic warming rate in the industrial era is found to have been steady since 1910 at 0.07–0.08 °C/decade
Greenhouse gas emissions have not been increasing at a steady rate. The most important is CO2. A couple of years ago I tried to estimate from country data (filling in important gaps) how global CO2 emissions had increased. The increases per quarter century were
1900-1925 85%
1925-1950 60%
1950-1975 185%
1975-2000 45%
That meant global CO2 emissions increased more than 12 times (1100%) in 100 years. The conversion rate to retained CO2 seems to be roughly constant – 4Gt of carbon equivalent to increase CO2 levels by 1ppm. Furthermore, the C20th warming was nearly all in two phases. 1910-1945 and 1975-1998. Rather than temperature rise being related to CO2 emissions, it seems out of step. That would imply a combination of two things for the anthropogenic warming rate to be constant at 0.07–0.08 °C/decade. First is that CO2 has massively diminishing returns. Second is that CO2 emissions alone have a much smaller impact on the global average temperature changes (as reported in HADCRUT4), than this paper concludes.
Supplementary Information
This source of the emissions data is
Boden, T.A., G. Marland, and R.J. Andres. 2010. Global, Regional, and National Fossil-Fuel CO2 Emissions. Carbon Dioxide Information Analysis Center, Oak Ridge National Laboratory, U.S. Department of Energy, Oak Ridge, Tenn., U.S.A. doi 10.3334/CDIAC/00001_V2010
The CO2 levels are for Mauna Loa back to 1959, and estimated backwards from there to 1780.
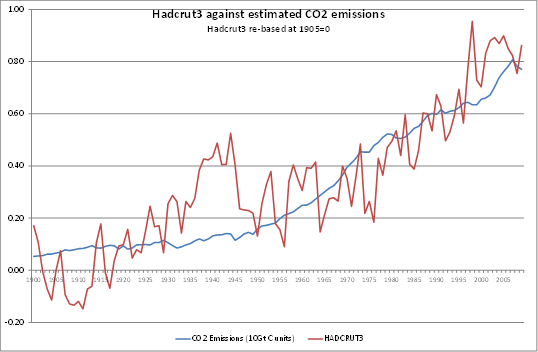
The above chart shows by estimated CO2 emissions (expressed in units of 10Gt of carbon equivalents) shown as against the HADCRUT3 data set. This shows a slow rate of increase in CO2 emissions in the first half of the twentieth century, with falls in emissions during the Great Depression (1929-1933) and at the end of the Second World War (1945). From 1950 to 1973 there was a huge upsurge in emissions with the post-war economic boom, then stalls in 1973 (The OPEC oil embargo) and 1980-83 (global recession). After 2000 there was another surge in emissions, mostly due to rapid growth in China.
The temperature increases followed a different pattern. There were two periods of increasing temperatures in the twentieth century – From 1910-1945 and 1975-1998. The decadal changes graph below shows clearly the change in emissions. The temperature changes by decade exaggerate the falls in temperature in the Edwardian decade and the 1940s.
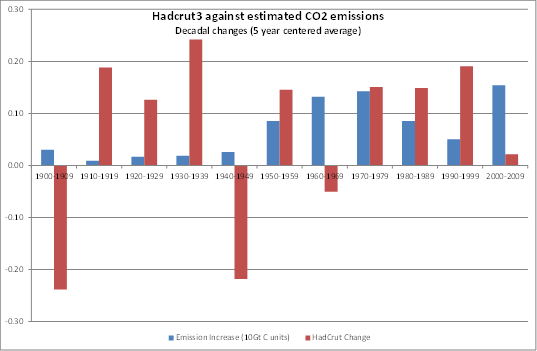
What is clearly illustrated is why I believe the anthropogenic influence on temperature was not similar in every decade from 1910, as Ka-Kit Tung and Jiansong Zhou claim.
