Study on UK Wind and Solar potential fails on costs

Oxford University’s Smith School of Enterprise and the Environment in August published a report “Could Britain’s energy demand be met entirely by wind and solar?“, a short briefing “Wind and solar power could significantly exceed Britain’s energy needs” with a press release here. Being a (slightly) manic beancounter, I will review the underlying assumptions, particularly the costs.

Summary Points

  • Projected power demand is likely high, as demand will likely fall as energy becomes more expensive.
  • Report assumes massively increased load factors for wind turbines. A lot of this increase is from using benchmarks contingent on technological advances.
  • The theoretical UK scaling up of wind power is implausible. 3.8x for onshore wind, 9.4x for fixed offshore and >4000x for floating offshore wind. This to be achieved in less than 27 years.
  • Most recent cost of capital figures are from 2018, well before the recent steep rises in interest rates. Claim of falling discount rates is false.
  • The current wind turbine capacity is still a majority land based, with a tiny fraction floating offshore. A shift in the mix to more expensive technologies leads to an 82% increase in average levelised costs. Even with the improbable load capacity increases, the average levilised cost increase to 37%.
  • Biggest cost rise is from the need for storing days worth of electricity. The annual cost could be greater than the NHS 2023/24 budget.
  • The authors have not factored in the considerable risks of diminishing marginal returns.

Demand Estimates

The briefing summary states

299 TWh/year is an average of 34 GW, compared with 30 GW average demand in 2022 at grid.iamkate.com. I have no quibble with this value. But what is the five-fold increase by 2050 made-up of?

From page 7 of the full report.

So 2050 maximum energy demand will be slightly lower than today? For wind (comprising 78% of potential renewables output) the report reviews the estimates in Table 1, reproduced below as Figure 1

Figure 1: Table 1 from page 10 of the working paper

The study has quite high estimates of output compared to previously, but things have moved on. This is of course output per year. If the wind turbines operated at 100% capacity then the required for 24 hours a day, 365.25 days a year would be 265.5 GW, made up of 23.5GW for onshore, 64GW for fixed offshore and 178GW for floating offshore. In my opinion 1500 TWh is very much on the high side, as demand will fall as energy becomes far more expensive. Car use will fall, as will energy use in domestic heating when the considerably cheaper domestic gas is abandoned.

Wind Turbine Load Factors

Wind turbines don’t operate at anything like 100% of capacity. The report does not assume this. But it does assume load factors of 35% for onshore and 55% for offshore. Currently floating offshore is insignificant, so offshore wind can be combined together. The UK Government produces quarterly data on renewables, including load factors. In 2022 this average about 28% for onshore wind (17.6% in Q3 to 37.6% in Q1) and 41% for offshore wind (25.9% in Q3 to 51.5% in Q4). This data, shown in four charts in Figure 2 does not seem to shown an improving trend in load capacity.
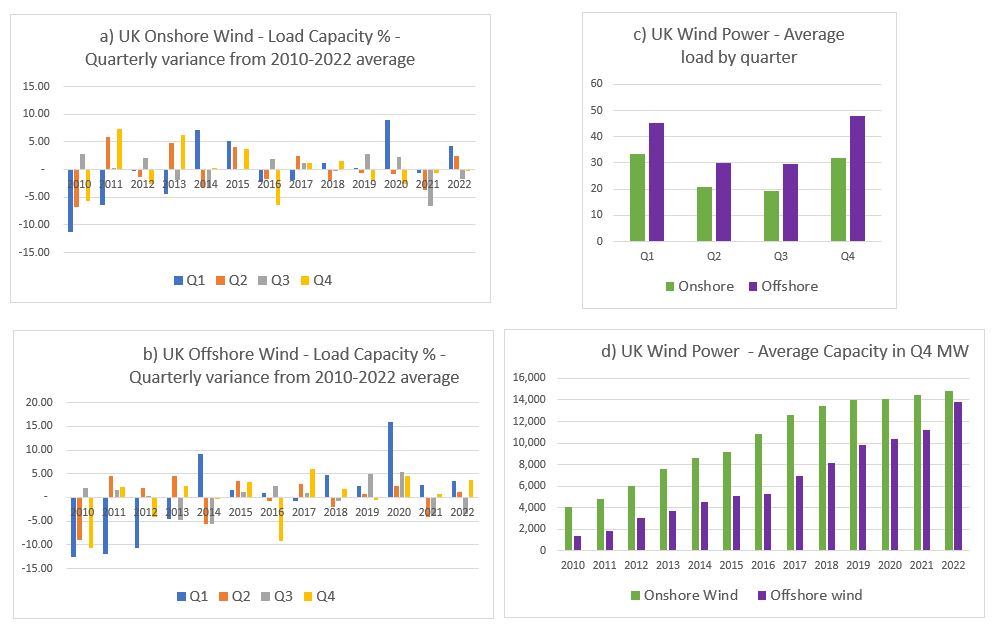
Figure 2 : Four charts illustrating UK wind load capacities and total capacities

The difference is in the report using benchmark standards, not extrapolating from existing experience. See footnote 19 on page 15. The first ref sited is a 2019 DNV study for the UK Department for Business, Energy & Industrial Strategy. The title – “Potential to improve Load Factor of offshore wind farms in the UK to 2035” – should give a clue as to why benchmark figures might be inappropriate to calculate future average loads. Especially when the report discusses new technologies and much larger turbines being used, whilst also assuming some load capacity improvements from reduced downtimes for maintenance.

Scaling up

The report states on page 10

From the UK Government quarterly data on renewables, these are the figures for Q3 2022. Q1 2023 gives 15.2 GW onshore and 14.1 GW offshore. This offshore value was almost entirely fixed. Current offshore floating capacity is 78 MW (0.078 GW). This implies that to reach the reports objectives of 2050 with 1500 TwH, onshore wind needs to increase 3.8 times, offshore fixed wind 9.4 times and offshore floating wind over 4000 times. Could diminishing returns, in both output capacities and costs per unit of capacity set in with this massive scaling up? Or maintenance problems from rapidly installing floating wind turbines of a size much greater than anything currently in service? On the other hand, the report notes that Scotland has higher average wind speeds than “Wales or Britain”, to which I suspect they mean that Scotland has higher average wind speeds to the rest of the UK. If so, they could be assuming a good proportion of the floating wind turbines will be located off Scotland, where wind speeds are higher and therefore the sea more treacherous. This map of just 19 GW of proposed floating wind turbines is indicative.

Cost of Capital

On page 36 the report states

You indeed find these rates on “Table 2.7: Technology-specific hurdle rates provided by Europe Economics”. My quibble is not that they are 2018 rates, but that during 2008-2020 interests rates were at historically low levels. In a 2023 paper it should recognise that globally interest rates have leapt since then. In the UK, base rates have risen from 0.1% in 2020 to 5.25% at the beginning of August 2023. This will surely affect the discount rates in use.

Wind turbine mix

Costs of wind turbines vary from project to project. However, the location determines the scale of costs. It is usually cheaper to put up a wind turbine on land than fix it to a sea bed, then construct a cable to land. This in turn is cheaper than anchoring a floating turbine to a sea bed often in water too deep to fix to the sea bed. If true, moving from land to floating offshore will increase average costs. For this comparison I will use some 2021 levilized costs of energy for wind turbines from US National Renewable Energy Laboratory (NREL).

Figure 3 : Page 6 of the NREL presentation 2021 Cost of Wind Energy Review

The levilized costs are $34 MWh for land-based, $78 MWh for fixed offshore, and $133 MWh for floating offshore. Based on the 2022 outputs, the UK weighted average levilized cost was about $60 MWh. On the same basis, the report’s weighted average levilized cost for 2050 is about $110 MWh. But allowing for 25% load capacity improvements for onshore and 34% for offshore brings average levilized cost down to $82 MWh. So the different mix of wind turbine types leads to an 83% average cost increase, but efficiency improvements bring this down to 37%. Given the use of benchmarks discussed above it would be reasonable to assume that the prospective mix variance cost increase is over 50%, ceteris paribus.

The levilized costs from the USA can be somewhat meaningless for the UK in the future, with maybe different cost structures. Rather than speculating, it is worth understanding why the levilized cost of floating wind turbines is 70% more than offshore fixed wind turbines, and 290% more (almost 4 times) than onshore wind turbines. To this end I have broken down the levilized costs into their component parts.

Figure 3 : NREL Levilized Costs of Wind 2021 Component Breakdown. A) Breakdown of total costs B) Breakdown of “Other Capex” in chart A

Observations

  • Financial costs are NOT the costs of borrowing on the original investment. The biggest element is cost contingency, followed by commissioning costs. Therefore, I assume that the likely long-term rise interest rates will impact the whole levilized cost.
  • Costs of turbines are a small part of the difference in costs.
  • Unsurprisingly, operating cost, including maintenance, are significantly higher out at sea than on land. Similarly for assembly & installation and for electrical infrastructure.
  • My big surprise is how much greater the cost of foundations are for a floating wind turbine are than a fixed offshore wind turbine. This needs further investigation. In the North Sea there is plenty of experience of floating massive objects with oil rigs, so the technology is not completely new.

What about the batteries?

The above issues may be trivial compared to the issue of “battery” storage for when 100% of electricity comes from renewables, for when the son don’t shine and the wind don’t blow. This is particularly true in the UK when there can be a few day of no wind, or even a few weeks of well below average wind. Interconnectors will help somewhat, but it is likely that neighbouring countries could be experiencing similar weather systems, so might not have any spare. This requires considerable storage of electricity. How much will depend on the excess renewables capacity, the variability weather systems relative to demand, and the acceptable risk of blackouts, or of leaving less essential users with limited or no power. As a ballpark estimate, I will assume 10 days of winter storage. 1500 TWh of annual usage gives 171 GW per hour on average. In winter this might be 200 GW per hour, or 48000 GWh for 10 or 48 million Mwh. The problem is how much would this cost?

In April 2023 it a 30 MWh storage system was announced costing £11 million. This was followed in May by a 99 MWh system costing £30 million. These respectively cost £367,000 and £333,000 per MWh. I will assume there will be considerable cost savings in scaling this up, with a cost of £100,000 per MWh. Multiplying this by 48,000,000 gives a cost estimate of £4.8 trillion, or nearly twice the 2022 UK GDP of £2.5 trillion. If one assumes a 25 year life of these storage facilities, this gives a more “modest” £192 billion annual cost. If this is divided by an annual usage of 1500 TWh it comes out at a cost of 12.8p KWh. These costs could be higher if interest rates are higher. The £192 billion costs are more than the 2023/24 NHS Budget.

This storage requirement could be conservative. On the other hand, if overall energy demand is much lower, due to energy being unaffordable it could be somewhat less. Without fossil fuel backup, there will be a compromise between costs energy storage and rationing with the risk of blackouts.

Calculating the risks

The approach of putting out a report with grandiose claims based on a number of assumptions, then expecting the public to accept those claims as gospel is just not good enough. There are risks that need to be quantified. Then, as a project progresses these risks can be managed, so the desired objectives are achieved in a timely manner using the least resources possible. These are things that ought to be rigorously reviewed before a project is adopted, learning from past experience and drawing on professionals in a number of disciplines. As noted above, there are a number of assumptions made where there are risks of cost overruns and/or shortfalls in claimed delivery. However, the biggest risks come from the law of diminishing marginal returns, a concept that has been understood for over 2 00 years. For offshore wind the optimal sites will be chosen first. Subsequent sites for a given technology will become more expensive per unit of output. There is also the technical issue of increased numbers of wind turbines having a braking effect on wind speeds, especially under stable conditions.

Concluding Comments

Technically, the answer to the question “could Britain’s energy demand be met entirely by wind and solar?” is in the affirmative, but not nearly so positively at the Smith School makes out. There are underlying technical assumptions that will likely not be borne out with further investigations. However, in terms of costs and reliable power output, the answer is strongly in the negative. This is an example of where rigorous review is needed before accepting policy proposals into the public arena. After all, the broader justification of contributing towards preventing “dangerous climate change” is upheld in that an active global net zero policy does not exist. Therefore, the only justification is on the basis of being net beneficial to the UK. From the above analysis, this is certainly not the case.

Australian Beer Prices set to Double Due to Global Warming?

Earlier this week Nature Plants published a new paper Decreases in global beer supply due to extreme drought and heat

The Scientific American has an article “Trouble Brewing? Climate Change Closes In on Beer Drinkers” with the sub-title “Increasing droughts and heat waves could have a devastating effect on barley stocks—and beer prices”. The Daily Mail headlines with “Worst news ever! Australian beer prices are set to DOUBLE because of global warming“. All those climate deniers in Australia have denied future generations the ability to down a few cold beers with their barbecued steaks tofu salads.

This research should be taken seriously, as it is by a crack team of experts across a number of disciplines and Universities. Said, Steven J Davis of University of California at Irvine,

The world is facing many life-threatening impacts of climate change, so people having to spend a bit more to drink beer may seem trivial by comparison. But … not having a cool pint at the end of an increasingly common hot day just adds insult to injury.

Liking the odd beer or three I am really concerned about this prospect, so I rented the paper for 48 hours to check it out. What a sensation it is. Here a few impressions.

Layers of Models

From the Introduction, there were a series of models used.

  1. Created an extreme events severity index for barley based on extremes in historical data for 1981-2010.
  2. Plugged this into five different Earth Systems models for the period 2010-2099. Use this against different RCP scenarios, the most extreme of which shows over 5 times the warming of the 1981-2010 period. What is more severe climate events are a non-linear function of temperature rise.
  3. Then model the impact of these severe weather events on crop yields in 34 World Regions using a “process-based crop model”.
  4. (W)e examine the effects of the resulting barley supply shocks on the supply and price of beer in each region using a global general equilibrium model (Global Trade Analysis Project model, GTAP).
  5. Finally, we compare the impacts of extreme events with the impact of changes in mean climate and test the sensitivity of our results to key sources of uncertainty, including extreme events of different severities, technology and parameter settings in the economic model.

What I found odd was they made no allowance for increasing demand for beer over a 90 year period, despite mentioning in the second sentence that

(G)lobal demand for resource-intensive animal products (meat and dairy) processed foods and alcoholic beverages will continue to grow with rising incomes.

Extreme events – severity and frequency

As stated in point 2, the paper uses different RCP scenarios. These featured prominently in the IPCC AR5 of 2013 and 2014. They go from RCP2.6, which is the most aggressive mitigation scenario, through to RCP 8.5 the non-policy scenario which projected around 4.5C of warming from 1850-1870 through to 2100, or about 3.8C of warming from 2010 to 2090.

Figure 1 has two charts. On the left it shows that extreme events will increase intensity with temperature. RCP2.6 will do very little, but RCP8.5 would result by the end of the century with events 6 times as intense today. Problem is that for up to 1.5C there appears to be no noticeable change what so ever.  That is about the same amount of warming the world has experienced from 1850-2010 per HADCRUT4 there will be no change. Beyond that things take off. How the models empirically project well beyond known experience for a completely different scenario defeats me. It could be largely based on their modelling assumptions, which is in turn strongly tainted by their beliefs in CAGW. There is no reality check that it is the models that their models are not falling apart, or reliant on arbitrary non-linear parameters.

The right hand chart shows that extreme events are porjected to increase in frequency as well. Under RCP 2.6 ~ 4% chance of an extreme event, rising to ~ 31% under RCP 8.5. Again, there is an issue of projecting well beyond any known range.

Fig 2 average barley yield shocks during extreme events

The paper assumes that the current geographical distribution and area of barley cultivation is maintained. They have modelled in 2099, from the 1981-2010 a gridded average yield change with 0.5O x 0.5O resolution to create four colorful world maps representing each of the four RCP emissions scenarios. At the equator, each grid is about 56 x 56 km for an area of 3100 km2, or 1200 square miles. Of course, nearer the poles the area diminishes significantly. This is quite a fine level of detail for projections based on 30 years of data to radically different circumstances 90 years in the future. The results show. Map a) is for RCP 8.5. On average yields are projected to be 17% down. As Paul Homewood showed in a post on the 17th, this projected yield fall should be put in the context of a doubling of yields per hectare since the 1960s.

This increase in productivity has often solely ascribed to the improvements in seed varieties (see Norman Borlaug), mechanization and use of fertilizers. These have undoubtably have had a large parts to play in this productivity improvement. But also important is that agriculture has become more intensive. Forty years ago it was clear that there was a distinction between the intensive farming of Western Europe and the extensive farming of the North American prairies and the Russian steppes. It was not due to better soils or climate in Western Europe. This difference can be staggering. In the Soviet Union about 30% of agricultural output came from around 1% of the available land. These were the plots that workers on the state and collective farms could produce their own food and sell surplus in the local markets.

Looking at chart a in Figure 2, there are wide variations about this average global decrease of 17%.

In North America Montana and North Dakota have areas where barley shocks during extreme years will lead to mean yield changes over 90% higher normal, and the areas around have >50% higher than normal. But go less than 1000 km North into Canada to the Calgary/Saskatoon area and there are small decreases in yields.

In Eastern Bolivia – the part due North of Paraguay – there is the biggest patch of > 50% reductions in the world. Yet 500-1000 km away there is a North-South strip (probably just 56km wide) with less than a 5% change.

There is a similar picture in Russia. On the Kazakhstani border, there are areas of > 50% increases, but in a thinly populated band further North and West, going from around Kirov to Southern Finland is where there are massive decreases in yields.

Why, over the course of decades, would those with increasing yields not increase output, and those with decreasing yields not switch to something else defeats me. After all, if overall yields are decreasing due to frequent extreme weather events, the farmers would be losing money, and those farmers do well when overall yields are down will be making extraordinary profits.

A Weird Economic Assumption

Building up to looking at costs, their is a strange assumption.

(A)nalysing the relative changes in shares of barley use, we find that in most case barley-to-beer shares shrink more than barley-to-livestock shares, showing that food commodities (in this case, animals fed on barley) will be prioritized over luxuries such as beer during extreme events years.

My knowledge of farming and beer is limited, but I believe that cattle can be fed on other things than barley. For instance grass, silage, and sugar beet. Yet, beers require precise quantities of barley and hops of certain grades.

Further, cattle feed is a large part of the cost of a kilo of beef or a litre of milk. But it takes around 250-400g of malted barley to produce a litre of beer. The current wholesale price of malted barley is about £215 a tonne or 5.4 to 8.6p a litre. About cheapest 4% alcohol lager I can find in a local supermarket is £3.29 for 10 x 250ml bottles, or £1.32 a litre. Take off 20% VAT and excise duty leaves 30p a litre for raw materials, manufacturing costs, packaging, manufacturer’s margin, transportation, supermarket’s overhead and supermarket’s margin. For comparison four pints (2.276 litres) of fresh milk costs £1.09 in the same supermarket, working out at 48p a litre. This carries no excise duty or VAT. It might have greater costs due to refrigeration, but I would suggest it costs more to produce, and that feed is far more than 5p a litre.

I know that for a reasonable 0.5 litre bottle of ale it is £1.29 to £1.80 a bottle in the supermarkets I shop in, but it is the cheapest that will likely suffer the biggest percentage rise from increase in raw material prices. Due to taxation and other costs, large changes in raw material prices will have very little impact on final retail costs. Even less so in pubs where a British pint (568ml) varies from the £4 to £7 a litre equivalent.

That is, the assumption is the opposite of what would happen in a free market. In the face of a shortage, farmers will substitute barley for other forms of cattle feed, whilst beer manufacturers will absorb the extra cost.

Disparity in Costs between Countries

The most bizarre claim in the article in contained in the central column of Figure 4, which looks at the projected increases in the cost of a 500 ml bottle of beer in US dollars. Chart h shows this for the most extreme RCP 8.5 model.

I was very surprised that a global general equilibrium model would come up with such huge disparities in costs after 90 years. After all, my understanding of these models used utility-maximizing consumers, profit-maximizing producers, perfect information and instantaneous adjustment. Clearly there is something very wrong with this model. So I decided to compare where I live in the UK with neighbouring Ireland.

In the UK and Ireland there are similar high taxes on beer, with Ireland being slightly more. Both countries have lots of branches of the massive discount chain. They also have some products on their website aldi.co.uk and aldi.ie.  In Ireland a 500 ml can of Sainte Etienne Lager is €1.09 or €2.18 a litre or £1.92 a litre. In the UK it is £2.59 for 4 x 440ml cans or £1.59 a litre. The lager is about 21% more in Ireland. But the tax difference should only be about 15% on a 5% beer (Saint Etienne is 4.8%). Aldi are not making bigger profits in Ireland, they just may have higher costs in Ireland, or lesser margins on other items. It is also comparing a single can against a multipack. So pro-rata the £1.80 ($2.35) bottle of beer in the UK would be about $2.70 in Ireland. Under the RCP 8.5 scenario, the models predict the bottle of beer to rise by $1.90 in the UK and $4.84 in Ireland. Strip out the excise duty and VAT and the price differential goes from zero to $2.20.

Now suppose you were a small beer manufacturer in England, Wales or Scotland. If beer was selling for $2.20 more in Ireland than in the UK, would you not want to stick 20,000 bottles in a container and ship it to Dublin?

If the researchers really understood the global brewing industry, they would realize that there are major brands sold across the world. Many are brewed across in a number of countries to the same recipe. It is the barley that is shipped to the brewery, where equipment and techniques are identical with those in other parts of the world. This researchers seem to have failed to get away from their computer models to conduct field work in a few local bars.

What can be learnt from this?

When making projections well outside of any known range, the results must be sense-checked. Clearly, although the researchers have used an economic model they have not understood the basics of economics. People are not dumb  automatons waiting for some official to tell them to change their patterns of behavior in response to changing circumstances. They notice changes in the world around them and respond to it. A few seize the opportunities presented and can become quite wealthy as a result. Farmers have been astute enough to note mounting losses and change how and what they produce. There is also competition from regions. For example, in the 1960s Brazil produced over half the world’s coffee. The major region for production in Brazil was centered around Londrina in the North-East of Parana state. Despite straddling the Tropic of Capricorn, every few years their would be a spring-time frost which would destroy most of the crop. By the 1990s most of the production had moved north to Minas Gerais, well out of the frost belt. The rich fertile soils around Londrina are now used for other crops, such as soya, cassava and mangoes. It was not out of human design that the movement occurred, but simply that the farmers in Minas Gerais could make bumper profits in the frost years.

The publication of this article shows a problem of peer review. Nature Plants is basically a biology journal. Reviewers are not likely to have specialist skills in climate models or economic theory, though those selected should have experience in agricultural models. If peer review is literally that, it will fail anyway in an inter-disciplinary subject, where the participants do not have a general grounding in all the disciplines. In this paper it is not just economics, but knowledge of product costing as well. It is academic superiors from the specialisms that are required for review, not inter-disciplinary peers.

Kevin Marshall


New EU Vacuum Cleaner Regulations likely promoted with false claims

Summary

On September 1st, the EU Commission launched new regulations limiting the maximum power of vacuum cleaners to 900 watts.  A news item claimed

The updated rules will result in vacuum cleaners that use less energy for a better cleaning performance. This will help consumers to save money, as switching to a more efficient product can save €70 over its lifetime.

Elsewhere the is a claim that “with more efficient vacuum cleaners, Europe as a whole can save up to 20 TWh of electricity per year by 2020.

There is no reference to the source of the claims. Pulling in data from various sources I have calculated how the figures may have been derived. Based on these figures it would appear

  • The assumed savings are 200 kWh per vacuum cleaner, based on switching from a 1600 watts to a 900 watts, and 290 hours of use over the average lifetime.
  • This ignores that many vacuum cleaners are below 1600 watts due competition, not rules in place.
  • Cost savings are based on the average electricity costs in the EU, when in reality electricity costs in the most expensive country are 2.6 times that of the cheapest.
  •  Cost savings are not net of cost increases, such as more time spent cleaning and increase costs of the appliance.
  • Claims of reduction in electricity consumption are based on the requirement that all 350 million vacuum cleaners of 1600 watts are replaced by 900 watt cleaners by the start of 2020.

If any business made bald unsubstantiated claims about a new product, it would be required to back up the claims or withdraw them. Morally, I believe the EU Commission should aspire to emulate the standards that it imposes on others in marketing its own products. A law making Authority cannot be regulated and brought to account for the harms it causes. But I feel that it owes its citizens a moral duty of care to serve them, by minimizing the harms that it can cause and maximising the benefits.

The Launch of the New Regulations

BBC had an article on September 1st Sales of inefficient vacuum cleaners banned

They state

The EU’s own website says: “With more efficient vacuum cleaners, Europe as a whole can save up to 20 TWh of electricity per year by 2020.

“This is equivalent to the annual household electricity consumption of Belgium.

“It also means over 6 million tonnes of CO2 will not be emitted – about the annual emissions of eight medium-sized power plants.”

Although the BBC do not link to the webpage among millions. A search on the phrase reveals the following link.

http://ec.europa.eu/energy/en/topics/energy-efficiency/energy-efficient-products/vacuum-cleaners

Vacuum cleaners are subject to EU energy labelling and ecodesign requirements. By switching to one of the most energy efficient vacuum cleaners, you can save €70 over the lifetime of the product.  With more efficient vacuum cleaners, Europe as a whole can save up to 20 TWh of electricity per year by 2020. This is equivalent to the annual household electricity consumption of Belgium. It also means over 6 million tonnes of CO2 will not be emitted – about the annual emissions of eight medium-sized power plants.

There are no references to where the figures come from.

Another source is much nearer in the menu tree to the EU homepage and is on a news page.

http://ec.europa.eu/energy/en/news/updated-energy-efficiency-rules-vacuum-cleaners-will-save-consumers-money

Updated energy efficiency rules for vacuum cleaners will save consumers money

Friday, 01 September 2017

From today, vacuum cleaners sold in Europe will be more cost- and energy-efficient. The European Commission is making use of the latest state-of-the-art technologies to ensure that European consumers have the most energy efficient products available. The updated ecodesign requirements will lower appliances’ maximum power, annual energy consumption and noise levels. They will also increase their minimum ability to pick up dust.

The updated rules will result in vacuum cleaners that use less energy for a better cleaning performance. This will help consumers to save money, as switching to a more efficient product can save €70 over its lifetime. With more efficient vacuum cleaners, Europe as a whole will be in a position to save up to 20 TWh of electricity per year by 2020.

Like with the first EU source (which this press release links backed to) there is no reference to the source of the claims.

Establishing the calculations behind the claims

However, there the claims that together with other data and some assumptions have enabled me to piece together the numbers behind the claims. These are:-

  1. The maximum of 20 TWh of electricity that could be saved by 2020. There are one billion kilowatt hours in a terawatt hour.
  2. According to Eurostat’s Household Composition Statistics, there are 495.6 million EU citizens living in households, with an average 2.3 persons per household. That is around 215 million or maybe 210 million households.
  3. There is more than one vacuum cleaner in the average household.
  4. All vacuum cleaners are operated at maximum power all the time.
  5. All current vacuum cleaners are 1600 watts. By 2020 they will all be at 900 watts.
  6. Life of the average vacuum cleaner is five years. This I worked out from slotting in other variables.


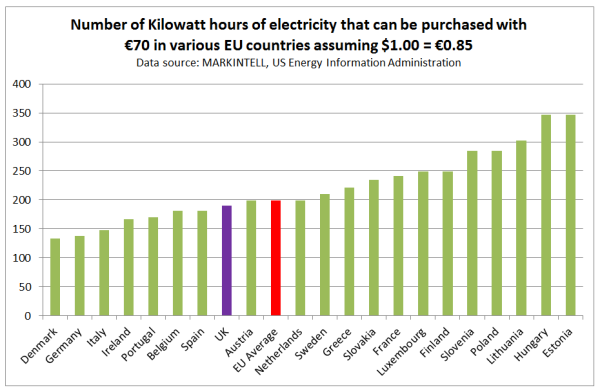
To understand how many kilowatt hours in the maximum cost saving of €70, one needs to know the cost of a unit of electricity. In a recent post on electricity prices in South Australia, Joanne Nova provided a graphic based on data from MARKINTELL, US Energy Information Administration. Based on this I have produced a graphic showing that if Denmark, where electricity is most expensive, a person saved €70 on their electricity bill, the savings in most of the other EU countries.

If the Danes will save €70 from buying a vacuum cleaner under the new regulations, in the UK the saving will be about €49, France €39 and in Hungary and Estonia just €27. This is because of the huge difference in electricity costs, with Danish electricity being 2.6 times that in Hungary and Estonia. It is a simple step to work out the number of kilowatt hours of electricity saved for a spend of €70.  Assuming $1.00 = €0.85, the next graph shows how many units of electricity will be saved in each country.

If the EU Commission had properly checked its figures, when quoting the maximum saving, will base it on the highest electricity rates in the EU, and not the average rates. They will, therefore, assume that the maximum savings for the EU will be around 133 kilowatt hours and not 200 kilowatt hours. Otherwise, the maximum savings in Denmark, Germany, Italy and Portugal could be greater than the claimed maximum, whilst people in some other countries with lower than average electricity costs will be misled as to the extent of the possible savings.

I have put together a table that fits the assumptions and known variables based on €70 of savings in both Denmark and the fictional EU average.

The 200 kWh saving over a five-year vacuum cleaner life seems more reasonable than 133 kWh. The 350 million vacuum cleaners in the EU or two for every three people, seems more reasonable than 538 million, which is both less of a rounded estimate and would mean around 35 million more vacuum cleaners than people. The assumption that the average household spends 1 hour and 50 minutes per week vacuuming might be a bit high, but there again I know of people who regularly exceed this amount by quite a margin.

Based on how the numbers fit the maximum saving of €70 per vacuum cleaner to have been based on the average cost of electricity in the EU. As such it is an incorrect statement. There are other issues that arise.

Evaluating the claims

There are other issues that arise from consideration of these figures, though are not necessarily solely reliant upon those figures.

First, the 26TW of savings is if all the current vacuum cleaners (assumed to be at 1600W rating) will be replaced by the start of 2020. That is in just 2.33 years. If vacuum cleaners have an average five-year life, many people will be scrapping their existing vacuum cleaners before the end of their useful life. Even with a maximum marginal cost saving of €14 a year, this would mean incurring unnecessary additional costs and throwing out perfectly serviceable vacuum cleaners. However, if they replace a 2000 watt or higher vacuum cleaner purchased prior to September 2014, then the savings will be much higher. In which case the EU Commission News item should have noted that some savings were from regulations already in place.

Second is that many households have an old vacuum cleaner in reserve. They may have it for a number of reasons, such as having upgraded in the past, or purchased it prior to the regulations came into force in 2014. So when their main vacuum cleaner finally keels over, they will not purchase a low powered one. It will be therefore very many years before anything approaching 100% of existing vacuum cleaners have been replaced, especially if the perception is that the newer products are inferior.

Third, is an assumption that every vacuum cleaner is on the limit of the regulations. Greater efficiency (saving money) is something people are willing to pay for, so the market provides this anyway without the need for regulation, just as people pay for more fuel efficient cars. It is only the people who max out on the power permitted that will be affected to the full extent. As greater power is a cheap way of increasing performance, this will most affect the cheapest cleaners. The poor and those setting up a home for the first time (with severe budget constraints) are likely to be those most disadvantaged, whilst those who are willing and able to upgrade to the latest gadgets will make the lowest savings.

Fourth, the cost savings appear to be only on electricity costs. The extra costs of upgrading to a more technologically advanced machine that compensates for the loss of power, does not appear to have been taken into account in the calculations. If it had, then the electricity savings would have to be much greater, to include the additional costs. In which case, the fictional European average household would have to be saving far more on their electricity than €70. Let us say people upgrade from a €100 to €300 machine, both with a five year average life. To make €70 of savings over five years a Danish household would have to be running their vacuum cleaner for nearly three hours a week, a British or Dutch household over four hours per week, and the Hungarian and Estonian households over seven hours a week. But this defies other assumptions and would also shorten the average life of a vacuum cleaner. No allowance appears to have been made for more expensive vacuum cleaners.

Fifth, there are other, simpler ways of replacing the loss of suction from lack of power than technological wizardry that pushes up costs. The simplest is to reduce the area in contact with the floor. This means that people spend more time using the machines, offsetting some of the energy savings. Alternatively, there could be some loss of suction, which again means people spend more time cleaning, and getting frustrated due to the lack of performance. Some of this could be by more frequent swapping of cleaning heads. If you value people’s leisure time at just €5.00 an hour, then over the short five year life of a cleaner (about 290 hours based on 65 minutes a week of use), the average household will “lose” the €70 of electricity savings if they have to spend more than 5% more time cleaning. In reality it will be much more, and many people will feel aggrieved at having a less efficient machine.

Sixth is that the extra power can be used for simpler, proven and more robust technologies. Efficiency savings come about through complex optimisation strategies, reducing the life of cleaners.

So the claim by the EU that people will save money from the new regulations seems to be false for any one of a number of reasons. More likely than not people will be made net worse off by the regulations. Further the alleged benefits from the new regulations in terms of savings in electricity (and hence CO2 emissions) seems to have been grossly exaggerated.

But won’t there be a massive saving in CO2 emissions?  Even if the 6 million tonnes of emissions saved is in the more distant future, it is still a far large number. In terms of a small country like Belgium, it is a large amount. But considered in the context of EU’s INDC submission to the Paris climate talks it is quite small.

The EU and its Member States are committed to a binding target of an at least 40% domestic reduction in greenhouse gases emissions by 2030 compared to 1990,

From the accompanying country brief, the 1990 emissions were 5368 mtCO2e, so a 40% cut is 2147 mtCO2e. In 2012 emissions were 4241 mtCO2e (mostly for non-policy reasons) so there is just 1020 million tonnes to cut. 6 million is just 0.6% of that target.

On a global perspective, even with all the vague policy proposals fully enacted, global emissions by 2030 will be nearly 60,000 MtCO2e and will still be rising. There seems no prospect of additional policies being proposed that would start reducing global emissions. A policy that makes around 0.01% of the difference to the larger picture is inconsequential. To achieve the policy goals a few thousand similar-sized schemes are required. Nothing like that is going to happen. Countries in the developing world, with over half the global population, will see emissions will grow for decades, dwarfing any reductions made in the EU.

Concluding comments

The new vacuum cleaner regulations appear to be justified on the basis of grossly exaggerated and untenable claims of the benefits in terms of cost savings and reductions in GHG emissions, whilst ignoring the costs that they impose.

If any business made bald unsubstantiated claims about a new product, it would be required to back up the claims or withdraw them. If such sweeping claims were made about a new product such as anti-aging creams or vitamin pills, that could be attributed to other factors, then it would be prosecuted. Morally, I believe the EU Commission should aspire to emulate the standards that it imposes on others in marketing its own products. A law making Authority cannot be regulated and brought to account for the harms it causes. But I feel that it owes its citizens a moral duty of care to serve them, by minimizing the harms that it can cause and maximising the benefits.

Kevin Marshall


The rising costs of the Renewables Obligation Certificate Scheme

Summary

The cost of Renewables Obligation Certificate scheme ROCs to covert the UK to renewable electricity has more than doubled in less than four years. Whilst the majority of this increase is down to volume increases and inflation, a significant part is down to switching to higher levels of subsidy, particularly for offshore wind farms. This means that the unit cost of electricity from renewables is rising. One wonders if the DECC has factored this into its projected costs of energy to households.

Main Analysis

In my previous posting “Labour’s Hypocrisy on Rising Energy Bills”, I identified that the rise in energy bills over the last few years was mostly due to rising costs external to the energy companies. I only briefly alluded to the causes. This posting looks at the growth in “Renewables Obligation Certificates” (ROCs), the major vehicle to encourage the energy industry to switch to renewables from fossil fuels. Working out the proportion of the “other cost” increases is difficult to work out, but it could be up to a half.

On the 19th December, the Department for Environment, Energy and Climate Change (DECC), issued a great rash of postings to its website. Amongst these of particular interest was “Energy trends section 6: renewables“. This contains a spreadsheet of interest – ET 6.3 “Renewables obligation: certificates and generation”. This gives monthly data covering the period January 2010 to August 2013.

Not all renewables are equal. Different types of renewables attract different ROC rates per MWh (megawatt-hour) of electricity generated. These vary from 0.25 to 5.00. In practice more than 99% of renewable power generated falls into four bands – 0.50, 1.00, 1.50 and 2.00.

Charting the electricity generated in megawatt hours for the period gives the following graph:-


In less than 4 years there has been a spectacular growth in total electricity generated from renewables, from around 1.5m MWh per month in early 2010, to over 3.0m in early 2013. But there has been even greater growth in the generation of renewables with 2.00 ROCs, and the disappearance of the 0.50 ROCs. This can be better seen by the proportions of generation in each of the ROC bands.


In early 2010, less than 5% of renewables generated qualified for 2 ROCs, whereas by 2013 over 20% did. To show the impact more clearly I have devised three indexes. These include all ROC bands for declarations on a monthly basis. (A very tiny number of schemes have annual declarations.)

  1. Renewable electricity generated qualifying for ROCs.
  2. Renewable Obligation Certificates issued.
  3. The buy-out value of the ROCs. This value is declared by the regulator OFGEM, and inflated each year by the Retail Prices Index. The 2013/14 declaration is here, with all the previous rates.

The index is for 12 month periods, with the period January to December 2010 set to 100.


From the period Jan-Dec 2010 to the period Sept 2012-Aug 2013, volume of renewables electricity generated increased by 80%; volume of ROCs by 116%; and value of ROCs by 140%.

There is a rapid growth in renewables, but the real cost per unit generated is increasing more rapidly. In buy-out values terms, the ROCs issued were worth £862m for Jan-Dec 2010 and £2,069m for Sept 2012-Aug 2013. But what type of renewable is responsible for this real cost per unit increase?

The Growth in Wind Turbine generation and ROCs

A major component of renewables has always been wind turbines, but the proportion is increasing. They are split between onshore and offshore. There are three graphs showing this increase.

  1. The proportion of renewables generated from Wind Turbines


    This shows that not only has the proportion of generation from wind turbines increased from around 40% to nearly 60%. More than 100% of the increased proportion is due to offshore wind turbines with 2.00 ROCs per MWh generated.

  2. Wind generated ROCs as a proportion of ROCs issued


    The share of total ROCS for wind turbines now accounts for over 60% of the total. Around 30% is from offshore wind turbines with 2.00 ROCs per MWh generated.

  3. Index of Changes in Renewables Obligation Credits for wind turbines.


From the period Jan-Dec 2010 to the period Sept 2012-Aug 2013, volume of renewables electricity generated increased by 134%; volume of ROCs by 177%; and value of ROCs by 209%. In buy-out values terms, the ROCs issued for wind turbines were worth £426m (49% of the total) for Jan-Dec 2010 and £1,315m (64% of the total) for Sept 2012-Aug 2013.

The true cost of offshore wind power

This analysis has solely concentrated on ET 6.3. The “Renewable electricity capacity and generation” (ET 6.1) file has some useful data on load factors. For wind turbines I have extracted the annual data.


Offshore wind turbines have around 35% higher load factors than onshore.

The vast majority of income for wind turbines is in two parts. There is the wholesale price at around £60 per MWh and the ROC income, which is £42 for onshore and £84 for offshore.

Per annum, with 35% more load, the offshore wind farm can expect about 90% more income per MWh of capacity than the onshore to cover capital and maintenance costs. It is even worse when compared with the gas-fired alternative. The only income for the generator is the £60 per MWh from selling wholesale, but they have the additional costs of at least £20 per MWh for fuel.

Biomass

An area not covered is the growth in the use of Biomass / other fuels at coal-fired power stations. This will be in a posting next year.

Questions on the subsidising of offshore wind turbines

  1. Given that prior to 2010 offshore wind farms were being commissioned with ROCs of 1.00 and 1.50, how much of this increased rate of 2.0 accommodates greater costs (more distant from the shore, and in deeper water) and how much gives greater profits?
  2. Given that a gas-fired power station can cover its operating and capital costs with less than £40 per MWh, should we be considering alternative, and less reliable, forms of electricity generation that seem to need up to four times the income to operate?
  3. Was any independent studies done of the costs of wind-generated power in setting the ROC rates, or was it just on the advice of the renewables industry and a DECC desperate to meet its carbon budget?
  4. Have the DECC factored in the need to give ever higher levels of subsidies to meet renewables targets?

Kevin Marshall

Notes Labour’s Analysis of the Energy Market

Labour’s Green Paper on Energy has been found by Alex Cull (comment at Dec 2, 2013 at 1:03 PM) at the site “Your Britain“, in the Agenda 2015 section. Having read it, I can see why the Labour Party are not keen for the electorate to find the document. Some quick observations, that I believe are sufficient to show that Labour have not bottomed out the only, let alone the best, explanation of why retail prices have risen so fast in last few years. What this clearly shows is that Labour’s proposed policy freeze is not just misplaced; it is positively harmful to Britain having future low-cost and secure energy supplies.

Note 03/12/13: This post will be added to over the coming days.

Update 04/12/13: Note on declining investment in “clean energy”

Billions not Millions

The Executive Summary states

Lack of competition in the retail market has resulted in consumers paying £3.6m more than they need to each year.

Caption to Table 1 on page 7 states

Lack of competition in the retail market has resulted in consumers paying £3.6 billion more than they need to

Error in Calculation

The source of the £3.6bn is from Which?

The consumer group Which? found that 75 per cent of customers are on the most expensive tariffs offered by suppliers – their standard tariff – and are not getting the cheapest deal in the market. They estimate that since 2011, families across the country have paid £3.6 billion a year more than they need to as a result. That means that households are on average paying £136 each year because the retail market is not working in the way that a competitive market should. If this market was genuinely competitive, energy companies would face stronger incentives to drive their costs down and pass savings to consumers through lower prices and cheaper tariffs; but this is not happening.

That implies that

  1. In a perfectly competitive market, the single price would be the very cheapest rate available.
  2. As a consequence the big six energy companies are pocketing the difference.

So, there is a monopoly profit of greater than £3.6bn. Ofgem monitors the big six energy firms. The BBC reported on 25th November that

Overall, profits in generation and supply across the half-dozen firms fell from £3.9bn in 2011 to £3.7bn in 2012.

So the competitive market profit fell from £0.3bn to £0.1bn? I don’t think so. The price differential is due to competition working, not due to its’ failure. Like in many areas, if you shop around you can get a better deal than those who do not, as sellers will discount to win your business. If you do not shop around, you will get a bad deal. Look at insurance, hotel rooms, flights or even consumer goods. Reducing competition will cause profits will rise, and the savvy consumer will lose out. Regulate enough and even those who never haggle will not get a good deal.

Decline in those switching suppliers

…. a confusing system of 900 tariffs makes it hard for consumers to actively engage in this market. Since 2008, the number of people switching energy supplier has fallen by over 50 per cent, and switching levels are now at the lowest level on record. Low levels of switching means that the big energy companies have a ‘captured market’ which reduces the incentives to keep prices competitive.

Fig 1 shows a decline in number of people transferring between suppliers between year to year. This shows a decline from around … to …. Is this evidence of a decline?

All other things being equal, then it is evidence of declining competitiveness. But all other things are not equal. A supplier can take action to retain the business. There is passive action and non-passive action.

Passive action is when the customer tries to move away, or threatens to. They are can offered a better deal to retain the business.

Proactive action is to offer the customer a better deal. For instance, I moved supplier in 2012 on a 12 month contract. In July, just before the end of the deal, the supplier offered me their best deal. This I accepted, after a quick check.

A decline in transfers could therefore be due to suppliers taking action to retain custom. This saves on their costs, and consumer’s inconvenience, whilst keeping the market competitive. As the cost to energy companies is less, this can keep overall costs down.

A test of this is to look at the differential between the standard tariff and the competitive tariffs over time for each supplier. If that has widened over time in line with the decrease in those switching then the Labour Party are correct. If it has widened, I would be surprised given the increasing number and sophistication of the price comparison websites. It would be a failure both of government policy over many years and the market to respond to those incentives.

Differential between wholesale and retail prices

Figure 2 on page 11 is meant illustrate for the electricity and gas markets how the wholesale prices have stayed roughly the same, but the retail prices have widened. The graphic for the electricity market is shown below.

The explanation is as follows.

Wholesale energy prices have been relatively stable since the winter of 2011, rising by an average of 1 per cent a year. However, the large energy companies have increased energy prices by an average of 10.4 per cent a year over this period (Figure 3). This has led to a growing gap between wholesale and retail prices that cannot be explained by the growth in network costs or policy costs which account for 20 per cent and nine per cent of the bill respectively.

So the explanation is derived from the following logic

  1. Prices have risen by over 30% in the last 3 years.
  2. Wholesale prices form the biggest part of the cost to the consumer and have not moved very much.
  3. Other costs have grown, but now only account for 29% of the bill.
  4. By implication, the profits of the energy companies have increased at the expense of the consumer.

Let us first assume that the scales are comparable. The left hand scale is the wholesale cost in £/MWh. The right hand scale in the average annual retail cost per household. In 2010 the average household was paying about £430 for their electricity, compared with £550 in Jan-2013. The wholesale price component rose from around £280 to £310. So “other costs” rose by around £90. This is a huge increase in costs. With around 26 million households, this is around £2.4bn – well on the way to accounting for the £3.6bn claimed above. There is gas as well remember, so there could be an argument.

But what are the other costs?

These include

  1. Standing charges. The costs of operating the National Grid, and replacing meters in homes, along with subsidies for the poor.
  2. Renewables Obligations (RO) and Feed-in-tariffs (FIT). That is the subsidies that the owners of wind turbines and solar panels get over and above the wholesale price of electricity. For instance, operators of offshore wind turbines will get a similar amount in RO as from the market price.
  3. The small, but growing STOR scheme.
  4. The fixed costs of the retail operation. That is the staff to produce the bills, operate the call centres, along with the cost of a sales force to get you to switch.
  5. The net is the retail margin.

Let us assume that “network costs or policy costs” and policy costs doubled in three years as a proportion of the total electricity bill. That is from 14.5% to 29%. That would be £97 of the £90 increase in margin. This hypothetical example needs to be tested with actual data. However, the lack of the rise in profits is corroborated by OFGEM figures for the Big 6 Energy Companies, as I summarized out last week.

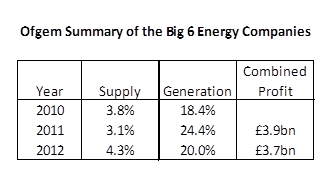
The margins on “supply” have not increased, and are still at the level of a discount supermarket. The margins on “generation” derive from selling at wholesale and the proceeds of the subsidies. Unless Labour are implying that the “Big 6” are guilty of false reporting to OFGEM, the vast majority of the increase in differential between wholesale cost and selling price is accounted for by factors other than profits to the energy companies. Labour are implying the vast majority of the increase in differential between wholesale cost and selling price is accounted for by the profits to the energy companies, and therefore misleading the electorate.

Interpretation of clean energy investment figures

Figure 4 is the following chart

The fall in investment, at a time when it should be accelerating, is a result of the policy environment and protracted decision-making by Government. The Government has been widely blamed for failing to provide the policy certainty needed to de-risk investment.

There is an alternative way to interpret this data. Labour lost the general election in May 2010. What might be more significant is the passage of the Climate Change Act 2008. In the next year investment was nearly 3 times higher, then falling each year since. The Climate Change Act 2008 greatly enhanced the incentives for “clean energy” investment, hence the leap. There are only a finite number of opportunities, so the investment is reducing year-on-year. This being despite the biggest source of revenue coming from index-linked subsidies loaded onto electricity bills. Another reason is that many in the industry saw problems with the technology, that are only now coming to light. In particular the lifespan of the turbines might be shorter than previously thought. Further, the opposition to the wind turbines (where most of the investment is concentrated) is increasing, such as against the proposed Atlantic Array that would have blighted the Bristol Channel. Campaigners are also increasingly concerned about noise pollution.

Therefore, I propose that declining investment is not due to Government spin doctors failing to sweet-talk big business, but due to the reality of “clean energy” turning out to fall far short of the sales patter.

NB First time comments are moderated. The comments can be used as a point of contact.

Kevin Marshall

Kent Wind Farm – A dead loss to society

The Kent wind farm subsidy is mostly a waste of money, even measured by UNIPCC’s case for taking drastic action on CO2.

First, two statements and a bit of data.

“… the Kent windfarm. £780m invested to chase £50 ROCs. Offshore is double bubble, so £100/MWh generated.” (Sep 25, 2010 at 1:41 AM | Atomic Hairdryer at BishopHill )

“An effective carbon-price signal could realise significant mitigation potential in all sectors. Modelling studies show global carbon prices rising to 20-80 US$/tCO2-eq by 2030 are consistent with stabilisation at around 550 ppm CO2-eq by 2100. For the same stabilisation level, induced technological change may lower these price ranges to 5-65 US$/tCO2-eq in 2030.” (P.18 UNIPCC Summary for Policymakers)

An alternative for a wind farm is a small power station consisting of diesel engines. The most modern diesel engines can produce less than 500kg of CO2 per MWh. (See note)

So the subsidy should be no more than the trading credit CO2 of 12.5-50 £/tCO2.

Based on these figures, it is possible to state that of the £100/MWh subsidy, at a very minimum £75 is a dead loss to society. At most it could at much as £95. This is before you undertake a present value calculation on the trading credits value in 2030, or start questioning the underlying economic assumptions. Further this is whilst accepting UNIPCC consensus position in its entirety.

For an alternative take, see Christopher Booker in the Telegraph

Note on CO2 output for a diesel power plant

A large container ship engine has around 470kg to 560kg of CO2 output per MW (emission comparison table on page 13), with around 58% engine efficiencies. (See a MAN Diesel & Turbo paper “How to influence CO2” – 5MB pdf). Power-plants can higher up to 90% more efficiencies by heat recovery processes, potentially cutting the CO2 out per MW to 350kg. However, this would need to be verified by actual measurements.

Note on carbon credits v Subsidies

A carbon credit aims at adding to the cost of producing CO2 directly, with the objective of encouraging the most cost-effective means of saving CO2. That is if cost saving is less than the cost of the credit, you purchase the credit. If it is greater, then you make the investment. For power plants it might be very effective for bringing forward investments in newer power plants. It would not be so effective in choosing between new power plants with massive differences in cost per unit of output.

The Myths of Green Jobs – from the Classical Economists and a Beancounter

The Adam Smith blog posts (here) on the seven myths of green jobs (by the Policy Network). They are useful as a criticism, but more fundamentally the classical economists gave a rebuttal over a century ago.

From Adam Smith, you get increased prosperity from division of labour. Localism reduces the division of labour, thus reduces the wealth of nations

From David Ricardo this is augmented with the idea of comparative advantage. Trading nations gain advantage by specialisation in areas where they have a comparative advantage. Green economics ignores this. (Mises applies this concept to the labour markets. Low productivity, green, jobs will be created at  the expense of high productivity, conventional jobs.)

From Alfred Marshall there is concept of opportunity costs. In evaluating a measure you should not only look at the benefits of a choice, but the alternatives forgone. Green jobs will be creating, but at the expense of conventional, higher productivity jobs along with higher taxes.

From Karl Marx, you should look at the distribution of the national pie. Green jobs will only be created by forcibly reducing non-green industries. This enforced tendency towards monopoly will increase the profits accruing to the bourgeoisie, at the expense of the working classes. Given that the rate of return on Capital has fallen dramatically over the past two decades, is the Green Movement just a puppet of a degenerate Capitalist Class?

But as a (slightly manic) Beancounter, the economist’s arguments pale into insignificance beside a project management issue. In a major project, if you have no dynamic concept of how to control and continually reduce costs, or a clear idea of how to achieve objectives, along with ridiculing of any questioning of the attainability of the objectives –  then you have a recipe for massive cost overruns, and benefits failing to be achieved on a massive scale.  In the UK, the NHS computer system, the Scottish Parliament and the New Deal for jobs were all massive policy failures for these reasons. But they all pale into insignificance beside the global attempt to stop global warming by reducing CO2 emissions. Not just the scale, but also the lack of clarity as well.

(Roger Pielke Jnr’s recent talk is instructive on the perspective here)

Labour’s aim to save £35bn

According to John Redwood, the Labour Government has plans to save £35bn a year. I posted the following comment.


 It is good news that the government is allowing for value for money as a consideration. But after twelve years of government, it is a bit late.

 A bit of quick beancounting might put this into perpective. If these are mostly savings they could have made earlier, and assuming they have always been a constant percentage of government spend, then labour’s delay has cost the  taxpayer around £325bn. If it has only built up since the spending hikes in 2001, the figure reduces to £150bn. However, for the government to admit this lower figure would be to admit that a large part of the spending increase was money down the drain.

 Another way of looking at the £35bn is to divide by the number of Labour MPs. It is nearly £100m per MP. As I have blogged before, this level makes the financial amounts of MPs expenses seem trivial.

 But even this annual £35bn only scratches the surface between the best value that can be theoretically achieved and the situation now. There is a lack of dynamism in government in changing service provision to the changing requirements; a lack of expertise in matching real individual (or local) needs to the money available; and a total lack of thought in relating costs to benefits for new initiatives. Add to the mix the strong interest groups in protecting the status quo, and many statutory encumbrances that add little value but a lot of grief, and you have the opportunity to spend a lot less, whilst improving the welfare of society as a whole.


To enlarge on why the scope for savings is much larger


1)      Much of the government services provided, whether education, health care or welfare payments are based upon a uniform specification. In education, there might be too much spent on some pupils, so that a very small minority will be missed out. The same goes for disability or housing benefit.

2)      Initiatives that flounder. Whether it is the drug addiction schemes that are less than 5% effective or the computer schemes that deliver many times over budget, years late and without the benefits specified.

3)      Lack of marginal analysis. A new initiative will look at the supposed benefits, but not the costs. For instance raising taxes on alcohol, tobacco and fuel may all have the desired results of reducing consumption, but the biggest impact is the reduction in living standards of those whose spend increases on these items. Last year I wrote extensively on the proposed congestion charge in Manchester. My major objection was the same issue. A low charge will be mostly absorbed by the motorists. Only a high charge will cause the majority to switch to public transport.

4)      Ignoring unintended consequences. The smoking ban in public places has triggered a massive decline in the number of pubs. The raiding of pension funds by Gordon Brown has contributed to the decline in final salary schemes. Avoiding recessions after the dot.com bubble burst in 2000 and after 9/11 mean that the boom was prolonged, causing greater grief when the boom finally ended. Doing “whatever it takes” to save the banking system, meant that the exchequer took on hundreds of billions liabilities that may result in massively increasing the National Debt.

5)      Ideological or political appearances. Whether it is “bobbies on the beat” or investing in renewables to meet climate change targets, costs are incurred for public relations, rather than to have any obvious effect. The excessive increases to doctors and nurses in recent years has added billions to the NHS wage bill.

6)      Lack of Expertise in cost negotiation. The government this month signed a £6.5bn PFI deal to widen 38 miles of the M25. In 2004 it was to be £4.6bn for 63 miles.


Another attempt at understanding cost control in government was here, where I applied the principals used in my weekly shopping to the issue.

Why have Petrol Prices not fallen in line with the price of Crude?

A colleague asked me why petrol (gasoline) prices in the UK have not fallen in line with the Crude Oil Price.

From the peak price of $145, crude oil is now around $45 per barrel, a fall of nearly 70%.

The prices we pay per litre of petrol has fallen only 25%


I did a quick calculation to show him that we have benefitted in full.

Pump Prices for Petrol (Gasoline)
£ Per Litre (Incl VAT) £ Per Litre (Excl VAT)
July 1.18 1.00
Dec 0.87 0.76
% Fall 26% 24%
£ change -0.31 -0.24
Crude Oil Price
$ per barrel £ per barrel £ Per Litre
July 145.00 72.50 0.35
Dec 45.00 30.00 0.14
% Fall 69% 59% 59%
£ change -0.20

The price at the pumps includes VAT (Value Added Tax). Until 1st December it was 17.5%, then reduced to 15%.

Since July the British pound has fallen from £1=£2 to £1=$1.50, partly offsetting the fall in the crude price.


 That the oil companies have had a small reduction in their margins. Extrapolating, if the cude oil price went to zero, the pump price would still be around £0.70p per litre (around $4 per US gallon). Most of this is due to taxation. This has increased by over 50% since the mid-1990s, when pump prices (with 17.5% VAT) fell below £0.50 per litre.


The margins of the oil companies may have reduced slightly, but are largely irrelvent to the calculation.