Understanding the US EIAs Levilized Cost of Electric Generation figures

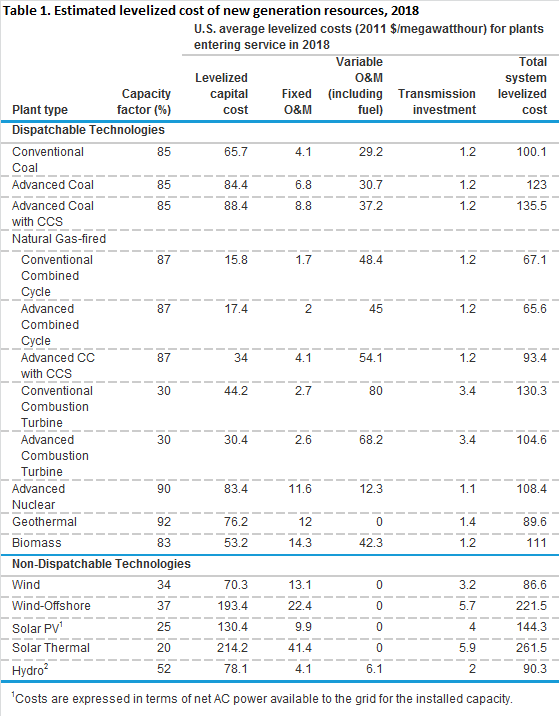
At Watts Up With That?, Willis Eschenbach has a post “The Levelized Cost of Electric Generation“. These are estimated figures by US Energy Information Agency (EIA) for the costs of power by fuel source, for plants with construction started now that would enter service in 2018. The full table from the EIA in $/MwH is reproduced as Table 1 below.

Willis makes the valid point that every unit of “non-dispatchable” power (i.e. renewables with no power on demand) capacity, there must be an equal amount of dispatchable power to back it up. He does not follow this up. Non-dispatchable power does not need to be fully-covered by the expensive high-efficiency fossil-fuelled power stations. The most extreme conditions of peak power demands but no wind can be met by diesel generators. These are relatively low capital cost, but with high unit costs of output. They still add to the costs of renewables, along with reducing the CO2 savings. In terms of the large scale fossil-fuelled power stations gas is clearly better than coal. Combined cycle gas has half the capital cost per unit as conventional coal so dropping the utilisation will have a much smaller impact on unit costs. Further it can be switched on or off much quicker than conventional coal. Combined the actual additional cost of renewables is lower than he implies.

As I have been looking into the subsidies that renewables receive in the UK, I would like to observations. To understand these comments in the context of Willis Eschenbach’s post please note:-

  • In the UK, all generated electricity is paid the wholesale price (approx $0.09 kwh at present).
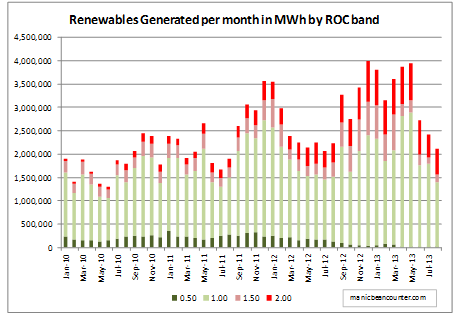
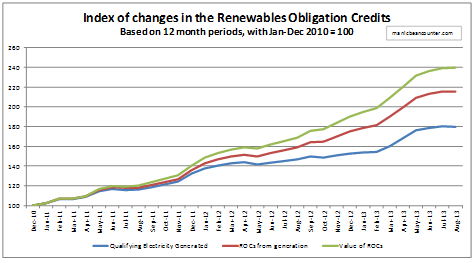
  • In addition renewables receive renewables obligation credits or ROCs. Biomass (wood pellets usually imported from USA) and onshore wind receive 1 ROC per megawatt hour. Offshore wind receives 2 ROCs. With a ROC worth $0.07 kwh (£42.02 MwH), onshore wind and biomass receives $0.16 kwh and offshore wind $0.23 kwh.
  • Currency conversion is at £1.00 = £1.66. Willis uses kilowatt hours for his simplified summary, whereas as the EIA uses megawatt hours.

Revenue is somewhat different to the costs, but there are a few observations possible.

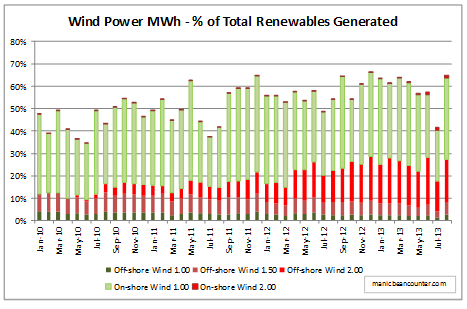
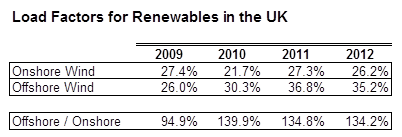
  1. Capacity utilisation for onshore wind is assumed at 34% and 37% for offshore. For the UK, actual average utilisation as 26% for onshore and 35% for offshore. On that basis, US costs for onshore wind would rise from $0.087 to $0.117 kwh. Here are the figures from the most recent four available years.

  2. Biomass in the UK consists of burning non-fossil fuels in existing coal-fired power stations. It is more expensive than coal because (a) fuel cost per tonne is more than coal and (b) output per tonne is slightly less than coal. I would want to know why the capital cost per kwh is 20% lower and why the variable costs are just 45% higher. On fuel costs alone the 0.2 ROCs per Mwh would be more than generous for biomass. Based on figures from April to August 2013, the full year subsidy saving of this change would be in the order of £300m or $500m per annum.
  3. The transmission investment is vastly understated. Like in the UK, the cost of transmission for a power station investor is likely in connecting the power station to the nearest point on the national grid, regardless of the capacity of the line. To obtain 34% efficiency, wind turbines need to be placed in highly exposed areas, such as hill-tops. Population centres, and established grid networks, tend to be on the plains, or in sheltered valleys. In the UK, the best locations for wind turbines are in the far North of Scotland. To effectively connect this to main grid means upgrading about 400 miles of transmission lines to enable around 5-10GW of power at peak generation. This capital cost could be as much as the wind turbines themselves. Fossil-fuelled power stations tend to be located near existing power stations. These in turn are near to the existing grid infrastructure. The upshot is that wind turbines have much higher transmission costs than fossil-fuelled power stations. The difference could be a number of cents per kilowatt hour.

Kevin Marshall

The Irony of Ironbridge

The traditional way of producing iron was in small batches, using charcoal as the fuel. In 1709 Abraham Darby I built the world’s first blast furnace fuelled by coke. This enabled a continuous process to be used for production, enabling much greater quantities to be produced. What is more, charcoal is derived from wood, which was by then becoming increasingly scarce in Britain. Coke comes from coal, of which there were increasingly plentiful supplies. The unit costs of iron production therefore came down for the reasons of increased productivity and a cheaper, more plentiful, energy source. Without this switch the industrial revolution would not have started. The reason for building the blast furnace in Coalbrookdale should be obvious.

Darby’s grandson Abraham Darby III used this cheap iron to build, in 1779 the world’s first bridge from fabricated from cast iron. The village by this bridge and the gorge encompassing Coalbrookdale are now known as Ironbridge. It is now a major tourist attraction.

There has been a coal-fired power station in the Ironbridge Gorge since the 1930s. The directions from the site of the original blast furnace are below. The original 200MW facility was replaced in 1969 and 1970 by the twin 500MW facilities seen today. In 2012, one of those facilities was modified to accept wooden pellets that are imported from North America. The will generate up to £100,000,000 a year in renewables obligation certificates, increasing the cost of the electricity to consumers by 75%.

Globally forests are still declining. Wood is a scarce resource and expensive, with the price only likely to increase. Known coal reserves are sufficient to supply current global requirements for centuries, is cheap and the price is falling. Ironbridge can now claim to both a birthplace of the industrial revolution, and a symbol of sending the benefits of the industrial revolution into reverse. Spot the irony.

The rising costs of the Renewables Obligation Certificate Scheme

Summary

The cost of Renewables Obligation Certificate scheme ROCs to covert the UK to renewable electricity has more than doubled in less than four years. Whilst the majority of this increase is down to volume increases and inflation, a significant part is down to switching to higher levels of subsidy, particularly for offshore wind farms. This means that the unit cost of electricity from renewables is rising. One wonders if the DECC has factored this into its projected costs of energy to households.

Main Analysis

In my previous posting “Labour’s Hypocrisy on Rising Energy Bills”, I identified that the rise in energy bills over the last few years was mostly due to rising costs external to the energy companies. I only briefly alluded to the causes. This posting looks at the growth in “Renewables Obligation Certificates” (ROCs), the major vehicle to encourage the energy industry to switch to renewables from fossil fuels. Working out the proportion of the “other cost” increases is difficult to work out, but it could be up to a half.

On the 19th December, the Department for Environment, Energy and Climate Change (DECC), issued a great rash of postings to its website. Amongst these of particular interest was “Energy trends section 6: renewables“. This contains a spreadsheet of interest – ET 6.3 “Renewables obligation: certificates and generation”. This gives monthly data covering the period January 2010 to August 2013.

Not all renewables are equal. Different types of renewables attract different ROC rates per MWh (megawatt-hour) of electricity generated. These vary from 0.25 to 5.00. In practice more than 99% of renewable power generated falls into four bands – 0.50, 1.00, 1.50 and 2.00.

Charting the electricity generated in megawatt hours for the period gives the following graph:-


In less than 4 years there has been a spectacular growth in total electricity generated from renewables, from around 1.5m MWh per month in early 2010, to over 3.0m in early 2013. But there has been even greater growth in the generation of renewables with 2.00 ROCs, and the disappearance of the 0.50 ROCs. This can be better seen by the proportions of generation in each of the ROC bands.


In early 2010, less than 5% of renewables generated qualified for 2 ROCs, whereas by 2013 over 20% did. To show the impact more clearly I have devised three indexes. These include all ROC bands for declarations on a monthly basis. (A very tiny number of schemes have annual declarations.)

  1. Renewable electricity generated qualifying for ROCs.
  2. Renewable Obligation Certificates issued.
  3. The buy-out value of the ROCs. This value is declared by the regulator OFGEM, and inflated each year by the Retail Prices Index. The 2013/14 declaration is here, with all the previous rates.

The index is for 12 month periods, with the period January to December 2010 set to 100.


From the period Jan-Dec 2010 to the period Sept 2012-Aug 2013, volume of renewables electricity generated increased by 80%; volume of ROCs by 116%; and value of ROCs by 140%.

There is a rapid growth in renewables, but the real cost per unit generated is increasing more rapidly. In buy-out values terms, the ROCs issued were worth £862m for Jan-Dec 2010 and £2,069m for Sept 2012-Aug 2013. But what type of renewable is responsible for this real cost per unit increase?

The Growth in Wind Turbine generation and ROCs

A major component of renewables has always been wind turbines, but the proportion is increasing. They are split between onshore and offshore. There are three graphs showing this increase.

  1. The proportion of renewables generated from Wind Turbines


    This shows that not only has the proportion of generation from wind turbines increased from around 40% to nearly 60%. More than 100% of the increased proportion is due to offshore wind turbines with 2.00 ROCs per MWh generated.

  2. Wind generated ROCs as a proportion of ROCs issued


    The share of total ROCS for wind turbines now accounts for over 60% of the total. Around 30% is from offshore wind turbines with 2.00 ROCs per MWh generated.

  3. Index of Changes in Renewables Obligation Credits for wind turbines.


From the period Jan-Dec 2010 to the period Sept 2012-Aug 2013, volume of renewables electricity generated increased by 134%; volume of ROCs by 177%; and value of ROCs by 209%. In buy-out values terms, the ROCs issued for wind turbines were worth £426m (49% of the total) for Jan-Dec 2010 and £1,315m (64% of the total) for Sept 2012-Aug 2013.

The true cost of offshore wind power

This analysis has solely concentrated on ET 6.3. The “Renewable electricity capacity and generation” (ET 6.1) file has some useful data on load factors. For wind turbines I have extracted the annual data.


Offshore wind turbines have around 35% higher load factors than onshore.

The vast majority of income for wind turbines is in two parts. There is the wholesale price at around £60 per MWh and the ROC income, which is £42 for onshore and £84 for offshore.

Per annum, with 35% more load, the offshore wind farm can expect about 90% more income per MWh of capacity than the onshore to cover capital and maintenance costs. It is even worse when compared with the gas-fired alternative. The only income for the generator is the £60 per MWh from selling wholesale, but they have the additional costs of at least £20 per MWh for fuel.

Biomass

An area not covered is the growth in the use of Biomass / other fuels at coal-fired power stations. This will be in a posting next year.

Questions on the subsidising of offshore wind turbines

  1. Given that prior to 2010 offshore wind farms were being commissioned with ROCs of 1.00 and 1.50, how much of this increased rate of 2.0 accommodates greater costs (more distant from the shore, and in deeper water) and how much gives greater profits?
  2. Given that a gas-fired power station can cover its operating and capital costs with less than £40 per MWh, should we be considering alternative, and less reliable, forms of electricity generation that seem to need up to four times the income to operate?
  3. Was any independent studies done of the costs of wind-generated power in setting the ROC rates, or was it just on the advice of the renewables industry and a DECC desperate to meet its carbon budget?
  4. Have the DECC factored in the need to give ever higher levels of subsidies to meet renewables targets?

Kevin Marshall