Summary
The cost of Renewables Obligation Certificate scheme ROCs to covert the UK to renewable electricity has more than doubled in less than four years. Whilst the majority of this increase is down to volume increases and inflation, a significant part is down to switching to higher levels of subsidy, particularly for offshore wind farms. This means that the unit cost of electricity from renewables is rising. One wonders if the DECC has factored this into its projected costs of energy to households.
Main Analysis
In my previous posting “Labour’s Hypocrisy on Rising Energy Bills”, I identified that the rise in energy bills over the last few years was mostly due to rising costs external to the energy companies. I only briefly alluded to the causes. This posting looks at the growth in “Renewables Obligation Certificates” (ROCs), the major vehicle to encourage the energy industry to switch to renewables from fossil fuels. Working out the proportion of the “other cost” increases is difficult to work out, but it could be up to a half.
On the 19th December, the Department for Environment, Energy and Climate Change (DECC), issued a great rash of postings to its website. Amongst these of particular interest was “Energy trends section 6: renewables“. This contains a spreadsheet of interest – ET 6.3 “Renewables obligation: certificates and generation”. This gives monthly data covering the period January 2010 to August 2013.
Not all renewables are equal. Different types of renewables attract different ROC rates per MWh (megawatt-hour) of electricity generated. These vary from 0.25 to 5.00. In practice more than 99% of renewable power generated falls into four bands – 0.50, 1.00, 1.50 and 2.00.
Charting the electricity generated in megawatt hours for the period gives the following graph:-
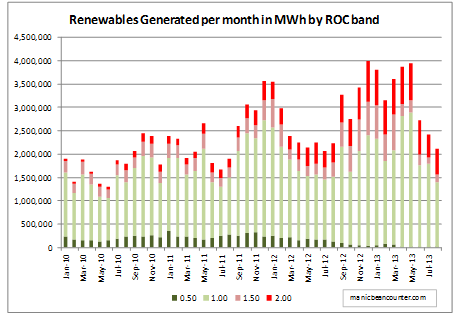
In less than 4 years there has been a spectacular growth in total electricity generated from renewables, from around 1.5m MWh per month in early 2010, to over 3.0m in early 2013. But there has been even greater growth in the generation of renewables with 2.00 ROCs, and the disappearance of the 0.50 ROCs. This can be better seen by the proportions of generation in each of the ROC bands.

In early 2010, less than 5% of renewables generated qualified for 2 ROCs, whereas by 2013 over 20% did. To show the impact more clearly I have devised three indexes. These include all ROC bands for declarations on a monthly basis. (A very tiny number of schemes have annual declarations.)
- Renewable electricity generated qualifying for ROCs.
- Renewable Obligation Certificates issued.
- The buy-out value of the ROCs. This value is declared by the regulator OFGEM, and inflated each year by the Retail Prices Index. The 2013/14 declaration is here, with all the previous rates.
The index is for 12 month periods, with the period January to December 2010 set to 100.
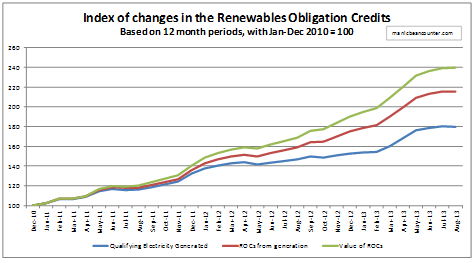
From the period Jan-Dec 2010 to the period Sept 2012-Aug 2013, volume of renewables electricity generated increased by 80%; volume of ROCs by 116%; and value of ROCs by 140%.
There is a rapid growth in renewables, but the real cost per unit generated is increasing more rapidly. In buy-out values terms, the ROCs issued were worth £862m for Jan-Dec 2010 and £2,069m for Sept 2012-Aug 2013. But what type of renewable is responsible for this real cost per unit increase?
The Growth in Wind Turbine generation and ROCs
A major component of renewables has always been wind turbines, but the proportion is increasing. They are split between onshore and offshore. There are three graphs showing this increase.
-
The proportion of renewables generated from Wind Turbines
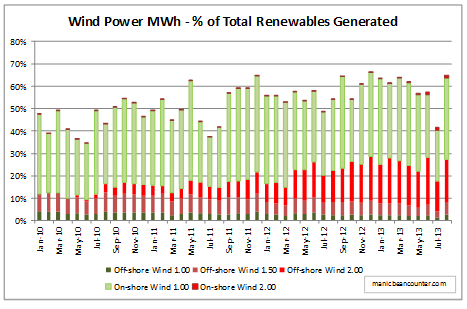
This shows that not only has the proportion of generation from wind turbines increased from around 40% to nearly 60%. More than 100% of the increased proportion is due to offshore wind turbines with 2.00 ROCs per MWh generated.
-
Wind generated ROCs as a proportion of ROCs issued

The share of total ROCS for wind turbines now accounts for over 60% of the total. Around 30% is from offshore wind turbines with 2.00 ROCs per MWh generated.
-
Index of Changes in Renewables Obligation Credits for wind turbines.

From the period Jan-Dec 2010 to the period Sept 2012-Aug 2013, volume of renewables electricity generated increased by 134%; volume of ROCs by 177%; and value of ROCs by 209%. In buy-out values terms, the ROCs issued for wind turbines were worth £426m (49% of the total) for Jan-Dec 2010 and £1,315m (64% of the total) for Sept 2012-Aug 2013.
The true cost of offshore wind power
This analysis has solely concentrated on ET 6.3. The “Renewable electricity capacity and generation” (ET 6.1) file has some useful data on load factors. For wind turbines I have extracted the annual data.
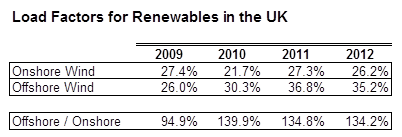
Offshore wind turbines have around 35% higher load factors than onshore.
The vast majority of income for wind turbines is in two parts. There is the wholesale price at around £60 per MWh and the ROC income, which is £42 for onshore and £84 for offshore.
Per annum, with 35% more load, the offshore wind farm can expect about 90% more income per MWh of capacity than the onshore to cover capital and maintenance costs. It is even worse when compared with the gas-fired alternative. The only income for the generator is the £60 per MWh from selling wholesale, but they have the additional costs of at least £20 per MWh for fuel.
Biomass
An area not covered is the growth in the use of Biomass / other fuels at coal-fired power stations. This will be in a posting next year.
Questions on the subsidising of offshore wind turbines
- Given that prior to 2010 offshore wind farms were being commissioned with ROCs of 1.00 and 1.50, how much of this increased rate of 2.0 accommodates greater costs (more distant from the shore, and in deeper water) and how much gives greater profits?
- Given that a gas-fired power station can cover its operating and capital costs with less than £40 per MWh, should we be considering alternative, and less reliable, forms of electricity generation that seem to need up to four times the income to operate?
- Was any independent studies done of the costs of wind-generated power in setting the ROC rates, or was it just on the advice of the renewables industry and a DECC desperate to meet its carbon budget?
- Have the DECC factored in the need to give ever higher levels of subsidies to meet renewables targets?