Macron calls for Climate Tariffs against most of the World

From the Independent (via Eric Worrall at WUWT)

In his speech, Mr Macron also called for an EU tariff on goods imported from countries or companies that do not share its climate goals, and pledged to work to raise the cost of carbon within the EU to €30 a tonne.

The EU INDC submission to COP21 Paris states

The EU and its Member States are committed to a binding target of an at
least 40% domestic reduction in greenhouse gas emissions by 2030
compared to 1990,

Most INDC submissions do not state they will reduce their greenhouse gas emissions. As a result, even if the proposals are fully met (and the EU is unlikely to meet its target) then emissions are forecast to be higher in 2030 than they are today. This graphic from the UNEP Emissions Gap Report published at the end of October demonstrates the situation quite nicely.

So President Macron is wanting sanctions not just against the USA, but most of the world as well? This includes China, India, nearly every African country,  most countries in SE Asia, the Middle East nations and some other nations besides. Or is it just those who stand up to the useless European climate policies, that are benefiting large businesses with subsidies financed disproportionately by the poor? The rhetoric includes “companies”, on whom sanctions cannot be applied. Further, the €30 carbon price is equivalent to €0.10 on the price of petrol (gasoline). How is a small rise in the cost of fossil fuel energy from a group of countries with less than 10% of GHG emissions going to save the world? As economics Professor Richard Tol has estimated, to achieve the targets would require a global carbon tax from 2020 of $210 and then escalated by 4-6% a year until fossil fuels were unaffordable. Chancellor Angela Merkel claims “Climate change is by far the most significant struggle of our time.” (Independent again). The falsity of this claim is shown by political newcomer President Macron’s trying to marginalize and silence opponents with empty and ineffectual threats.

Climate Necessity Defense for Minnesotan Valve Turners

Unlike the Michael Foster and other co-defendants is North Dakota, the Minnesotan Valve-Turners Emily Johnston and Annette Klapstein get their chance to present the Climate Necessity Defense. From TownHall.com (Hat tip Science Matters)

Klapstein, a retired lawyer, said they know of one case in which a judge allowed evidence about climate change but then told the jury to disregard it.

“It looks like we’re going to be able to bring in all our experts and present our evidence of how dire climate change is, so we’re pretty excited about that,” she said.

As a retired attorney, she perhaps should have read the criteria before responding.

In an order Friday, Clearwater County District Judge Robert Tiffany said the four defendants must clear a high legal bar.

In Minnesota, Tiffany wrote, a defendant asserting a necessity defense “must show that the harm that would have resulted from obeying the law would have significantly exceeded the harm actually caused by breaking the law, there was no legal alternative to breaking the law, the defendant was in danger of imminent physical harm, and there was a direct causal connection between breaking the law and preventing the harm.

The judge said it applies “only in emergency situations where the peril is instant, overwhelming, and leaves no alternative but the conduct in question.

This appears fairly clear. The Judge lays down four criteria to be met within an overriding one of emergency situations with no alternative. It is the legal equivalent of demanding that the positive impacts of an action greatly exceed the harms in very specific, very short-term, circumstances. Further, it is up to the defense to demonstrate that the circumstances apply, convincing the court in the face of cross-examinations.

There are a number of areas where I believe climate activists actions not only fails to meet these criteria, but does not even get anywhere close.

The timing issue

The emergency situations criteria are pretty immediate. An example is a police officer shooting dead a rampaging terrorist rather than maiming and performing an arrest. Another example might be destroying the car keys of someone who is drunk and intent on driving. The very short time scales of seconds or minutes exclude options that would take months or years to implement.  There are examples of where such an emergency situation does not apply to climate change policies.

If prominent climate activist Prince Charles was correct in saying in October 2009 that we have less than 100 months to save the planet, it would not have been considered an instant peril. With three months to go until the deadline, even that appears to be somewhat alarmist in the context of a lack of increase of signals of impending catastrophic consequences.

Another source is from the pinnacle of the climate establishment. The IPCC AR5 Synthesis Report gave a very rough guide to how much CO2 (or equivalent greenhouse gases) could be emitted to limit warming to less than 2°C. From 2012 it was about 1000 GtCO2e. This flowing is part of a presentation to summarize the IPCC AR5 Synthesis Report of 2014. Slide 33 of 35.

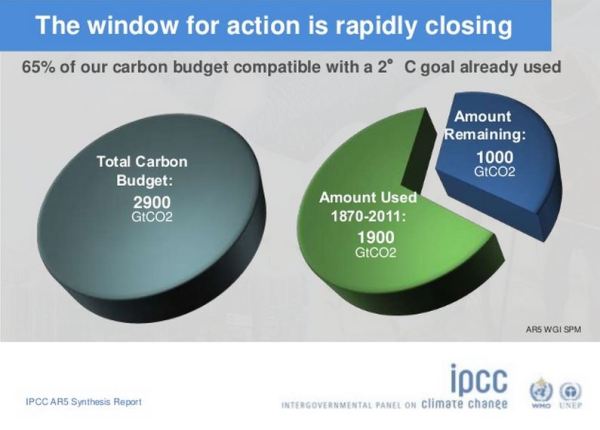
A more recent source is Miller et al 2017 Nature GeoScience. They estimate that 240 GtC (880 GtCO2e) from now will be needed to reach 1.5°C of warming. On the IPCC’s estimate then with slightly over 50GtCO2e of emissions per annum, the 2°C of warming would be reached sometime before 2032, when the climate experts are now saying the lower 1.5°C barrier will be reached sometime before 2035. Whichever you use as the barrier for breaching of dangerous climate change, that level will not be reached anytime soon according to the climate experts. There is plenty of time for a few more, tense, annual meetings with representatives of 195 nations to pontificate about mitigation policies.

So even if extreme climate alarmism is true, the expert opinion on policy strongly implies that the defendants were not “in danger of imminent physical harm”.

Finally, in 2008 the climate necessity defense was supported by James Hansen in a couple of British court cases. The detailed document prepared as written testimony for the Ratcliffe Nottingham trial is here and a 2011 commentary on the two cases by Hansen is here. As the supposed emergency in global emissions have not appeared in eight years between the testimony and the felony why should it be still considered a pressing problem? James Hansen, sometimes referred to as the Father of Climate Change after his 1988 Congressional Testimony pushed Global Warming to the fore of the political agenda, is likely to be the key witness in the necessity defence. He would have been the key witness at the trial of Micheal Foster in North Dakota last month if the necessity defense had been allowed. After the Foster Trial, Hansen wrote a long article, including arguments that will likely be presented at the Johnston and Klapstein Trail.

Indivisibility Issues

Many people in the United States believe that abortion is murder. Suppose a group managed to close down a busy abortion clinic by constant blockades and intimidation, throwing a number of people of work. An argument could be made that some of the women will not get abortions elsewhere, but will instead give birth to a child. The necessity defense criteria could, therefore, be operable. But with respect to global warming the evidence shows (and the science agrees) that it does not matter where in the world fossil fuels are burnt, the generated CO2 will be dispersed affecting the whole atmosphere. Otherwise, Eastern USA and Eastern China would have much higher concentrations of CO2 than in Africa, Antarctica or over the oceans that cover 70% of the earth’s surface.  Neither does that CO2 leave the atmosphere quickly but could remain in the atmosphere for many decades or even centuries. Therefore, the marginal impact delaying the transportation of one type of fossil fuel in one country for a few hours will have no significant impact on generations of people yet to come. As a rough estimate, the combined actions of the valve-turners (of which Micheal Foster on the Keystone Pipeline was by far the biggest contribution), was to delay the transportation of less than a million barrels of oil. That is to delay the transportation of around 1% of the daily global output of about 92 million barrels. A million barrels (140,000 tonnes) will produce around 400,000 tonnes of CO2. That is 0.4 million tonnes or 0.0004 billion tonnes. This 0.0004 GtCO2 is 0.00004% of the 1000 GtCO2e (million million) of emissions by the IPCC to breach the dangerous 2°C of warming barrier. The impact of Valve-Turners Emily Johnston and Annette Klapstein is somewhat less than this. The difference between “the harm that would have resulted from obeying the law” and “the harm actually caused by breaking the law” is infinitesimally small.

Local Harms, Wider Benefits

There is another set of harms to be considered.  That is the immediate costs of property damage and business disruption from the activists’ actions, along with the time and expense of law enforcement. Even if the action could be shown to have benefits exceeding the costs, for the actual persons or entities targeted that position will be reversed. So, hypothetically, if the benefits of stopping a few hundred thousand tonnes of emissions are even $100,000,000, and the immediate costs are just $1,000,000, the benefits are across the planet decades or centuries in the future and shared by tens of billions of people, whilst the costs are immediate and disproportionately borne by very few victims that the activists select. In reality, the benefits are likely far less, and the full costs somewhat more.

The catalyst effect of the action

As this was an act of climate activism, there was probably no intention that this act would stop climate change. Rather, that the act could serve as a catalyst for action to constrain emissions. It could serve as a wake-up call to policy-makers. A year later it is possible to see any impacts.

In the United States, less than a month after the valve turners did their deeds Donald Trump was elected President and subsequently has begun to rescind climate change policies. There appears to have been no impact on the Presidential elections. If it had, then criminal acts would have influenced the election, something that would have undermined the democratic process.

Another justification could be one of a catalyst for many more criminal actions. Again, there seems to be no surge in climate activism, whether through legal or illegal means does not seem to have happened. Further, lawyers might caution against using the catalyst argument in court to defend criminal acts.

So the catalyst defense (which may not be admissible under Judge Tiffany’s criteria) doesn’t seem to have worked out.

Non-exhaustion of legal policy initiatives

Judge Tiffany’s final specification was

leaves no alternative but the conduct in question.

Was there no alternative? There are two basic criteria necessary, but not sufficient, for the necessity defense to justify an otherwise illegal activity. First, that legal alternatives have been exhausted and second, that the illegal alternative has at least an expectation of being remotely effective. As already stated, the consensus believes that to prevent catastrophic climate change means permanently eliminating global greenhouse gas emissions. With respect to the burning of fossil fuels (about two-thirds of global GHG emissions), this is on the twin fronts of reducing global emissions to near zero and ensuring permanently leaving fossil fuels in the ground.

Possibilities for closing the policy gap

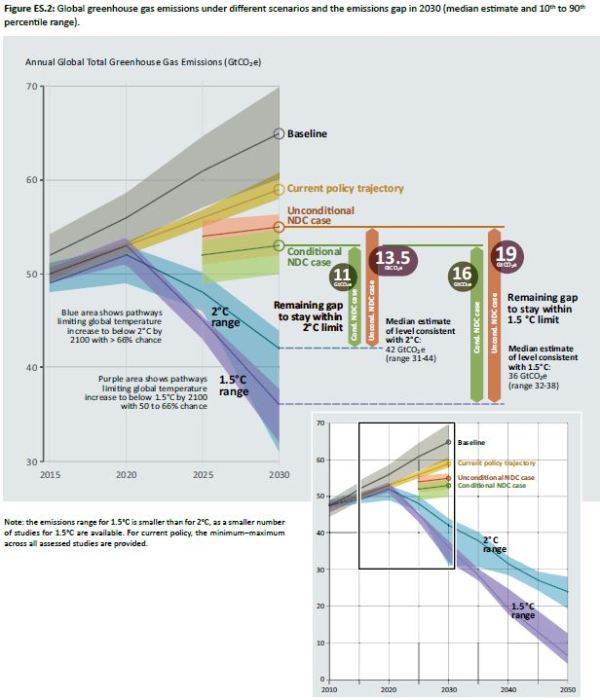
The global efforts to reduce global GHG emissions culminated in the Paris Agreement, written at the end of December 2015 and signed by most countries. The Adoption of the Paris Agreement proposal; Section II, Point 17 notes gives an indication of the gap between the aggregate impact of all the vague policy initiatives and the desired policy goal.

17. Notes with concern that the estimated aggregate greenhouse gas emission levels in 2025 and 2030 resulting from the intended nationally determined contributions do not fall within least-cost 2˚C scenarios but rather lead to a projected level of 55 gigatonnes in 2030, and also notes that much greater emission reduction efforts will be required than those associated with the intended nationally determined contributions in order to hold the increase in the global average temperature to below 2˚C above pre-industrial levels by reducing emissions to 40 gigatonnes or to 1.5˚C above pre-industrial levels by reducing to a level to be identified in the special report referred to in paragraph 21 below;

In a post last month I adapted a graphic produced by the UNFCCC in the run-up to Paris COP21 to show the gap between actual policy proposals and the Millar et al 2017 estimates to prevent 1.5˚C of warming being breached.

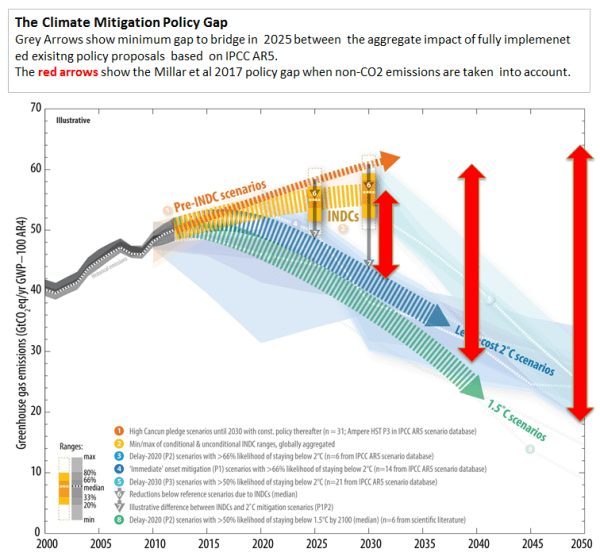
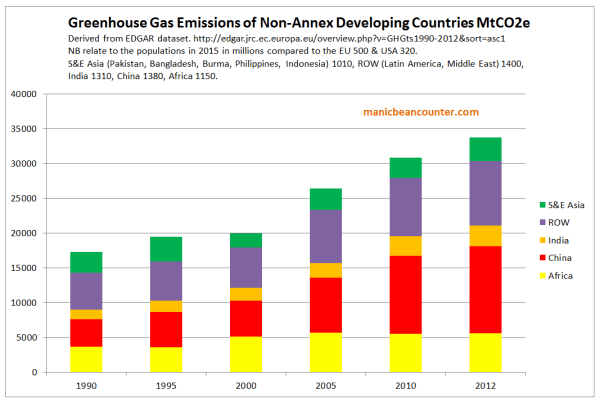
The aggregate impact of all policy ambitions if fully implemented fall a long way short of the targets. The majority is not due to the United States, or other Western Countries, failing to reduce emissions at a fast enough rate, but the developing countries increasing their emissions, rather than cutting emissions. When compared with  protests against President Trump’s policies (in a country with less than one-eighth of global emissions and a falling share of the total) there are no mass protests outside the embassies of Asian, Middle Eastern, African or South American countries, with over 80% if the global population and which collectively account for 100% of the growth in emissions between 1990 and 2012. Yet these countries have no expressed intention of reducing their emissions commensurate with the policy pathways. Criminal acts in the USA will do nothing to change this.

Leaving Fossil Fuels in the Ground

Arguments for targeting the output of Canadian tar sands include

(a) per unit of energy, it creates higher emissions than oil from say, Saudi Arabia.

(b) there are vast unproven reserves of oil in Canada that may exceed the current global proven reserves.

These aspects I will deal with in depth in a follow-up post. However, the two statements above are true. There are, however, wider policy aspects. Shutting down some of the global production of oil (and raising the price of oil) could increase the usage of coal instead. Push the price high enough and there will generate economic incentives to convert coal to liquids, a process that involves the generation of a number of times the CO2 emissions as from generating energy direct from oil alone.

The wider aspect is whether shutting down some proven reserves make available much less than the 1000 GtCO2e of emissions that would supposedly cause dangerous climate change. McGlade and Ekins 2015 (The geographical distribution of fossil fuels unused when limiting global warming to 2°C) estimate that the proven global reserves around 2900 GtCO2e. There is no clear breakdown by country, so I input their values of CO2 per unit into the BP’s estimates of global reserves of oil, gas and coal, coming up with a similar 2800 GtCO2e. These represent roughly 50 years of oil and gas supply and 120 years of coal supply at current usage rates. Taking into account other GHG emissions, to achieve the emissions target around 75% of proven reserves and 100% of any future discoveries must be left in the ground. I have produced a chart of the countries where these proven resources lie, measured in terms of CO2 produced from burning for energy.

McGlade and Ekins further estimate there are unproven but likely reserves of oil, gas and coal represent a further 8000 GtCO2e of emissions. Shutting down the Tar Sands permanently will not stop production of fossil fuels elsewhere in the world, particularly in the Middle East, Russia and other Asian countries.

Conclusion

There are a number of reasons that on their own ought to fail the necessity defense criteria laid down by Clearwater County District Judge Robert Tiffany last month. 

First, the climate experts at the UNIPCC, and the policy-promotors at the UNFCCC do not believe there is an imminent emergency. They estimate the threshold to dangerous climate change will not be crossed for over a decade.

Second, the cause of dangerous climate change is meant to the rise in global greenhouse levels, caused by global human greenhouse gas emissions. Shutting down fossil fuel emissions will not stop the harms in that area.

Third, the harms inflicted on the victims of the action are local, whereas any benefits in reduced emissions are global. But there is no evidence of the activists realizing this by campaigning for policy changes in other countries on anything like the level in the USA. The activist’s actions single out a particular source and are thus discriminatory.

Fourth, although the various actions on the same day stopped a vast amount of oil being moved, it was tiny in relation to oil the fossil being produced. Further, oil is only a minority source of all global greenhouse gas emissions.

Fifth, there is a large recognized global policy gap between forecast emissions if current policy proposals are fully enacted and the desired emissions pathways commensurate with 1.5°C or 2°C of warming. To meet these global pathways all countries must participate, but the evidence is that countries with over 80% of the global population have no expressed intention to get anywhere close to these policy criteria. Further, meeting the policy criteria would mean that the vast majority of proven reserves of fossil fuels are left in the group, along with any unproven reserves. Given the geographical dispersion of the proven reserves, this is not going to happen.

The principal theme that undermines the climate necessity defense is that the marginal impact of the action of shutting down a pipeline (or even a number of pipelines) is infinitesimally small compared to the required solution. For this reason, the necessity defense is still not valid even if (contrary to all the research to date) it can be proved beyond reasonable doubt that catastrophic climate changes will happen without rapid reductions in global emissions.

Kevin Marshall


The Policy Gap in Achieving the Emissions Goals

The Millar et al. 2017 has severe problems with the numbers, as my previous post suggested. But there is a more fundamental problem in achieving emissions goals. It is contained in the introductory paragraphs to an article lead author Richard Millar posted at Carbon Brief

The Paris Agreement set a long-term goal of limiting global warming to “well-below” 2C above pre-industrial levels and to pursue efforts to restrict it to 1.5C.

A key question for the upcoming rounds of the international climate negotiations, particularly when countries review their climate commitments next year, is exactly how fast would we have to cut emissions to reach these goals?

In a new paper, published in Nature Geoscience, we provide updated estimates of the remaining “carbon budget” for 1.5C. This is the total amount of CO2 emissions that we can still emit whilst limiting global average warming to 1.5C.

Our estimates suggest that we would have a remaining carbon budget equivalent to around 20 years at current emissions rates for a 2-in-3 chance of restricting end-of-century warming to below 1.5C.

This suggests that we have a little more breathing space than previously thought to achieve the 1.5C limit. However, although 1.5C is not yet a geophysical impossibility, it remains a very difficult policy challenge.

The problem is with the mixing of singular and plural statements. The third paragraph shows the problem.

In a new paper, published in Nature Geoscience, we provide updated estimates of the remaining “carbon budget” for 1.5C. This is the total amount of CO2 emissions that we can still emit whilst limiting global average warming to 1.5C.

In the first sentence, the collective “we” refers to the ten authors of the paper. That is Richard J. Millar, Jan S. Fuglestvedt, Pierre Friedlingstein, Joeri Rogelj, Michael J. Grubb, H. Damon Matthews, Ragnhild B. Skeie, Piers M. Forster, David J. Frame & Myles R. Allen.  In the second sentence, the collective “we” refers to approximately 7500 million people on the planet, who live about 195 countries. Do they speak for all the people in Russia, India, Nigeria, Iran, Iraq, China, Taiwan, North and South Korea, the United States and Australia for instance? What I would suggest is they are speaking figuratively about what they believe the world ought to be doing.

Yet the political realities are that even though most countries have signed the Paris Agreement, it does not commit them to a particular emissions pathway, nor to eliminate their emissions by a particular date. It only commits them to produce further INDC submissions every five years, along with attending meetings and making the right noises. Their INDC submissions are not scrutinized, still less sent back for “improved ambition” if they are inadequate in contributing to the aggregate global plan.

Looking at the substance of the Adoption proposal of the Paris Agreement, section II, point 17 notes gives an indication of the policy gap.

17. Notes with concern that the estimated aggregate greenhouse gas emission levels in 2025 and 2030 resulting from the intended nationally determined contributions do not fall within least-cost 2 ˚C scenarios but rather lead to a projected level of 55 gigatonnes in 2030, and also notes that much greater emission reduction efforts will be required than those associated with the intended nationally determined contributions in order to hold the increase in the global average temperature to below 2 ˚C above pre-industrial levels by reducing emissions to 40 gigatonnes or to 1.5 ˚C above pre-industrial levels by reducing to a level to be identified in the special report referred to in paragraph 21 below;

But the actual scale of the gap is best seen from the centerpiece graphic of the UNFCCC Synthesis report on the aggregate effect of INDCs, prepared in the run-up to COP21 Paris. Note that this website also has all the INDC submissions in three large Pdf files.

The graphic I have updated with estimates of the policy gap with my take on revised Millar et. al 2017 policy gaps shown by red arrows.

The extent of the arrows could be debated, but will not alter the fact that Millar et. al 2017 are assuming that by adjusting the figures and assuming that they are thinking for the whole world, that the emissions objectives will be achieved. The reality is that very few countries have committed to reducing their emissions by anything like an amount consistent with even a 2°C pathway. Further, that commitment is just until 2030, not for the 70 years beyond that. There is no legally-binding commitment in the Paris Agreement for a country to reduce emissions to zero sometime before the end of the century. Further, a number of countries (including Nigeria, Togo, Saudi Arabia, Turkmenistan, Iraq and Syria) have not signed the Paris Agreement – and the United States has given notification of coming out of the Agreement. Barring huge amounts of funding or some technological miracle most developing countries, with a majority of the world population, will go on increasing their emissions for decades. This includes most of the countries who were Non-Annex Developing Countries to the 1992 Rio Declaration. Collectively they accounted for just over 100% of the global GHG emissions growth between 1990 and  2012.

As some of these Countries’ INDC Submissions clearly state, most will not sacrifice economic growth and the expectations of their people’s for the unproven dogma of politicalized academic activists in completely different cultures say that the world ought to cut emissions. They will attend climate conferences and be seen to be on a world stage, then sign meaningless agreements afterward that commit them to nothing.

As a consequence, if catastrophic anthropogenic global warming is true (like the fairies at the bottom of the garden) and climate mitigation reduction targets are achieved, the catastrophic climate change will be only slightly less catastrophic and the most extreme climate mitigation countries will be a good deal poorer. The non-policy countries will the ones better off. It is the classic free-rider problem, which results in an underprovision of those goods or services. If AGW is somewhat milder, then even these countries will be no worse off.

This is what really irritates me. I live in Britain, where the Climate Change Act 2008 has probably the most ludicrous targets in the world. That Act was meant to lead the world on climate change. The then Environment Secretary David Miliband introduced the bill with this message in March 2007.

From the graphic above COP21 Paris showed that most of the world is not following Britain’s lead. But the “climate scientists” are so stuck in their manipulated models, they forget that their models and beliefs of their peers are not the realities of the wider world. The political realities mean that reduction of CO2 emissions are net harmful to the people of Britain, both now and for future generations of Britains. The activists are just as wilfully negligent in shutting down any independent review of policy as a pharmaceutical company who would push one of its products onto the consumers without an independent evaluation of both the benefits and potential side effects.

Kevin Marshall

Nature tacitly admits the IPCC AR5 was wrong on Global Warming

There has been a lot of comment on a recent paper at nature geoscience “Emission budgets and pathways consistent with limiting warming to 1.5C” (hereafter Millar et. al 2017)

When making a case for public policy I believe that something akin to a process of due diligence should be carried out on the claims. That is the justifications ought to be scrutinized to validate the claims. With Millar et. al 2017, there are a number of issues with the make-up of the claims that (a) warming of 1.5C or greater will be achieved without policy (b) constraining the emissions  

The baseline warming

The introduction states
Average temperatures for the 2010s are currently 0.87°C above 1861–80,

A similar quote from UNIPCC AR5 WG1 SPM page 5

The total increase between the average of the 1850–1900 period and the 2003–2012 period is 0.78 [0.72 to 0.85] °C, based on the single longest dataset available.

These figures are all from the HADCRUT4 dataset. There are three areas to account for the difference of 0.09°C. Mostly it is the shorter baseline period. Also, the last three years have been influenced by a powerful and natural El-Nino, along with the IPCC using an average of the last 10 years.

The warming in the pipeline

There are valid reasons for the authors differing from the IPCC’s methodology. They start with the emissions from 1870 (even though emissions estimates go back to 1850). Also, if there is no definite finish date, it is very difficult to calculate the warming impact to date. Consider first the full sentence quoted above.

Average temperatures for the 2010s are currently 0.87°C above 1861–80, which would rise to 0.93°C should they remain at 2015 levels for the remainder of the decade.

This implies that there is some warming to come through from the impact of the higher greenhouse gas levels. This seems to be a remarkably low and over a very short time period. Of course, not all the warming since the mid-nineteenth century is from anthropogenic greenhouse gas emissions. The anthropogenic element is just guesstimated. This is show in AR5 WG1 Ch10 Page 869

More than half of the observed increase in global mean surface temperature (GMST) from 1951 to 2010 is very likely due to the observed anthropogenic increase in greenhouse gas (GHG) concentrations.

It was after 1950 when the rate largest increase in CO2 levels was experienced. From 1870 to 1950, CO2 levels rose from around 290ppm to 310ppm or 7%. From 1950 to 2010, CO2 levels rose from around 310ppm to 387ppm or 25%. Add in other GHG gases and there the human-caused warming should be 3-4 times greater in the later period than the earlier one, whereas the warming in the later period was just over twice the amount. Therefore if there is just over a 90% chance (very likely in IPCC speak) of over 50% of the warming post-1950 was human-caused, a statistical test relating to a period more than twice as long would have a lower human-caused element of the warming as being statistically significant. Even then, I view the greater than 50% statistic as being deeply flawed. Especially when post-2000, when the rate of rise in CO2 levels accelerated, whilst the rise in average temperatures dramatically slowed. There are two things that this suggests. First, the impact could be explained by rising GHG emissions being a minor element in temperature rise, with natural factors both causing some of the warming in the 1976-1998 period, then reversing, causing cooling, in the last few years. Second is that there is a darn funny lagged response of rising GHGs (especially CO2) to rises in temperature. That is the amount of warming in the pipeline has increased dramatically. If either idea has any traction then the implied warming to come of just 0.06°is a false estimate. This needs to be elaborated.

Climate Sensitivity

If a doubling of CO2 leads to 3.00°C of warming (the assumption of the IPCC in their emissions calculations), then a rise in CO2 levels from 290ppm to 398 ppm (1870 to 2014) eventually gives 1.37°C of warming. With other GHGs this figure should be around 1.80°C. Half that warming has actually occurred, and some of that is natural. So there is well over 1.0°C still to emerge. It is too late to talk about constraining warming to 1.5°C as the cause of that warming has already occurred.

The implication from the paper in claiming that 0.94°C will result from human emissions in the period 1870-2014 is to reduce the climate sensitivity estimate to around 2.0°C for a doubling of CO2, if only CO2 is considered, or around 1.5°C for a doubling of CO2, if all GHGs are taken into account. (See below) Compare this to AR5 WG1 section D.2 Quantification of Climate System Responses

The equilibrium climate sensitivity quantifies the response of the climate system to constant radiative forcing on multicentury time scales. It is defined as the change in global mean surface temperature at equilibrium that is caused by a doubling of the atmospheric CO2 concentration. Equilibrium climate sensitivity is likely in the range 1.5°C to 4.5°C (high confidence), extremely unlikely less than 1°C (high confidence), and very unlikely greater than 6°C (medium confidence).

The equilibrium climate sensitivity ECS is at the very bottom of the IPCC’s range and equilibrium climate response is reached in 5-6 years instead of mutlicentury time scales. This on top of the implied assumption that there is no net natural warming between 1870 and 2015.

How much GHG emissions?

With respect to policy, as global warming is caused by human greenhouse gas emissions, to prevent further human-caused warming requires reducing, and possibly eliminating global greenhouse emissions. In conjunction with the publication of the AR5 Synthesis report, the IPCC produced a slide show of the policy case laid out in the three vast reports. It was effectively a short summary of a summary of the synthesis report. Approaching the policy climax at slide 30 of 35:-

Apart from the policy objective in AR5 was to limit warming from 2°C, not 1.5°C, it also mentions the need to constrain GHG emissions, not CO2 emissions. Then slide 33 gives the simple policy simplified position to achieve 2°C of warming.

To the end of 2011 1900 GTCO2e of GHGs was estimated to have been emitted, whilst the estimate is around 1000 GTCO2e could be emitted until the 2°C warming was reached.

The is the highly simplified version. At the other end of the scale, AR5 WG3 Ch6 p431 has a very large table in a very small font to consider a lot of the policy options. It is reproduced below, though the resolution is much poorer than the original.

Note 3 states

For comparison of the cumulative CO2 emissions estimates assessed here with those presented in WGI AR5, an amount of 515 [445 to 585] GtC (1890 [1630 to 2150] GtCO2), was already emitted by 2011 since 1870

The top line is for the 1.5°C of warming – the most ambitious policy aim. Of note:-

  • The CO2 equivalent concentration in 2100 (ppm CO2eq ) is 430-480ppm.
  • Cumulative CO2 emissions (GtCO2) from 2011 to 2100 is 630 to 1180.
  • CO2 concentration in 2100 is 390-435ppm.
  • Peak CO2 equivalent concentration is 465-530ppm. This is higher than the 2100 concentration and if for CO2 alone with ECS = 3 would eventually produce 2.0°C to 2.6°C of warming.
  • The Probability of Exceeding 1.5 °C in 2100 is 49-86%. They had to squeeze really hard to say that 1.5°C was more than 50% likely.

Compare the above to this from the abstract of Millar et. al 2017.

If COemissions are continuously adjusted over time to limit 2100 warming to 1.5C, with ambitious non-COmitigation, net future cumulativCOemissions are unlikely to prove less than 250 GtC and unlikely greater than 540 GtC. Hence, limiting warming to 1.5C is not yet a geophysical impossibility, but is likely to require delivery on strengthened pledges for 2030 followed by challengingly deep and rapid mitigation.

They use tonnes of carbon as the unit of measure as against CO2 equivalent. The conversion factor is 3.664, so cumulative CO2 emissions need to be 870-1010 GtCO2 range. As this is to the end of 2015, not 2011 as in the IPCC report, it will be different. Subtracting 150 from the IPCC reports figures would give a range of 480 to 1030. That is, Millar et. al 2017 have reduced the emissions range by 75% to the top end of the IPCC’s range. Given the IPCC considered a range of 1.5-1.7°C of warming, this seems somewhat odd to then say it related to the lower end of the warming band, until you take into account that ECS has been reduced. But then why curtail the range of emissions instead calculating your own? It appears that again the authors are trying to squeeze a result within existing constraints.

However, this does not take into account the much higher levels of peak CO2 equivalent concentrations in table 6.3. Peak CO2 concentrations are around 75-95ppm higher than in 2100. Compare this to the green line in the central graph in Millar et. al 2017. 

 This is less than 50ppm higher than in 2100. Further in 2100 Millar et. al 2017 has CO2 levels of around 500ppm as against a mid-point of 410 in AR5. CO2 rising from 290 to 410ppm with ECS = 3.0 produced 1.50°C of warming. CO2 rising from 290 to 410ppm with ECS = 2.0 produced 1.51°C of warming. Further, this does not include the warming impact of other GHGs. To squeeze into the 1.5°C band, the mid-century overshoot in Millar et. al 2017 is much less than in AR5. This might be required in the modeling assumptions due to the very short time assumed in reaching full equilibrium climate response.

Are the authors playing games?

The figures do not appear to stack up. But then they appear to be playing around with figures, indicated by a statement in the explanation of Figure 2

Like other simple climate models, this lacks an explicit physical link between oceanic heat and carbon uptake. It allows a global feedback between temperature and carbon uptake from the atmosphere, but no direct link with net deforestation. It also treats all forcing agents equally, in the sense that a single set of climate response parameters is used in for all forcing components, despite some evidence of component-specific responses. We do not, however, attempt to calibrate the model directly against observations, using it instead to explore the implications of ranges of uncertainty in emissions, and forcing and response derived directly from the IPCC-AR5, which are derived from multiple lines of evidence and, importantly, do not depend directly on the anomalously cool temperatures observed around 2010.

That is:-

  • The model does not consider an “explicit physical link between oceanic heat and carbon uptake.” The IPCC estimated that over 90% of heat accumulation since 1970 was in the oceans. If the oceans were to belch out some of this heat at a random point in the future the 1.5°C limit will be exceeded.
  • No attempt has been made to “calibrate the model directly against observations”. Therefore there is no attempt to properly reconcile beliefs to the real world.
  • The “multiple lines of evidence” in IPCC-AR5 does not include a glaring anomaly that potentially falsifies the theory and therefore any “need” for policy at all. That is the divergence in actual temperatures trends from theory in this century.

Conclusions

The authors of Millar et. al 2017 have pushed out the boundaries to continue to support climate mitigation policies. To justify constraining emissions sufficient stop 1.5°C of warming the authors would appear to have

  • Assumed that all the warming since 1870 is caused by anthropogenic GHG emissions when there is not even a valid statistical test that confirms even half the warming was from this source.
  • Largely ignored any hidden heat or other long-term response to rises in GHGs.
  • Ignored the divergence between model predictions and actual temperature anomalies since around the turn of the century. This has two consequences. First, the evidence appears to strongly contradict the belief that humans are a major source of global warming and by implication dangerous climate change. Second, if it does not contradict the theory, suggests the amount of warming in the pipeline consequential on human GHG emissions has massively increased. Thus the 1.5°C warming could be breached anyway.
  • Made ECS as low as possible in the long-standing 1.5°C to 4.5°C range. Even assuming ECS is at the mid-point of the range for policy (as the IPCC has done in all its reports) means that warming will breach the 1.5°C level without any further emissions. 

The authors live in their closed academic world of models and shared beliefs. Yet the paper is being used for the continued support of mitigation policy that is both failing to get anywhere close to achieving the objectives and is massively net harmful in any countries that apply it, whether financially or politically.

Kevin Marshall

Commentary at Cliscep, Jo Nova, Daily Caller, Independent, The GWPF

Update 25/09/17 to improve formatting.

New EU Vacuum Cleaner Regulations likely promoted with false claims

Summary

On September 1st, the EU Commission launched new regulations limiting the maximum power of vacuum cleaners to 900 watts.  A news item claimed

The updated rules will result in vacuum cleaners that use less energy for a better cleaning performance. This will help consumers to save money, as switching to a more efficient product can save €70 over its lifetime.

Elsewhere the is a claim that “with more efficient vacuum cleaners, Europe as a whole can save up to 20 TWh of electricity per year by 2020.

There is no reference to the source of the claims. Pulling in data from various sources I have calculated how the figures may have been derived. Based on these figures it would appear

  • The assumed savings are 200 kWh per vacuum cleaner, based on switching from a 1600 watts to a 900 watts, and 290 hours of use over the average lifetime.
  • This ignores that many vacuum cleaners are below 1600 watts due competition, not rules in place.
  • Cost savings are based on the average electricity costs in the EU, when in reality electricity costs in the most expensive country are 2.6 times that of the cheapest.
  •  Cost savings are not net of cost increases, such as more time spent cleaning and increase costs of the appliance.
  • Claims of reduction in electricity consumption are based on the requirement that all 350 million vacuum cleaners of 1600 watts are replaced by 900 watt cleaners by the start of 2020.

If any business made bald unsubstantiated claims about a new product, it would be required to back up the claims or withdraw them. Morally, I believe the EU Commission should aspire to emulate the standards that it imposes on others in marketing its own products. A law making Authority cannot be regulated and brought to account for the harms it causes. But I feel that it owes its citizens a moral duty of care to serve them, by minimizing the harms that it can cause and maximising the benefits.

The Launch of the New Regulations

BBC had an article on September 1st Sales of inefficient vacuum cleaners banned

They state

The EU’s own website says: “With more efficient vacuum cleaners, Europe as a whole can save up to 20 TWh of electricity per year by 2020.

“This is equivalent to the annual household electricity consumption of Belgium.

“It also means over 6 million tonnes of CO2 will not be emitted – about the annual emissions of eight medium-sized power plants.”

Although the BBC do not link to the webpage among millions. A search on the phrase reveals the following link.

http://ec.europa.eu/energy/en/topics/energy-efficiency/energy-efficient-products/vacuum-cleaners

Vacuum cleaners are subject to EU energy labelling and ecodesign requirements. By switching to one of the most energy efficient vacuum cleaners, you can save €70 over the lifetime of the product.  With more efficient vacuum cleaners, Europe as a whole can save up to 20 TWh of electricity per year by 2020. This is equivalent to the annual household electricity consumption of Belgium. It also means over 6 million tonnes of CO2 will not be emitted – about the annual emissions of eight medium-sized power plants.

There are no references to where the figures come from.

Another source is much nearer in the menu tree to the EU homepage and is on a news page.

http://ec.europa.eu/energy/en/news/updated-energy-efficiency-rules-vacuum-cleaners-will-save-consumers-money

Updated energy efficiency rules for vacuum cleaners will save consumers money

Friday, 01 September 2017

From today, vacuum cleaners sold in Europe will be more cost- and energy-efficient. The European Commission is making use of the latest state-of-the-art technologies to ensure that European consumers have the most energy efficient products available. The updated ecodesign requirements will lower appliances’ maximum power, annual energy consumption and noise levels. They will also increase their minimum ability to pick up dust.

The updated rules will result in vacuum cleaners that use less energy for a better cleaning performance. This will help consumers to save money, as switching to a more efficient product can save €70 over its lifetime. With more efficient vacuum cleaners, Europe as a whole will be in a position to save up to 20 TWh of electricity per year by 2020.

Like with the first EU source (which this press release links backed to) there is no reference to the source of the claims.

Establishing the calculations behind the claims

However, there the claims that together with other data and some assumptions have enabled me to piece together the numbers behind the claims. These are:-

  1. The maximum of 20 TWh of electricity that could be saved by 2020. There are one billion kilowatt hours in a terawatt hour.
  2. According to Eurostat’s Household Composition Statistics, there are 495.6 million EU citizens living in households, with an average 2.3 persons per household. That is around 215 million or maybe 210 million households.
  3. There is more than one vacuum cleaner in the average household.
  4. All vacuum cleaners are operated at maximum power all the time.
  5. All current vacuum cleaners are 1600 watts. By 2020 they will all be at 900 watts.
  6. Life of the average vacuum cleaner is five years. This I worked out from slotting in other variables.


To understand how many kilowatt hours in the maximum cost saving of €70, one needs to know the cost of a unit of electricity. In a recent post on electricity prices in South Australia, Joanne Nova provided a graphic based on data from MARKINTELL, US Energy Information Administration. Based on this I have produced a graphic showing that if Denmark, where electricity is most expensive, a person saved €70 on their electricity bill, the savings in most of the other EU countries.

If the Danes will save €70 from buying a vacuum cleaner under the new regulations, in the UK the saving will be about €49, France €39 and in Hungary and Estonia just €27. This is because of the huge difference in electricity costs, with Danish electricity being 2.6 times that in Hungary and Estonia. It is a simple step to work out the number of kilowatt hours of electricity saved for a spend of €70.  Assuming $1.00 = €0.85, the next graph shows how many units of electricity will be saved in each country.

If the EU Commission had properly checked its figures, when quoting the maximum saving, will base it on the highest electricity rates in the EU, and not the average rates. They will, therefore, assume that the maximum savings for the EU will be around 133 kilowatt hours and not 200 kilowatt hours. Otherwise, the maximum savings in Denmark, Germany, Italy and Portugal could be greater than the claimed maximum, whilst people in some other countries with lower than average electricity costs will be misled as to the extent of the possible savings.

I have put together a table that fits the assumptions and known variables based on €70 of savings in both Denmark and the fictional EU average.

The 200 kWh saving over a five-year vacuum cleaner life seems more reasonable than 133 kWh. The 350 million vacuum cleaners in the EU or two for every three people, seems more reasonable than 538 million, which is both less of a rounded estimate and would mean around 35 million more vacuum cleaners than people. The assumption that the average household spends 1 hour and 50 minutes per week vacuuming might be a bit high, but there again I know of people who regularly exceed this amount by quite a margin.

Based on how the numbers fit the maximum saving of €70 per vacuum cleaner to have been based on the average cost of electricity in the EU. As such it is an incorrect statement. There are other issues that arise.

Evaluating the claims

There are other issues that arise from consideration of these figures, though are not necessarily solely reliant upon those figures.

First, the 26TW of savings is if all the current vacuum cleaners (assumed to be at 1600W rating) will be replaced by the start of 2020. That is in just 2.33 years. If vacuum cleaners have an average five-year life, many people will be scrapping their existing vacuum cleaners before the end of their useful life. Even with a maximum marginal cost saving of €14 a year, this would mean incurring unnecessary additional costs and throwing out perfectly serviceable vacuum cleaners. However, if they replace a 2000 watt or higher vacuum cleaner purchased prior to September 2014, then the savings will be much higher. In which case the EU Commission News item should have noted that some savings were from regulations already in place.

Second is that many households have an old vacuum cleaner in reserve. They may have it for a number of reasons, such as having upgraded in the past, or purchased it prior to the regulations came into force in 2014. So when their main vacuum cleaner finally keels over, they will not purchase a low powered one. It will be therefore very many years before anything approaching 100% of existing vacuum cleaners have been replaced, especially if the perception is that the newer products are inferior.

Third, is an assumption that every vacuum cleaner is on the limit of the regulations. Greater efficiency (saving money) is something people are willing to pay for, so the market provides this anyway without the need for regulation, just as people pay for more fuel efficient cars. It is only the people who max out on the power permitted that will be affected to the full extent. As greater power is a cheap way of increasing performance, this will most affect the cheapest cleaners. The poor and those setting up a home for the first time (with severe budget constraints) are likely to be those most disadvantaged, whilst those who are willing and able to upgrade to the latest gadgets will make the lowest savings.

Fourth, the cost savings appear to be only on electricity costs. The extra costs of upgrading to a more technologically advanced machine that compensates for the loss of power, does not appear to have been taken into account in the calculations. If it had, then the electricity savings would have to be much greater, to include the additional costs. In which case, the fictional European average household would have to be saving far more on their electricity than €70. Let us say people upgrade from a €100 to €300 machine, both with a five year average life. To make €70 of savings over five years a Danish household would have to be running their vacuum cleaner for nearly three hours a week, a British or Dutch household over four hours per week, and the Hungarian and Estonian households over seven hours a week. But this defies other assumptions and would also shorten the average life of a vacuum cleaner. No allowance appears to have been made for more expensive vacuum cleaners.

Fifth, there are other, simpler ways of replacing the loss of suction from lack of power than technological wizardry that pushes up costs. The simplest is to reduce the area in contact with the floor. This means that people spend more time using the machines, offsetting some of the energy savings. Alternatively, there could be some loss of suction, which again means people spend more time cleaning, and getting frustrated due to the lack of performance. Some of this could be by more frequent swapping of cleaning heads. If you value people’s leisure time at just €5.00 an hour, then over the short five year life of a cleaner (about 290 hours based on 65 minutes a week of use), the average household will “lose” the €70 of electricity savings if they have to spend more than 5% more time cleaning. In reality it will be much more, and many people will feel aggrieved at having a less efficient machine.

Sixth is that the extra power can be used for simpler, proven and more robust technologies. Efficiency savings come about through complex optimisation strategies, reducing the life of cleaners.

So the claim by the EU that people will save money from the new regulations seems to be false for any one of a number of reasons. More likely than not people will be made net worse off by the regulations. Further the alleged benefits from the new regulations in terms of savings in electricity (and hence CO2 emissions) seems to have been grossly exaggerated.

But won’t there be a massive saving in CO2 emissions?  Even if the 6 million tonnes of emissions saved is in the more distant future, it is still a far large number. In terms of a small country like Belgium, it is a large amount. But considered in the context of EU’s INDC submission to the Paris climate talks it is quite small.

The EU and its Member States are committed to a binding target of an at least 40% domestic reduction in greenhouse gases emissions by 2030 compared to 1990,

From the accompanying country brief, the 1990 emissions were 5368 mtCO2e, so a 40% cut is 2147 mtCO2e. In 2012 emissions were 4241 mtCO2e (mostly for non-policy reasons) so there is just 1020 million tonnes to cut. 6 million is just 0.6% of that target.

On a global perspective, even with all the vague policy proposals fully enacted, global emissions by 2030 will be nearly 60,000 MtCO2e and will still be rising. There seems no prospect of additional policies being proposed that would start reducing global emissions. A policy that makes around 0.01% of the difference to the larger picture is inconsequential. To achieve the policy goals a few thousand similar-sized schemes are required. Nothing like that is going to happen. Countries in the developing world, with over half the global population, will see emissions will grow for decades, dwarfing any reductions made in the EU.

Concluding comments

The new vacuum cleaner regulations appear to be justified on the basis of grossly exaggerated and untenable claims of the benefits in terms of cost savings and reductions in GHG emissions, whilst ignoring the costs that they impose.

If any business made bald unsubstantiated claims about a new product, it would be required to back up the claims or withdraw them. If such sweeping claims were made about a new product such as anti-aging creams or vitamin pills, that could be attributed to other factors, then it would be prosecuted. Morally, I believe the EU Commission should aspire to emulate the standards that it imposes on others in marketing its own products. A law making Authority cannot be regulated and brought to account for the harms it causes. But I feel that it owes its citizens a moral duty of care to serve them, by minimizing the harms that it can cause and maximising the benefits.

Kevin Marshall


Time will run out to prevent 2°C warming barrier being breached

I have a number of times referred to a graphic “Figure 2 Summary of Results” produced by the UNFCCC for the Paris COP21 Climate Conference in December 2015. It was a centerpiece of the UNFCCC Synthesis report on the aggregate effect of INDCs.

The updated graphic (listed as Figure 2, below the Main Document pdf) is below

This shows in yellow the impact of the INDC submissions covering the period 2015 to 2030) if fully implemented against limiting warming to 2°C  and 1.5°C . This showed the gulf between the vague policy reality and the targets. Simply put, the net result of the INDCs submissions would insufficient for global emissions to peal Yet in reaching an “agreement” the representatives of the entire world collectively put off recognizing that gulf.

For the launch of the UNIPCC AR5 synthesis report in 2014, there were produced a set of slides to briefly illustrate the policy problem. This is slide 20 of 35, showing the  reduction pathways.


The 2°C  of warming central estimate is based upon total GHG emissions in the 21st Century being around 2500 GtCO2e.

At the launch of 2006 Stern Review Sir Nicholas Stern did a short Powerpoint presentation. Slide 4 of the PDF file is below.


The 450ppm CO2e emissions pathway is commensurate with 2°C  of warming. This is based upon total GHG emissions in the 21st Century being around 2000 GtCO2e, with the other 500 GtCO2e presumably coming in the 22nd Century.

The UNFCCC Paris graphic is also based on 2500 GtCO2e it is also possible to calculate the emissions reduction pathway if we assume (a) All INDC commitments are met (b) Forecasts are correct (c) no additional mitigation policies are enacted.

I have produced a basic graph showing the three different scenarios.

The Stern Review assumed global mitigation policy would be enacted around 2010. Cumulative 21st Century emissions would then have been around 450 GtCO2e. With 500 GtCO2e allowed for post 2100, this gave average emissions of around 17 GtCO2e per annum for the rest of the century. 17 GtCO2e, is just under 40% of the emissions in the year the policy would be enacted.

IPCC AR5  assumed global mitigation policy would be enacted around 2020. Cumulative 21st Century emissions would then have been around 950 GtCO2e. A presentation to launch the Synthesis Report rounded this to 1000 GtCO2e as shown in slide 33 of 35.

Assuming that global emissions were brought to zero by the end of the century, this gave average emissions of 20 GtCO2e per annum for the rest of the century. 20 GtCO2e, is just under 40% of the emissions in the year the theoretical global policy would be enacted. The stronger assumption of global emissions being reduced to zero before the end of the century, along with a bit of rounding, offsets the delay.

If the Paris Agreement had been fully implemented, then by 2030 cumulative 21st Century emissions would have around 1500 GtCO2e, leaving average emissions of around 14 GtCO2e per annum for the rest of the century. 17 GtCO2e, is just over 25% of the emissions in the year the policy would be enacted. The failure of the Paris Agreement makes it necessary for true global mitigation policies, if in place by 2030, to be far more drastic that those of just a few years before to achieve the same target.

But the Paris Agreement will not be fully implemented. As Manhatten Contrarian (hattip The GWPF) states, the US was the only major country proposing to reduce its emissions. It looks like China, India, Indonesia, Russia and Germany will all increase their emissions. Further, there is no indication that most countries have any intention of drastically reduce their emissions. To pretend otherwise is to ignore a truism, what I will term the First Law of Climate Mitigation

To reduce global greenhouse gas emissions, the aggregate reduction in countries that reduce their emissions must be greater than aggregate increase in emissions in all other countries.

Modeled projections and targets are rendered meaningless if this truism is ignored. Yet this is what the proposers of climate mitigation policy have been effectively doing for many years. Emissions will therefore breach the mythical 2°C warming barrier, but based on recent data I believe warming will be nowhere near that level.

Kevin Marshall


Joe Romm eco-fanaticism shown in Sea-Level Rise claims

The previous post was quite long and involved. But to see why Jo Romm is so out of order in criticizing President Trump’s withdrawal from the Paris Climate Agreement, one only has to examine the sub-heading of his rant  Trump falsely claims Paris deal has a minimal impact on warming. –

It may be time to sell your coastal property.

This follows with a graphic of Florida.

This implies that people in Southern Florida should take in account a 6 metre (236 inch) rise in sea levels as a result of President Trump’s decision. Does this implied claim stack up. As in the previous post, let us take a look at Climate Interactive’s data.

Without policy, Climate Interactive forecast that US emissions without policy will be 14.44 GtCO2e, just over 10% of global GHG emissions, and up from 6.8 GtCO2e in 2010. At most, even on CIs flawed reasoning, global emissions will be just 7% lower in 2100 with US policy. In the real world, the expensive job-destroying policy of the US will make global emissions around 1% lower even under the implausible assumption that the country were to extend the policy through to the end of the century. That would be a tiny fraction of one degree lower, even making a further assumption that a doubling of CO2 levels causes 3C of warming (an assumption contradicted by recent evidence). Now it could be that every other country will follow suit, and abandon all climate mitigation policies. This would be a unlikely scenario, given that I have not sensed a great enthusiasm for other countries to follow the lead of the current Leader of the Free World. But even if that did happen, the previous post showed that current policies do not amount to very much difference in emissions. Yet let us engage on a flight of fancy and assume for the moment that President Trump abandoning the Paris Climate Agreement will (a) make the difference between 1.5C of warming, with negligable sea-level rise and 4.2C of warming with the full impact of sea-level rise being felt (b) 5% of that rise. What difference will this make to sea-level rise?

The Miami-Dade Climate Change website has a report from The Sea Level Rise Task Force that I examined last November. Figure 1 of that report gives projections of sea-level rise assuming the no global climate policy.

Taking the most extreme NOAA projection it will be around the end of next century before sea-levels rose by 6 metres. Under the IPCC AR5 median estimates – and this is meant to be the Climate Bible for policy-makers – it would be hundreds of years before that sea-level rise would be achieved. Let us assume that the time horizon of any adult thinking of buying a property, is through to 2060, 42 years from now. The NOAA projection is 30 inches (0.76 metres) for the full difference in sea-level rise, or 1.5 inches (0.04 metres) for the slightly more realistic estimate. Using the mainstream IPCC AR5 median estimate, sea-level rise is 11 inches (0.28 metres) for the full difference in sea-level rise, or 0.6 inches (0.01 metres) for the slightly more realistic estimate. The real world evidence suggests that even these tiny projected sea level rises are exaggerated. Sea tide gauges around Florida have failed to show an acceleration in the rate of sea level rise. For example this from NOAA for Key West.

2.37mm/year is 9 inches a century. Even this might be an exaggeration, as in Miami itself, where the recorded increase is 2.45mm/year, the land is estimated to be sinking at 0.53mm/year.

Concluding Comments

If people based their evidence on the real world, President Trump pulling out of the Paris Climate Agreement will make somewhere between zero and an imperceptible difference to sea-level rise. If they base their assumptions on mainstream climate models, the difference is still imperceptible. But those with the biggest influence on policy are more influenced by the crazy alarmists like Joe Romm. The real worry should be that many policy-makers State level will be encouraged to waste even more money on unnecessary flood defenses, and could effectively make low-lying properties near worthless by planning blight when there is no real risk.

Kevin Marshall


Joe Romm inadvertently exposes why Paris Climate Agreement aims are unachievable

Summary

Joe Romm promotes a myth that the Paris Climate Agreement will make a huge difference to future greenhouse gas emissions. Below I show how the modelled impact of think tank Climate Interactive conclusion of a large difference is based on emissions forecasts of implausible large emissions growth in policy countries, and low emissions growth in the non-policy developing countries.


In the previous post I looked at how blogger Joe Romm falsely rebutted a claim that President Donald Trump had made that the Paris climate deal would only reduce only reduce future warming in 2100 by a mere 0.2°C. Romm was wrong on two fronts. He first did not check the data behind his assertions and second,  in comparing two papers by the same organisation he did not actually read the explanation in the later paper on how it differed from the first. In this post I look at how he has swallowed whole the fiction of bogus forecasts, that means the mere act of world leaders signing a bit of paper leads to huge changes in forecast emissions.

In his post  Trump falsely claims Paris deal has a minimal impact on warming, Romm states

In a speech from the White House Rose Garden filled with thorny lies and misleading statements, one pricks the most: Trump claimed that the Paris climate deal would only reduce future warming in 2100 by a mere 0.2°C. White House talking points further assert that “according to researchers at MIT, if all member nations met their obligations, the impact on the climate would be negligible… less than .2 degrees Celsius in 2100.”

The Director of MIT’s System Dynamics Group, John Sterman, and his partner at Climate Interactive, Andrew Jones, quickly emailed ThinkProgress to explain, “We are not these researchers and this is not our finding.”

They point out that “our business as usual, reference scenario leads to expected warming by 2100 of 4.2°C. Full implementation of current Paris pledges plus all announced mid-century strategies would reduce expected warming by 2100 to 3.3°C, a difference of 0.9°C [1.6°F].”

The reference scenario is RCP8.5, used in the IPCC AR5 report published in 2013 and 2014. This is essentially a baseline non-policy forecast against which the impact of climate mitigation policies can be judged. The actual RCP website produces emissions estimates by type of greenhouse gas, of which breaks around three-quarters is CO2. The IPCC and Climate Interactive add these different gases together with an estimate of global emissions in 2100. Climate Interactive current estimate as of April 2017 is 137.58 GtCO2e for the the reference scenario and the National Plans will produce 85.66 GTCO2e. These National would allegedly make global emissions 37.7% than they would have been without them, assuming they are extended beyond 2030. Climate Interactive have summarized this in a graph.

To anyone who actually reads the things, this does not make sense. The submissions made prior to the December 2015 COP21 in Paris were mostly political exercises, with very little of real substance from all but a very few countries, such as the United Kingdom. Why it does not make sense becomes clear from the earlier data that I extracted from Climate Interactives’ C-ROADS Climate Simulator version v4.026v.071 around November 2015.  This put the RCP8.5 global GHG emissions estimate in 2100 at the equivalent of 139.3 GtCO2e. But policy is decided and implemented at country level. To determine the impact of policy proposal there must be some sort of breakdown of emissions. C-ROADS does not provide a breakdown by all countries, but does to divide the world into up to 15 countries and regions. One derived break-down is into 7 countries or regions. That is the countries of USA, Russia, China and India, along with the country groups of EU27, Other Developed Countries and Other Developing Countries. Also available are population and GDP historical data and forecasts. Using this RCP8.5 and built-in population forecasts I derived the following GHG emissions per capita for the historical period 1970 to 2012 and the forecast period 2013 to 2100.

Like when I looked at Climate Interactives’ per capita CO2 emissions from fossil fuels estimates at the end of 2015, these forecasts did not make much sense. Given that these emissions are the vast majority of total GHG emissions it is not surprising that the same picture emerges.

In the USA and the EU I can think of no apparent reason for the forecast of per capita emissions to rise when they have been falling since 1973 and 1980 respectively. It would require for energy prices to keep falling, and for all sectors to be needlessly wasteful. The same goes for other developed countries, which along with Canada and Australia, includes the lesser developed countries of Turkey and Mexico. Indeed why would these countries go from per capita emissions similar to the EU27 now to those of the USA in 2100?

In Russia, emissions have risen since the economy bottomed out in the late 1990s following the collapse of communism. It might end up with higher emissions than the USA in 1973 due to the much harsher and extreme climate. But technology has vastly improved in the last half century and it should be the default assumption that it will continue to improve through the century. It looks like someone, or a number of people, have failed to reconcile the country estimate with the forecast decline in population from 143 million in 2010 to 117 million. But more than this, there is something seriously wrong with emission estimates that would imply that the Russian people become evermore inefficient and wasteful in their energy use.

In China there are similar issues. Emissions have increased massively in the last few decades on the back of even more phenomenal growth, that surpasses the growth of any large economy in history. But emissions per capita will likely peak due to economic reasons in the next couple of decades, and probably at a much lower level than the USA in 1973. But like Russia, population is also forecast to be much lower than currently. From a population of 1340 million in 2010, Climate Interactive forecasts population to peak at  1420 million in 2030 (from 2020 to 2030 growth slows to 2 million a year) to 1000 million in 2100. From 2080 (forecast population 1120) to 2100 population is forecast to decline by 6 million a year.

The emissions per capita for India I would suggest are far too low. When made, the high levels of economic growth were predicted to collapse post 2012. When I wrote the previous post on 30th December 2015, to meet the growth forecast for 2010-2015, India’s GDP would have needed to drop by 20% in the next 24 hours. It did not happen, and in the 18 months since actual growth has further widened the gap with forecast. Similarly forecast growth in GHG emissions are far too low. The impact of 1.25 billion people today (and 1.66 billion in 2100) is made largely irrelevant, nicely side-lining a country who has declared economic growth is a priority.

As with the emissions forecast for India, the emissions forecast for other developing countries is far too pessimistic, based again on too pessimistic growth forecasts. This mixed group of countries include the 50+ African nations, plus nearly all of South America. Other countries in the group include Pakistan, Bangladesh, Myanmar, Thailand, Indonesia, Vietnam, Haiti, Trinidad, Iraq, Iran and Kiribati. There are at least a score more I have omitted, in total making up around 42% of the current global population and 62% of the forecast population in 2100. That is 3 billion people today against 7 billion in 2100. A graph summarizing of Climate Interactive’s population figures is below.

This can be compared with total GHG emissions.

For the USA, the EU27, the other Developed countries and China, I have made more reasonable emissions per capita estimates for 2100.

These more reasonable estimates (assuming there is no technological breakthrough that makes zero carbon energy much cheaper than any carbon technology) produce a reduction in projected emissions of the same order of magnitude as the supposed reduction resulting from implementation of the National Plans. However, global emissions will not be this level, as non-policy developing nations are likely to have much higher emissions. Adjusting for this gives my rough estimate for global emissions in 2100.

The overall emissions forecast is not very dissimilar to that of RCP8.5. Only this time the emissions growth has shift dramatically from the policy countries to the non-policy countries. This is consistent with the data from 1990 to 2012, where I found that the net emissions growth was accounted for by the increase in emissions from developing countries who were not signatories to reducing emissions under the 1992 Rio Declaration. As a final chart I have put the revised emission estimates for India and Other Developing Countries to scale alongside Climate Interactives’ Scoreboard graphic at the top of the page.

This clearly shows that the emissions pathway consistent the constraining warming to  2°C will only be attained if the developing world collectively start reducing their emissions in a very few years from now. In reality, the priority of many is continued economic growth, which will see emissions rise for decades.

Concluding Comments

This is a long post, covering a lot of ground. In summary though it shows environmental activist has Joe Romm has failed to check the claims he is promoting. An examination of Climate Interactive (CI) data underlying the claims that current policies will reduce global temperature by 0.9°C through reducing GHG global emissions does not stand up to scrutiny. That 0.9°C claim is based on global emissions being around 35-40% lower than they would have been without policy. Breaking the CI data down into 7 countries and regions reveals that

  • the emissions per capita forecasts for China and Russia show implausibly high levels of emissions growth, when they show peak in a few years.
  • the emissions per capita forecasts for USA and EU27 show emissions increasing after being static or falling for a number of decades.
  • the emissions per capita forecasts for India and Other Developing Countries show emissions increasing as at implausibly lower rates than in recent decades.

The consequence is that by the mere act of signing an agreement makes apparent huge differences to projected future emissions. In reality it is folks playing around with numbers and not achieving anything at all, except higher energy prices and job-destroying regulations. However, it does save the believers in the climate cult from having to recognize the real world. Given the massed hordes of academics and political activists, that is a very big deal indeed.

Kevin Marshall 

Joe Romm falsely accuses President Trump understating Impact of Paris Deal on Global Warming

Joe Romm of Climate Progress had a post two weeks ago Trump falsely claims Paris deal has a minimal impact on warming

Romm states

In a speech from the White House Rose Garden filled with thorny lies and misleading statements, one pricks the most: Trump claimed that the Paris climate deal would only reduce future warming in 2100 by a mere 0.2°C. White House talking points further assert that “according to researchers at MIT, if all member nations met their obligations, the impact on the climate would be negligible… less than .2 degrees Celsius in 2100.”

The deeply prejudiced wording, written for an extremely partisan readership, encourages readers to accept the next part without question.

The 0.2°C estimate used by Trump may be from another MIT group; the Joint Program on the Science and Policy of Global Change did have such an estimate in early 2015, before all of the Paris pledges were in. But, their post-Paris 2016 analysis also concluded the impact of the full pledges was closer to 1°C.

The source for the 0.2°C claim is the MIT JOINT PROGRAM ON THE SCIENCE AND POLICY OF GLOBAL CHANGE. ENERGY & CLIMATE OUTLOOK PERSPECTIVES FROM 2015

This states

New in this edition of the Outlook are estimates of the impacts of post-2020 proposals from major countries that were submitted by mid-August 2015 for the UN Conference of Parties (COP21) meeting in Paris in December 2015.

So what INDC submissions were in by Mid-August? From the submissions page (and with the size of total 2010 GHG Emissions from the Country Briefs) we get the following major countries.

In box 4 of the outlook, it is only Korea that is not included in the 0.2°C impact estimate. That is just over half the global emissions are covered in the MIT analysis. But there were more countries who submitted after mid-August.

The major countries include

 
My table is not fully representative, as the UNFCCC did not include country briefs for Nigeria, Egypt, Saudi Arabia, Iran, Iraq, Kuwait and UAE. All these countries made INDC submissions along with a lot of more minor GHG emitters. I would suggest that by mid-August all the major countries that wanted to proclaim how virtuous they are in combating climate change were the early producers of the INDC submissions. Countries like the Gulf States, India and Indonesia tended to slip their documents in somewhat later with a lot of measly words to make it appear that they were proposing far more than token gestures and pleas for subsidies. Therefore, the 0.2°C estimate likely included two-thirds to three-quarters of all the real emission constraint proposals. So how does an analysis a few months later produce almost five times the impact on emissions?

The second paragraph of the page the later article Joe Romm links to clearly states difference in methodology between the two estimates.


A useful way to assess that impact is to simulate the effects of policies that extend the Agreement’s 188 pledges (known as Nationally Determined Contributions, or NDCs) to the end of the century. In a new study that takes this approach, a team of climate scientists and economists from the MIT Joint Program on the Science and Policy of Global Change led by research scientist Andrei Sokolov finds that by 2100, the Paris Agreement reduces the SAT considerably, but still exceeds the 2 C goal by about 1 C.

The primary difference is that the earlier study tries to measure the actual, real world, impacts of existing policy, and policy pledges, if those policies are fully enacted. In the USA, those pledges would need Congressional approval to be enacted. The later study takes these submissions, (which were only through to 2030) and tries to estimate the impact if they were extended until 2100.  That is renewables subsidies that push up domestic and business energy costs would be applied for 85 years rather than 15. It is not surprising that if you assume policy proposals are extended for over five times their original period, that they will produce almost five times the original impact. To understand this all that is required is to actually read and comprehend what is written. But Joe Romm is so full of bile for his President and so mad-crazy to save the planet from the evils of Climate Change and (mostly US) big business that he is blinded to that simple reality-check.

The fuller story is that even if all policies were fully enacted and extended to 2100, the impact on emissions would be far smaller than Joe Romm claims. That will be the subject of the next post.

Kevin Marshall

General Election 2017 is a victory for the Alpha Trolls over Serving One’s Country

My General Election forecast made less than 12 hours before the polls opened yesterday morning was rubbish. I forecast a comfortable majority of 76 for the Conservatives, when it now looks like there will be a hung Parliament. That my central estimate was the same as both Lord Ashcroft‘s and Cerburus at Conservative Women is no excuse. In fact it is precisely not following general opinion, but understanding the real world, that I write this blog. What I have learnt is that the social media was driving a totally different campaign that was being reported in the other media. The opinion polls started to pick this up, and all sensible people did not believe it. Personally I was partly blind to the reality, as I cannot understand why large numbers of people should vote in numbers for an extreme left political activist who has over many years has sided with terrorists. Or a prospective Home Secretary who once voiced support for terrorism, and is unrepentant about that support. But then, in Paris 2015 leaders of the Western World voted for a Climate Agreement to cut global emissions, when that very Agreement stated it would do no such thing. The assessment of achievement was in the enthusiasm of the applause for the world leaders, rather than comparing objectives with results. That means comparing the real data with what is said.

Similarly in this election, we had all parties saying that they would spend more on things that have very marginal benefit compared to the cost. This included improving the NHS by giving staff a pay rise, or increasing the numbers of police “in every ward” to combat terrorism. It also includes trying to retain the structures of the European Union when we are leaving it, without defining recognizing the issues of a half-way house or the real benefits of those institutions There was also the gross hypocrisy of blaming problems caused, in part or in full, of past policies on something or someone else. This includes

  • Blaming austerity on the Tory Government, when the current structural deficit is a legacy of Gordon Brown’s Golden Rule. Given that Gordon Brown is a Scottish Progressive, it something that the SNP needs to confront as well.
  • Blaming rise energy bills on the Energy Companies, when it is a result of the Climate Change Act 2008. When Ed Miliband launched the policy at the Labour Party Conference in 2013, it was seen as something of the left extremism. But the Conservatives put such controls in their manifesto as well.
  • Blaming the rising cost of pensions on increased longevity, when a major part of the reason is near zero interest rates on savings.

Part of that blame is for the rise is the spin doctors, who only put out messages that will be well received by the target voters, and keep in the background areas where the target voters are split in their views. The Conservative manifesto and Theresa May’s election campaign could be seen as the inheritors of these 1990s New Labour doctrines. The Labour Party, however have rejected New Labour Blairism. In one sense Labour have retrogressed, with mass rallies that hark back to era when the British socialist party was in the ascendancy. But in another way Labour grassroots have embraced the new technology. We have a new way of communicating ideas based on a picture and 140 characters that takes power away from a few professional manipulators of public opinion. That power now rests with alpha trolls or non-entity celebs with their shallow views supported by isolated facts. It is a sphere where excluding other opinions by changing the subject; or having the last word; or taking offence for upsetting their false perceptions; or claiming those with other opinions are either outright lying or are blinkered; or getting fanciful claims repeated thousands of times until they are accepted as though they were fact.

There is a way out of this morass, that is the exact opposite of the Donald Trump method of out-trolling the trolls. It is by better understanding the real world, so that a vision can be developed that better serves the long-term interests of the people, rather than being lead by the blinkered dogmatists and alpha trolls. I believe that Britain has the best heritage of any country to draw upon for the task. That is a country of the mother of all Parliaments and of the country that evolved trial by a jury of one’s peers. It is a country where people have over the centuries broken out of the box of current opinion to produce something based on a better understanding of the world, without violent revolution. That was the case in science with Sir Issac Newton, Charles Darwin and James Clerk Maxwell. This was the case in economics with Adam Smith and in Christianity with John Wesley. But there are dangers as well.

It is on the issue of policy to combat climate change that there is greatest cross-party consensus, and the greatest concentration of alpha trolls. It is also where there is the clearest illustration of policy that is objectively useless and harmful to the people of this country. I will be providing some illustrations of this policy nonsense in the coming days.

Kevin Marshall