Global Emissions Reductions Targets for COP21 Paris 2015

There is a huge build-up underway for the COP21 climate conference to be staged in Paris in November. Many countries and NGOs are pushing for an agreement that will constrain warming to just 2oC, but there are no publicly available figures of what this means for all the countries of the world. This is the gap I seek close with a series of posts. The first post is concerned with getting a perspective on global emissions and the UNIPCC targets.

In what follows, all the actual figures are obtained from three primary sources.

  • Emissions data comes from the Carbon Dioxide Information Analysis Centre or CDIAC.
  • Population data comes from the World Bank, though a few countries are missing. These are mostly from Wikipedia.
  • The Emissions targets can be found in the Presentation for the UNIPCC AR5 Synthesis Report.

All categorizations and forecast estimates are my own.

The 1990 Emissions Position

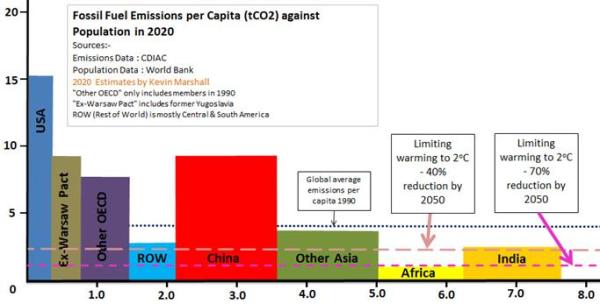
A starting point for emissions reductions is to stabilize emissions to 1990 levels, around the time that climate mitigation was first proposed. To illustrate the composition emissions I have divided the countries of the world into the major groups meaningful at that time – roughly into First World developed nations, the Second World developed communist countries and the Third World developing economies. The First World is represented by the OECD. I have only included members in 1990, with the USA split off. The Second World is the Ex-Warsaw pact countries, with the countries of the former Yugoslavia included as well. The rest are of the world is divided into five groups. I have charted the emissions per capita against the populations of these groups to come up with the following graph.

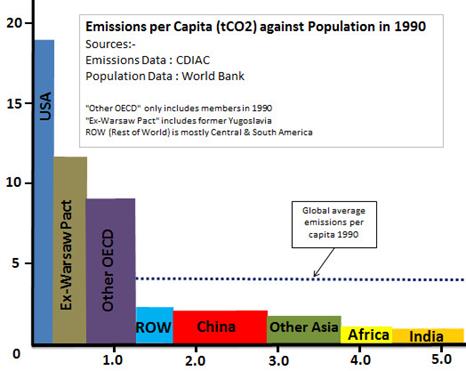
In rough terms, one quarter of the global population accounted for two-thirds of global emissions. A major reduction on total emissions could therefore be achieved by these rich countries taking on the burden of emissions reductions, and the other countries not increasing their emissions, or keeping growth to a minimum.

The 2020 emissions forecast

I have created a forecast of both emissions and population for 2020 using the data up to 2013 for both emissions and population. Mostly these are assuming the same change in the next seven years as the last. For emissions in the rapidly-growing countries this might be an understatement. For China and India I have done separate forecasts based on their emissions commitments. This gives the following graph.

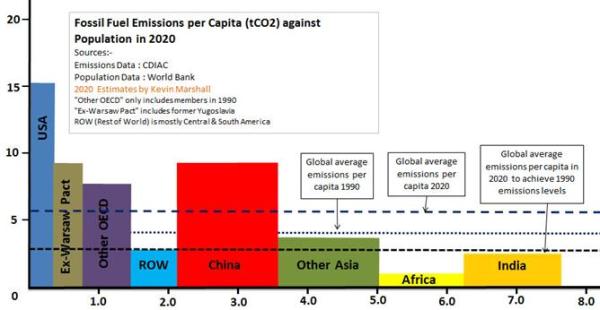
The picture has changed dramatically. Population has increased by 2.4 billion or 45% and emissions by over 80%. Global average emissions per capita have increased from 4.1 to 5.2t/CO2 per capita. Due to the population increase, to return global emissions to 1990 levels would mean reducing average emissions per capita to 2.85t/CO2.

The composition of emissions has been even more dramatic. The former First and Second World countries will see a slight fall in emissions from 14.9 to 14.0 billion tonnes of CO2 and the global share will have reduced from 68% to 36%. Although total population will have increased on 1990, the slower growth than elsewhere means the share of global population has shrunk to just 19%. China will have a similar population and with forecast emissions of 13.1 billion tonnes of CO2, 33% of the global total.

The picture is not yet complete. On slide 30 of their Synthesis Report presentation the UNIPCC state

Measures exist to achieve the substantial emissions reductions required to limit likely warming to 2oC (40-70% emissions reduction in GHGs globally by 2050 and near zero GHGs in 2100)

The baseline is 2011, when global emissions were 29.74 billion t/CO2. In 2050 global population will be nearly nine billion. This gives an upper limit of 2.2 t/CO2 per capita and lower limit of 1.1 t/CO2 per capita.

To put this in another perspective, consider the proportions of people living in countries that need emissions targets based on greater than 2.2t/CO2 emissions per capita.

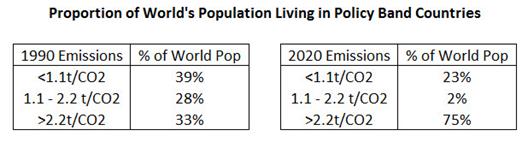
In 1990, it was just a third of the global population. In 2020 it will be three quarters. No longer can an agreement on constraining global CO2 emissions be limited to a few countries. It needs to be truly global. The only area that meets the target is Africa, but even here the countries of Algeria, Egypt, Libya, Tunisia and South Africa would need to have emission reduction targets.

Further Questions

  1. What permutations are possible if other moral considerations are taken into account, like the developed countries bear the burden of emission cuts?
  2. What targets should be set for non-fossil fuel emissions, such as from Agriculture? Are these easier or harder to achieve than for fossil fuels?
  3. What does meeting emission targets mean for different types of economies? For instance are emission reductions more burdensome for the fast-growing emerging economies that for the developed economies?
  4. What are the measures that IPCC claims exist to reduce emissions? Are they more onerous than the consequences of climate change?
  5. Are there in place measures to support the states dependent on the production of fossil fuels? In particular, the loss of income to the Gulf States from leaving oil in the ground may further destabilize the area.
  6. What sanctions if some countries refuse to sign up to an agreement, or are politically unable to implement an agreement?
  7. What penalties will be imposed if countries fail to abide by the agreements made?

Kevin Marshall

Understanding the US EIAs Levilized Cost of Electric Generation figures

At Watts Up With That?, Willis Eschenbach has a post “The Levelized Cost of Electric Generation“. These are estimated figures by US Energy Information Agency (EIA) for the costs of power by fuel source, for plants with construction started now that would enter service in 2018. The full table from the EIA in $/MwH is reproduced as Table 1 below.

Willis makes the valid point that every unit of “non-dispatchable” power (i.e. renewables with no power on demand) capacity, there must be an equal amount of dispatchable power to back it up. He does not follow this up. Non-dispatchable power does not need to be fully-covered by the expensive high-efficiency fossil-fuelled power stations. The most extreme conditions of peak power demands but no wind can be met by diesel generators. These are relatively low capital cost, but with high unit costs of output. They still add to the costs of renewables, along with reducing the CO2 savings. In terms of the large scale fossil-fuelled power stations gas is clearly better than coal. Combined cycle gas has half the capital cost per unit as conventional coal so dropping the utilisation will have a much smaller impact on unit costs. Further it can be switched on or off much quicker than conventional coal. Combined the actual additional cost of renewables is lower than he implies.

As I have been looking into the subsidies that renewables receive in the UK, I would like to observations. To understand these comments in the context of Willis Eschenbach’s post please note:-

  • In the UK, all generated electricity is paid the wholesale price (approx $0.09 kwh at present).
  • In addition renewables receive renewables obligation credits or ROCs. Biomass (wood pellets usually imported from USA) and onshore wind receive 1 ROC per megawatt hour. Offshore wind receives 2 ROCs. With a ROC worth $0.07 kwh (£42.02 MwH), onshore wind and biomass receives $0.16 kwh and offshore wind $0.23 kwh.
  • Currency conversion is at £1.00 = £1.66. Willis uses kilowatt hours for his simplified summary, whereas as the EIA uses megawatt hours.

Revenue is somewhat different to the costs, but there are a few observations possible.

  1. Capacity utilisation for onshore wind is assumed at 34% and 37% for offshore. For the UK, actual average utilisation as 26% for onshore and 35% for offshore. On that basis, US costs for onshore wind would rise from $0.087 to $0.117 kwh. Here are the figures from the most recent four available years.

  2. Biomass in the UK consists of burning non-fossil fuels in existing coal-fired power stations. It is more expensive than coal because (a) fuel cost per tonne is more than coal and (b) output per tonne is slightly less than coal. I would want to know why the capital cost per kwh is 20% lower and why the variable costs are just 45% higher. On fuel costs alone the 0.2 ROCs per Mwh would be more than generous for biomass. Based on figures from April to August 2013, the full year subsidy saving of this change would be in the order of £300m or $500m per annum.
  3. The transmission investment is vastly understated. Like in the UK, the cost of transmission for a power station investor is likely in connecting the power station to the nearest point on the national grid, regardless of the capacity of the line. To obtain 34% efficiency, wind turbines need to be placed in highly exposed areas, such as hill-tops. Population centres, and established grid networks, tend to be on the plains, or in sheltered valleys. In the UK, the best locations for wind turbines are in the far North of Scotland. To effectively connect this to main grid means upgrading about 400 miles of transmission lines to enable around 5-10GW of power at peak generation. This capital cost could be as much as the wind turbines themselves. Fossil-fuelled power stations tend to be located near existing power stations. These in turn are near to the existing grid infrastructure. The upshot is that wind turbines have much higher transmission costs than fossil-fuelled power stations. The difference could be a number of cents per kilowatt hour.

Kevin Marshall

Green Energy Unicorns

It is not just sufficient to diagnose a problem and get some noisy activists to think up a solution. It is not even sufficient to get some of the greatest economists to devise the theoretically ideal policy. It is also necessary to drive that policy through to a conclusion. Donna Laframboise provides a catalogue of recent green energy failures. It is far from being an exhaustive list, but it amply illustrates that even if we are facing an imminent climate apocalypse, these green policies are not only useless, they are making us poorer, and thus making the situation worse.

Big Picture News, Informed Analysis

Everywhere it has been tried, green energy is costly, unreliable & financially unsustainable over the long term. Here’s a reading list for those still in doubt.

I’ve recently been writing about the fossil fuel divestment movement which, according to someaccounts, is “sweeping” US college campuses. In the opinion of the idealistic young activists involved in this movement, fossil fuels are passé.

“It’s time for a new age of renewables” they declare. College endowment funds should invest in “renewable energies” instead.

Why do we hold on so firmly to green fantasies? Why won’t we admit that currently available renewable energy sources don’t measure up?

This past March, the chief investment officer for California’s state pension plan called investments in clean technology “a noble way to lose money.” It’s possible, he acknowledged, that some of these investments might turn out to be profitable on a timescale of…

View original post 694 more words

Costs of Climate Change in Perspective

This is a draft proposal in which to frame our thinking about the climatic impacts of global warming, without getting lost in trivial details, or questioning motives. This builds upon my replication of the thesis of the Stern Review in a graphical form, although in a slightly modified format.

The continual rise in greenhouse gases due to human emissions is predicted to cause a substantial rise in average global temperatures. This in turn is predicted to lead severe disruption of the global climate. Scientists project that the costs (both to humankind and other life forms) will be nothing short of globally catastrophic.

That is

CGW= f {K}                 (1)

The costs of global warming, CGW are a function of the change in the global average surface temperatures K. This is not a linear function, but of increasing costs per unit of temperature rise. That is

CGW= f {Kx} where x>1            (2)

Graphically


The curve is largely unknown, with large variations in the estimate of the slope. Furthermore, the function may be discontinuous as, there may be tipping points, beyond which the costly impacts of warming become magnified many times. Being unknown, the cost curve is an expectation derived from computer models. The equation thus becomes

E(CGW)= f {Kx}                (3)

The cost curve can be considered as having a number of elements the interrelated elements of magnitude M, time t and likelihood L. There are also costs involved in taking actions based on false expectations. Over a time period, costs are normally discounted, and when considering a policy response, a weighting W should be given to the scientific evidence. That is

E(CGW)=f {M,1/t,L,│Pr-E()│,r,W}    (4)

Magnitude M is the both severity and extent of the impacts on humankind or the planet in general.

Time t is highly relevant to the severity of the problem. Rapid changes in conditions are far more costly than gradual changes. Also impacts in the near future are more costly than those in the more distant future due to the shorter time horizon to put in place measures to lessen those costs.

Likelihood L is also relevant to the issue. Discounting a possible cost that is not certain to happen by the expected likelihood of that occurrence enables unlikely, but catastrophic, events to be considered alongside near certain events.

│Pr-E()│ is the difference between the predicted outcome, based on the best analysis of current data at the local level, and the expected outcome, that forms the basis of adaptive responses. It can work two ways. If there is a failure to predict and adapt to changing conditions then there is a cost. If there is adaptation to anticipation future condition that does not emerge, or is less severe than forecast, there is also a cost. │Pr-E()│= 0 when the outturn is exactly as forecast in every case. Given the uncertainty of future outcomes, there will always be costs incurred would be unnecessary with perfect knowledge.

Discount rate r is a device that recognizes that people prioritize according to time horizons. Discounting future costs or revenue enables us to evaluate the discount future alongside the near future.

Finally the Weighting (W) is concerned with the strength of the evidence. How much credence do you give to projections about the future? Here is where value judgements come into play. I believe that we should not completely ignore alarming projections about the future for which there is weak evidence, but neither should we accept such evidence as the only possible future scenario. Consider the following quotation.

There are uncertain truths — even true statements that we may take to be false — but there are no uncertain certainties. Since we can never know anything for sure, it is simply not worth searching for certainty; but it is well worth searching for truth; and we do this chiefly by searching for mistakes, so that we have to correct them.

Popper, Karl. In Search of a Better World. 1984.

Popper was concerned with hypothesis testing, whilst we are concerned here with accurate projections about states well into the future. However, the same principles apply. We should search for the truth, by looking for mistakes and (in the context of projections) inaccurate perceptions as well. However, this is not to be dismissive of uncertainties. If future climate catastrophe is the true future scenario, the evidence, or signal, will be weak amongst historical data where natural climate variability is quite large. This is illustrated in the graphic below.


The precarious nature of climate costs prediction.

Historical data is based upon an area where the signal of future catastrophe is weak.

Projecting on the basis of this signal is prone to large errors.

In light of this, it is necessary to concentrate on positive criticism, with giving due weighting to the evidence.

Looking at individual studies, due weighting might include the following:-

  • Uses verification procedures from other disciplines
  • Similarity of results from using different statistical methods and tests to analyse the data
  • Similarity of results using different data sets
  • Corroborated by other techniques to obtain similar results
  • Consistency of results over time as historical data sets become larger and more accurate
  • Consistency of results as data gathering becomes independent of the scientific theorists
  • Consistency of results as data analysis techniques become more open, and standards developed
  • Focus on projections on the local level (sub-regional) level, for which adaptive responses might be possible

To gain increased confidence in the projections, due weighting might include the following:-

  • Making way-marker predictions that are accurate
  • Lack of way-marker predictions that are contradicted
  • Acknowledgement of, and taking account of, way-marker predictions that are contradicted
  • Major pattern predictions that are generally accurate
  • Increasing precision and accuracy as techniques develop
  • Changing the perceptions of the magnitude and likelihood of future costs based on new data
  • Challenging and removal of conflicts of interest that arise from scientists verifying their own projections

    Kevin Marshall

IPCC & Greenpeace

The Shub Niggurath (Hattip BishopHill) arguments against the IPCC’s SSREN growth figures are complex. The Greenpeace model on which they were based basically took a baseline projection and backcast from there. A cursory look at the figure GDP figures shows that the economic models point to knife-edge scenario. The economic models indicate that the wrong combination of policies, but successfully applied, could cause a global depression for a nigh-on a generation and lead to 330 million less people in 2050 than the do-nothing scenario. But successful combination of policies will have absolutely no economic impact.

Shub examines this table :-

Table 10.3, page 1187, chapter 10 IPCC SRREN

(Page 32 of 106 in Chapter 10. Download available from here)

I have looked at the GDP per capita and population figures.


To see whether the per capita GDP projections are realistic, I have first estimated the implied annual growth rates. The IEA calculates a baseline of around 2% growth to 2030. The German Aerospace Centre then believes growth rates will fall to 1.7% in the following 20 years. Why, I am not sure, but it certainly gives a lower target to aim at. Projecting the 2030 to 2050 growth rate forward to the end of the century gives a GDP per capita (in 2005 constant values) of $56,000. That is a greater than five-fold increase in 93 years.

On a similar basis there are two scenarios examined for climate change policies. In the Category III+IV case, growth rates drop to 0.5% until 2030. It then picks up to 2% per annum. Why a policy that reduces global growth by 75% for 23 years should then cause a rebound is beyond me. However, the impact on living standards is profound. Almost 30% lower by 2030. Even if the higher growth is extrapolated to the end of the century, future generations are still 12% worse off than if nothing was done.

But the Category I+II case makes this global policy disaster seem mild by comparison. Here the assume is that global output per capita will fall year-on-year by 0.5% for nearly a generation. That is falling living standards for 23 years, ending up at little over half what they were in 2007. This scenario will be little changed in 2050 or 2100. Falling living standards mean lower life expectancy and a reduction in population growth. The model reflects this by projecting that these climate change policies will lead to 330 million less people than a do-nothing scenario.

Let us be clear what this table is saying. If the world gets together and successfully implements a set of policies to contain CO2 levels at 440ppm, the global output in 2050 will be 40% lower. There is a downside risk here as well – that this cost will not contain the growth in CO2, or that the alternative power supplies will mean power outages, or that large-scale, long-term government projects tend to massively overrun on costs and under perform on benefits.

Let us hark back to the Stern Review, published in 2006. From the Summary of Conclusions

“Using the results from formal economic models, the Review estimates that if we don’t

act, the overall costs and risks of climate change will be equivalent to losing at least

5% of global GDP each year, now and forever. If a wider range of risks and impacts

is taken into account, the estimates of damage could rise to 20% of GDP or more.

In contrast, the costs of action – reducing greenhouse gas emissions to avoid the

worst impacts of climate change – can be limited to around 1% of global GDP each

year.”

Stern looked at the costs, but not at the impact on economic growth. So even if you accept his alarmist prediction costs of 5% or more of GDP, would you bequeath that to your great grandchildren, or a 40% or more reduction lowering of their living standards along with the risk of the policies being ineffective? Add into the mix that The Stern Review took the more alarming estimates, rather a balanced perspective(1) then the IPCC case for reducing CO2 by more solar panels and wind farms is looking highly irresponsible.

From my own perspective, I would not have thought that the impact of climate mitigation policies could be so harmful to economic growth. If the models are correct that the wrong policies are hugely harmful to economic growth, then due diligence should be applied to any policy proposals. If the economic models from the IPCC are too sensitive to minor changes, then we must ask if their climate models suffer from the same failings.

  1. See for instance Tol & Yohe (WORLD ECONOMICS • Vol. 7 • No. 4• October–December 2006)

Update 27th July.

Have just read through Steve McIntyre’s posting on the report. Unusually for him, he concentrates on the provenance of the report and not on analysing the data.

Question for Sir John Beddington

According to Bishop HillSir John Beddington is seeking feedback on the climate impacts report I blogged about yesterday.”

My question is of a technical nature. Given that the Stern Review of 2006 received worldwide acclamation for its novel conclusions, I would have thought Sir John Beddington would have utilised this work. Apart from a footnote or two, the only reference is in a box on page 63.

Dear Sir John,

I am a humble beancounter, who spends his time in analysing complex project costs and application forms for capital expenditures. In this vein, on page 63 of your report you claim that the Stern Review had a social discount rate of 1.4%, whilst

conclude that the Lord Stern used a discount rate of 0.1%. Have we all misread the report?

Biofuels – a policy that is killing the poor

The GWPF reports on a new paper by Indur M. Goklany, Ph.D. that estimates the biofuels policy may be causing 200,000 additional deaths a year. This is compared to the 141,000 deaths (on a like by like basis) that WHO claims may be attributable to climate change.

This paper understates the comparison as the biofuels estimates are many times more robust than the climate change deaths estimates.

The biofuels element is a direct relationship. As real income increases above $1.25 per day, the quantity of food that people can buy increases. From mostly a subsistence existence people can trade. Variety and calorific value of food increase. Also constancy of food supply is assured as a rapidly shrinking portion is reliant on the local harvest. Push up the real cost of food rapidly and this virtuous growth cycle is reversed.

The aspect of Global Warming comes from page 72 of the WHO World Health Report 2002.

“Climate change was estimated to be responsible in 2000 for approximately 2.4% of

worldwide diarrhoea, 6% of malaria in some middle income countries and 7% of dengue

fever in some industrialized countries. In total, the attributable mortality was 154 000 (0.3%)

deaths and the attributable burden was 5.5 million (0.4%) DALYs. About 46% this burden

occurred in SEAR-D, 23% in AFR-E and a further 14% in EMR-D.”

The global warming element comes from

  1. Looking at other elements and relating the impacts to temperature and climate volatility empirically.
  2. Measuring accurately recent temperature record to show increases in temperature. The warming in recent years may have been overstated due to failure to adjust for the urban heat island effect and possible biases in the calculation.
  3. Correctly relating this a proportion of this warming to anthropogenic factors. If it is overstated, then so is the justification for policy to mitigate the climatic effects of that warming.
  4. Accurately measuring the impacts of warming on the climate factors such as floods, droughts, sea level rise, extreme heat waves etc.

If any of these issues are overstated individually, then they can significantly reduce the relationship. But compound and they make the global warming deaths insignificantly different from Zero. For instance the relationship between temperature and malaria is highly controversial and has been dismissed. This might be 10% of the deaths. If the recent rise is only 0.3 degrees, rather than 0.4 degrees, then the mortality impact will reduce more than proportionately. If half the temperature rise due to anthropogenic factors, then it more than halves the impact. Most importantly there is the influence on climate variability. If extreme weather has not increased due to global warming – for instance the hurricane impacts were based on insurance claims rather than increasing frequency and intensity of storms (they may be decreasing), then some of the factors are decreased. Let us give a minimal impact of each of these impacts. Linking each of the elements to climate change could reduce of the attribution by 10% to >90% (say 60%). Measurement actual AGW reduces by 20% to 60% (say 40%). Weather variability due to AGW is highly suspect due to separation from the highly variable natural variability, so the will reduce the attribution by 50% to >100%. Take this as an 80% reduction. The compound effect on attributable deaths is 154,000(100%-60%)(100%-40%)(100%-80%) equals around 7,400. In other words, it is statistically insignificant.

On the other hand there is no mention of the most direct and beneficial impact of increasing greenhouse gases on the health and well-being of the poorest. Higher CO2 levels are directly related to increased plant growth rates and biomass. That means increased agricultural productivity for free.

The later 2003 WHO report “Climate Change and Human Health – Risks and Responses” used this report’s findings, but had plenty of hidden warnings. For instance the final conclusion was

“The increasing trend in natural disasters is partly due to better reporting, partly due to increasing population vulnerability, and may include a contribution from ongoing global climate change.”

Finally, one must consider that if the global warming estimate is accurate, it is not an either/or comparison. Current climate change policies will not achieve a significant reduction in CO2 levels. So the poor will be hit with extra deaths from both sources.


Limits of an Economists Policy Tool Kit

Tim Worstall on the ASI Blog looks at the robust economic tools that are available to control externalities. Here I enlarge on a blog comment looking the limits of these tools in combating climate change.

Although economic solutions may be “hugely cheaper than the sort of command and control systems”, that does not mean they are a solution in every circumstance. In the area of climate change mitigation there are four practical areas where such solutions may have higher costs than the original problem.

  1. The economic policy is applied too far. The benefit to cost ratios will fall the greater the desired change. A 1% reduction in CO2 can be achieved, ceteris paribus, by economic solutions at a benefit to cost ratio of much greater than 1. The costs will rise exponentially after that, so for a given state of technology, the ratio will quickly reduce to less than one. This is the implication of Richard Tol’s 2010 paper “An Analysis of Mitigation as a Response to Climate Change” (2.5MB pdf). Looking at various scenarios, reducing the total amount spent on climate change mitigation from $2.5 trillion to a twentieth of the size increases the benefit to cost ratio from 1/100 to 3/2. I try to graph this here.
  2. Any Cap and trade or Carbon taxes will not be implemented in their purest form. Public Choice theory (or practical examples) will predict that special interest groups will seek to maximize their returns. Those businesses that will be harmed will seek to reduce the effectiveness. Those who can make easy gains (and thus have permits to sell) along with any potential administrators of the scheme will be keen to promote it. There is a long policy chain linking the pure theory and the final outcomes. These various levels of policy formulation and implementation diminish the benefit / cost ratio as I attempt to outline here.
  3. Scheme avoidance. For either a carbon tax or a carbon trading scheme, if there is competition from those outside the area of the scheme that is not proportionately shared by all emitters, then those facing the competition will have the gravest effect on their business. For instance both the steel industry and fossil-fuel power stations are huge CO2 emitters. The European steel firm cannot pass on the cost of the permits to its customers, as it is competing with firms in emerging economies with little or no carbon-trading. A British coal or oil power station does not have this competition, and its main competition comes from the more expensive nuclear power stations, the less reliable wind and the finite hydro-power stations. In the short-term it can pass on the costs. Protectionism is not a solution as it imposes extra costs.
  4. The more encompassing a cap and trade scheme, the greater the number of participants and the complexity. The greater of severity of the scheme, the greater the potential economic gains and losses. Combine these two areas and you create large potential gains from out-right corruption, or engineering biases through the political system, or having unidentified inefficiencies.


    The economic tools might be quite powerful and robust, but put into the hands of inexpert users can create a lot of harm. A bit like a hot-hatch in the hands of 17-year-old trying to impress his mates on a night out.

Richard Black implies UNIPCC scientific conclusions have political bias

Richard Black, an environment correspondent with the BBC, loses sight of the purpose of climate change negotiations in criticizing the USA.

There is a proposal to withdraw funding from the UNIPCC, a result of climate change deniers taking control of House of Representatives in the mid-term elections last year. The consequence, according to Black, is that the USA could have reduced influence over the scientific part of the next UNIPCC report. Does this mean that the scientific conclusions of the UNIPCC reports are politically biased?

The result is that the USA looks

    “set to marginalise the country even further within the global community of nations – at least when it comes to climate change.”

So joining a global climate change agreement is to avoid censure from one’s intellectual superior? Not a matter of making a real positive difference for future generations? If you believe, like Richard Black seems to, that global agreement is all that is necessary to avoid global climate catastrophe, please consider my previous posting here.

Hattip BishopHill

Why China will not Constrain it’s CO2 Emissions

There is an interesting and simple explanation of why it is not possible for the West to emulate China’s growth rates at the ASI Blog. This is basically Robert Solow’s exogenous growth model – that is explained graphically at Wikipedia. China is increasing it’s output per capita by increasing it’s capital per worker on by moving up the current technological production frontier. They are still on the lower part of the curve, so the returns to substituting capital goods for labour are quite large. The western countries are at the top end, so returns can only come from moving to a higher technological boundary.

This does not explain all of the phenomenally high growth rates of China against the West. A clue is that it is not the traditional manufacturing industries that China is entering, such as steel, shipbuilding and textiles. It is also the production of the latest high-tech gadgets invented in the West. The reason is that the time taken in turning prototype to mass production is much quicker in China, due to a lack of regulations and statutory planning consents. Yet most of the profits from the last innovations come before anyone can replicate them. A saving of a few months or weeks for the latest mobile phone or digital camera can mean the difference between millions sold at very high margin and tens of thousands sold at a much lower margin.

China’s high growth rates are also accompanied by a rapid increase in energy production. Much of this comes from coal and oil. The advantage of fossil fuel over clean energy is primarily one of cost, but there is time and convenience as well. Coal is based on well-established technologies and China has large reserves of its own, as well as cheap and reliable supplies from elsewhere. Oil-fired power stations are easy to turn on and off. Against this nuclear power stations take a long time to build (and longer to de-commission), along with higher unit costs. Wind power and solar power are highly expensive, and have an extreme mismatch between the timing of the power supply and power demand. Hydro is limited in availability, takes a long time to build, and (like the Three Gorges or the Itaipu dams) cause environmental damage and the displacement of large numbers of people. To constrain China’s growth in energy will create a slowing down in the ability of China’s entrepreneurs to create new output, and therefore constrain a major advantage of manufacturing in China. The Chinese officials will attend the Climate Summits, smile politely and undermine any binding global commission agreements. It is not out of obstinacy that they do it. Rather they understand that the potential costs of constraint far outweigh any benefits.