UNEP Emissions Gap Report 2018 Part 3 – UNEP tacitly admits climate mitigation is a failure

To those following the superficial political spin of climate policy, a UN organisation admitting that climate mitigation has failed may come as a surprise. Yet one does not have to go too deeply into the new UNEP Emissions Gap Report 2018 to see that this tacit admission is clearly the case. It is contained within the 3 major points in the Executive Summary.

By policy failure, I mean to achieve a global substantial reduction in GHG emissions in the near future, even if that reduction is not in line with either the 1.5°C or 2.0°C warming objective. On this measure, the UNEP is tacitly admitting failure it the summary.
The Executive Summary of the UNEP Emissions Gap Report 2018 starts on the pdf page 14 of 112, numbered page xiv.

Point 1 – Current commitments are inadequate

1. Current commitments expressed in the NDCs are inadequate to bridge the emissions gap in 2030. Technically, it is still possible to bridge the gap to ensure global warming stays well below 2°C and 1.5°C, but if NDC ambitions are not increased before 2030, exceeding the 1.5°C goal can no longer be avoided. Now more than ever, unprecedented and urgent action is required by all nations. The assessment of actions by the G20 countries indicates that this is yet to happen; in fact, global CO2 emissions increased in 2017 after three years of stagnation.

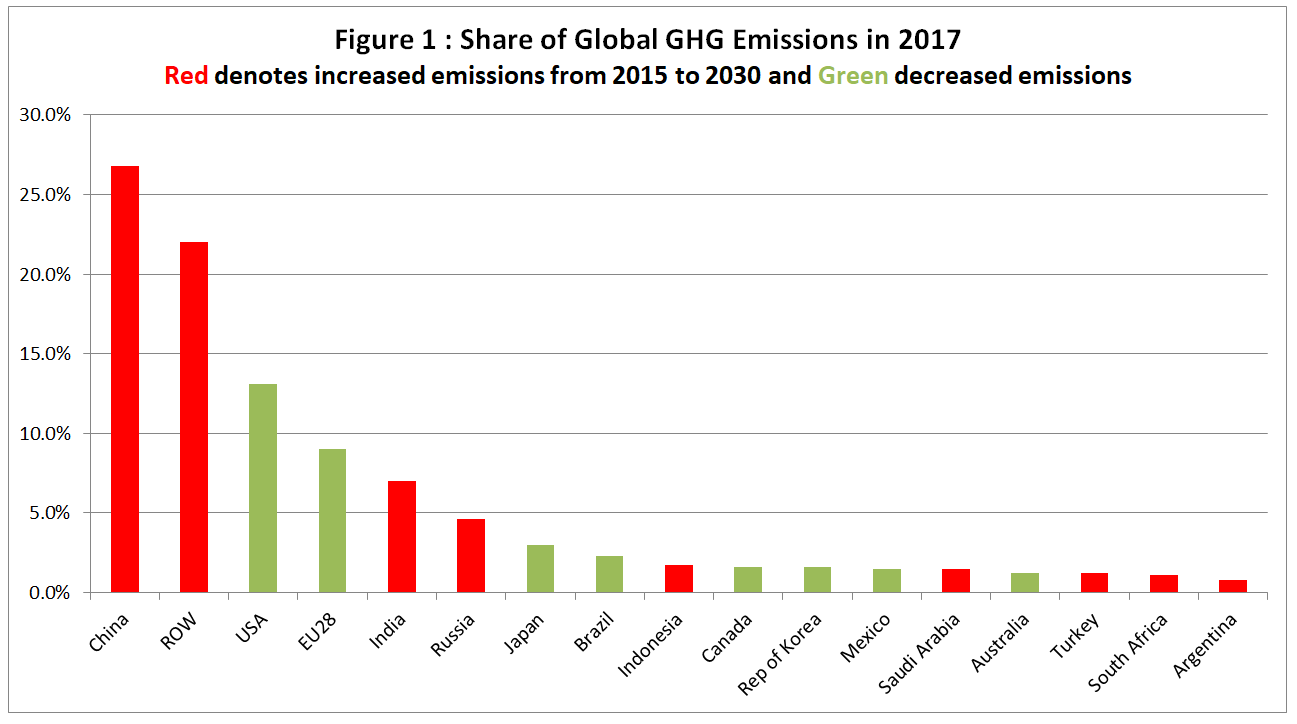
This is not a statement about a final push to get policy over the line, but a call for a complete change of direction. The tacit admission is that this is politically impossible. In the amplification it is admitted that in the G20 major economies – most of them developing countries – even the “NDC ambitions” for 2030 are not likely to be achieved. As I showed in the Part 2 post, 9 of the G20 will actually increase their emissions from 2015 to 2030 if the commitments are fully met, and the sum of the emissions increases will be greater than the emissions decreases. The exhortation for “unprecedented and urgent action” is not like Shakespeare’s Henry V rallying his men with a “once more unto the breach chaps and we will crack it” but more about like “Hey good fellows, if we are really going to breach the defenses we need to upgrade from the colorful fireworks to a few kegs of proper gunpowder, then make a few genuine sacrifices. I will be cheering you all the way from the rear“. This sentiment is contained in the following statement.

As the emissions gap assessment shows, this original level of ambition needs to be roughly tripled for the 2°C scenario and increased around fivefold for the 1.5°C scenario.

Point 2 – Emissions are increasing, not decreasing rapidly

2. Global greenhouse gas emissions show no signs of peaking. Global CO2 emissions from energy and industry increased in 2017, following a three-year period of stabilization. Total annual greenhouse gases emissions, including from land-use change, reached a record high of 53.5 GtCO2e in 2017, an increase of 0.7 GtCO2e compared with 2016. In contrast, global GHG emissions in 2030 need to be approximately 25 percent and 55 percent lower than in 2017 to put the world on a least-cost pathway to limiting global warming to 2°C and 1.5°C respectively.

In just 13 years from now global emissions need to be down by a quarter or more than a half to achieve the respective 2°C and 1.5°C targets. Emissions are still going up. Again, an admission that the progress in over two decades is small in relation to the steps needed to achieve anything like a desired outcome.

Point 3 – Scale of the gap in numbers

3. The gap in 2030 between emission levels under full implementation of conditional NDCs and those consistent with least-cost pathways to the 2°C target is 13 GtCO2e. If only the unconditional NDCs are implemented, the gap increases to 15 GtCO2e. The gap in the case of the 1.5°C target is 29 GtCO2e and 32 GtCO2e respectively. This gap has increased compared with 2017 as a result of the expanded and more diverse literature on 1.5°C and 2°C pathways prepared for the IPCC Special Report.

Some developing countries said they would change course conditional on massive amounts of funding. It is clear this will not be forthcoming. Fleshing out the 1.5°C target in the SR1.5 Report showed that it requires more onerous policies than previously thought. Each year UNEP produces a chart that nicely shows the scale of the problem. The 2018 version on page xviii is reproduced as figure 1.

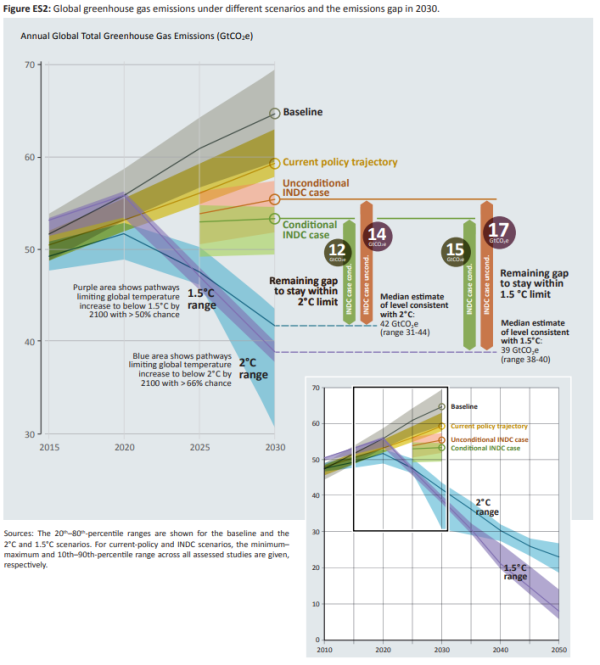
Figure 1 : The emissions GAP in 2030 under the 1.5°C and 2°C scenarios, from the UNEP Emissions Gap Report 2018.

The widening gap between the 1.5°C and 2°C pathways and current projected commitments over the last five reports is shown in figure 2.

This widening gap is primarily a result of recalculations. Increased emissions in 2017 are secondary.

Conclusion

That nearly 200 nations would fail to agree to collectively and substantially reduce global emissions was obvious from the Rio Declaration in 1992. This exempted developing countries from any obligation to reduce their emissions. These developing countries now have at least four fifths of the global population and around two-thirds emissions. It was even more obvious from reading the Paris Agreement, where vague aspirations are evident. It is left to the reader to work out the implications of paragraphs like 4.1 and 4.4, which renders the UNFCCC impotent in reducing emissions. The latest UNEP Emissions Gap Report presents the magnitude of the mitigation policy failure and very clear statements about that failure.

Kevin Marshall

UNEP Emissions Gap Report 2018 Part 2 – Emissions Projections by Country

On previous UNEP Emission Gap Reports I found that although they showed the aggregate global projected emissions, there has been no breakdown by country. As mitigation policies are mostly enacted by nation states, and the aim is to reduce global emissions, it would be useful to actually see how each of the near 200 nation states have pledged contribute to that objective.  Table 2.1 on page 9 of the UNEP Emissions Gap Report 2018 (published last week) goes part way to remedy this glaring omission. The caption states

Table 2.1: Overview of the status and progress of G20 members, including on Cancun pledges and NDC targets.


The G20 economies accounted for 78% of global emissions (excluding LULUCF) in 2017. The table does not clearly show the estimate emissions in 2015 and 2030, only the emissions per capita in 2015 (including LULUCF) and the percentage change in emissions per capita from 2015 to 2030. So I have done my own calculations based on this data using the same future population estimates as UNEP. That is from the medium fertility variant of the United Nations World Population Prospects 2017 edition. There are two additional assumptions I have made in arriving at these figures. First, the share of global emissions in 2015 for each country was exactly the same as in 2017. Second, the global shares including LULUCF (Land use, land-use change and forestry) are the same as those excluding LULUCF. This second assumption will likely understate the total emissions shares of countries like Brazil and Indonesia, where land use has high, and variable, emissions impacts. It may impact the country rankings by a small amount. However, the overall picture shown in Figure 1 will not be materially changed as the report states on page XV that the land use element was just 4.2 GtCO2e of the 53.5 GtCO2e estimated emissions in 2017.

In Figure 1 it is only G20 countries with 33% of current global emissions where emissions are projected to be lower 2030 than in 2015. The other G20, with 45% of global emissions, are projected to be higher. There are wide variations. I calculate, Argentina is projected to increase its emissions by 7% or 32 MtCO2e, Turkey by 128% or 521 MtCO2e and India by 93% or 2546 MtCO2e.
To get a clearer picture I have looked at the estimates changes between 2015 and 2030  in Figure 2. Please note the assumptions made above, particularly concerning LULUCF. I also make the additional assumption that in rest of the world emissions will increase in line with projected population growth, so emissions per capita will be unchanged.

The calculated figures show a net increase of 7.4 GtCO2e, compared to EGR2018 estimates of 6 GtCO2e including LULUCF. It might be a reasonable assumption that there are net reductions in removing the rainforests by burning, and increase in trees due to more planting, and the impact of increased growth due to higher CO2 levels will be net positive.
Note that whilst the USA has given notice of exiting the Paris Agreement, and thus its pledges, the pledge was a very soft target. It is more than likely the United States will have the greatest emissions reductions of any country between 2015 and 2030, and have one of the largest percentage reductions as well. These reductions are mostly achieved without economically damaging mitigation policies.
The figures used for the G20 countries in Table 2.1 are only vague estimates as section 2.4.2 (Emissions trends and targets of individual G20 members) implies. However, the assumption of a net increase of 29% for the rest of the world might not be valid if one uses country INDC submissions as a basis for calculation. There are a few countries that have pledged to reduce emissions. Andorra and Liechtenstein are two examples. But among the more populous emerging economies, it is clear from the INDC submissions that there is no intention to reduce emissions.

Figure 3 estimates the implied increase in emissions in the more populous countries outside of the G20 for the unconditional scenarios.

I would also have liked to include DR Republic of Congo, Egypt and Iran, with a combined population of 260 million. However, lack of data in the INDCs prevented this.
Although the 8 countries in Figure 3 contain one eighth of the global population, they currently have just 4% of global emissions. But their aggregate projected emissions increase without outside assistance is 3.0 GtCO2e, on top of 2.1 GtCO2e in 2015. Combined with the 7.4 GtCO2e estimated increase for the G20 countries and it is difficult to see how the UNEP estimates an increase just 3 GtCO2e. (see Figure ES.3 on page XVIII).

There appear to be no countries with a population of more than 40 million outside of the G20 who are promising to decrease their emissions. Tanzania, Colombia, Kenya and Algeria (combined population 190 million people) are all projecting significant emissions increases, whilst Myanmar and Sudan have inadequate data to form an estimate. A quick check of 8 non G20 countries with populations of 30-40 million has the same result. Either an increase in emissions or no data. 

Implications for mitigation policy

In summary, of the 45 nations with a population above 30 million, just 10 have pledged to have emissions lower in 2030 than 2015. The United States will likely achieve this objective are well. The other 34 nations will likely have higher emissions in 2030, with most significantly higher. The 11 emissions-reducing nations have a population of 1.1 billion against 5.3 billion in the 34 other nations and 1.15 billion in nations or territories with a population of less than 30 million. In terms of emissions, barring economic disaster, I estimate it is likely that countries with in excess of 60% of global emissions in 2017 will have emissions in 2030 that exceed those of 2015.  

To put this in context, the Emissions Gap report states on page xv

According to the current policy and NDC scenarios, global emissions are not estimated to peak by 2030.

My analysis confirms this. The Report further states

Total annual greenhouse gases emissions, including from land-use change, reached a record high of 53.5 GtCO2e in 2017, an increase of 0.7 GtCO2e compared with 2016. 
In contrast, global GHG emissions in 2030 need to be approximately 25 percent and 55 percent lower than in 2017 to put the world on a least-cost pathway to limiting global warming to 2°C and 1.5°C respectively.

After over 20 years of annual meeting to achieve global reductions in emissions, there is still no chance of that happening. In the light of this failure UNEP appear to have fudged the figures. Part of this is justified, as many developing countries appear to have put through unjustifiable BAU scenarios then claimed “climate actions” that will bring the projection more into line with what would be a non-policy forecast. COP 24 at Katowice will just be another platform for radical environmentalists to denigrate capitalist nations for being successful, and for a collective finger-wagging at the United States. 

The next part will look at the coded language of the Emissions Gap Report 2018 that effectively admits the 2°C and 1.5°C ambitions are impossible.

Kevin Marshall


UNEP Emissions Gap Report 2018 Part 1 – The BBC Response

Over the past year I have mentioned a number of times to UNEP Emissions Gap Report 2017. The successor 2018 EGR (ninth in the series) has now been published. This is the first in a series of short posts looking at the issues with the report. First up is an issue with the reporting by the BBC.
On the 27th Matt Macgarth posted an article Climate change: CO2 emissions rising for first time in four years.
The sub-heading gave the real thrust of the article.

Global efforts to tackle climate change are way off track says the UN, as it details the first rise in CO2 emissions in four years.

Much of the rest of the article gives a fair view of EGR18.  But there is a misleading figure. Under “No peaking?” the article has a figure titled

Number of countries that have pledged to cap emissions by decade and percentage of emissions covered”.

In the report Figure 2.1 states

Number of countries that have peaked or are committed to peaking their emissions, by decade (aggregate) and percentage of global emissions covered (aggregate).

The shortened BBC caption fails to recognize that countries in the past peaked their emissions unintentionally.  In looking at Climate Interactive‘s bogus emissions projections at the end of 2015 I found that, collectively, the current EU28 countries peaked their emissions in 1980. In the USA emissions per capita peaked in 1973. Any increases since then have been less than the rise in population. Yet Climate Interactive’s RCP8.5, non-policy, projection apportionment by country assumed that 

(a) Emissions per capita would start to increase again in the EU and USA after falling for decades

(b) In China and Russia emissions per capita would increase for decades to levels many times that of any country.

(c) In India and African countries emissions per capita would hardly change through to 2100, on the back of stalled economic growth. For India, the projected drop in economic growth was so severe that on Dec 30th 2015 to achieve the projection the Indian economy would have needed to have shrunk by over 20% before Jan 1st 2016. 

Revising the CO2 emissions projections (about 75% of the GHG emissions EGR18 refers to) would have largely explained the difference between the resultant 4.5°C of warming in 2100 from the BAU scenario of all GHG emissions and the 3.5°C consequential on the INDC submissions. I produced a short summary of more reasonable projections in December 2015.

Note that EGR18 now states the fully implemented INDC submissions will achieve 3.2°C of warming in 2100 instead of 3.5°C that CI was claiming three years ago.

The distinction between outcomes consequential on economic activity and those resultant from the deliberate design of policy is important if one wants to distinguish between commitments that inflict economic pain on their citizens (e.g. the UK) and commitments that are almost entirely diplomatic hot air (the vast majority). The BBC fails to make the distinction historically and in the future, whilst EGR18 merely fails with reference to the future.  

The conclusion is that the BBC should correct its misreporting, and the UN should start distinguishing between hot air and substantive policy to could cut emissions. But that would mean recognizing climate mitigation is not just useless, but net harmful to every nation that enacts policy that will make deep cuts in actual emissions,

Kevin Marshall