On previous UNEP Emission Gap Reports I found that although they showed the aggregate global projected emissions, there has been no breakdown by country. As mitigation policies are mostly enacted by nation states, and the aim is to reduce global emissions, it would be useful to actually see how each of the near 200 nation states have pledged contribute to that objective. Table 2.1 on page 9 of the UNEP Emissions Gap Report 2018 (published last week) goes part way to remedy this glaring omission. The caption states
Table 2.1: Overview of the status and progress of G20 members, including on Cancun pledges and NDC targets.
The G20 economies accounted for 78% of global emissions (excluding LULUCF) in 2017. The table does not clearly show the estimate emissions in 2015 and 2030, only the emissions per capita in 2015 (including LULUCF) and the percentage change in emissions per capita from 2015 to 2030. So I have done my own calculations based on this data using the same future population estimates as UNEP. That is from the medium fertility variant of the United Nations World Population Prospects 2017 edition. There are two additional assumptions I have made in arriving at these figures. First, the share of global emissions in 2015 for each country was exactly the same as in 2017. Second, the global shares including LULUCF (Land use, land-use change and forestry) are the same as those excluding LULUCF. This second assumption will likely understate the total emissions shares of countries like Brazil and Indonesia, where land use has high, and variable, emissions impacts. It may impact the country rankings by a small amount. However, the overall picture shown in Figure 1 will not be materially changed as the report states on page XV that the land use element was just 4.2 GtCO2e of the 53.5 GtCO2e estimated emissions in 2017.
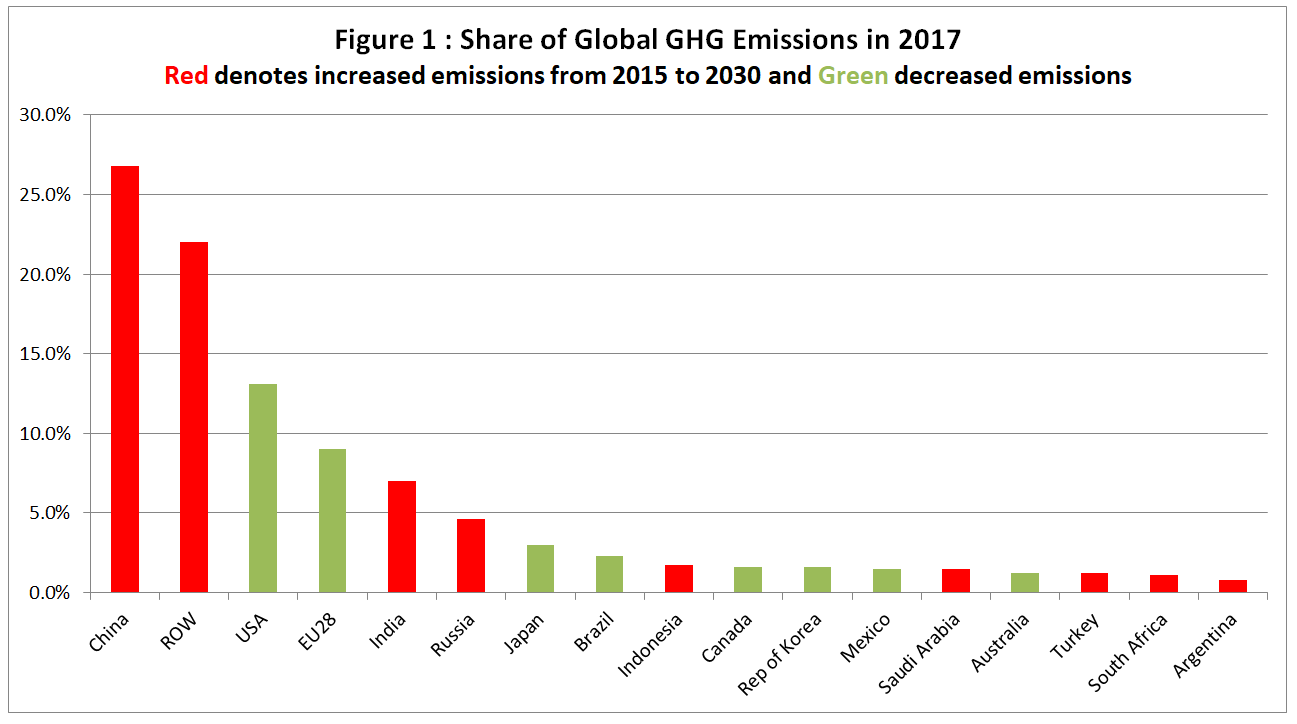
In Figure 1 it is only G20 countries with 33% of current global emissions where emissions are projected to be lower 2030 than in 2015. The other G20, with 45% of global emissions, are projected to be higher. There are wide variations. I calculate, Argentina is projected to increase its emissions by 7% or 32 MtCO2e, Turkey by 128% or 521 MtCO2e and India by 93% or 2546 MtCO2e.
To get a clearer picture I have looked at the estimates changes between 2015 and 2030 in Figure 2. Please note the assumptions made above, particularly concerning LULUCF. I also make the additional assumption that in rest of the world emissions will increase in line with projected population growth, so emissions per capita will be unchanged.

The calculated figures show a net increase of 7.4 GtCO2e, compared to EGR2018 estimates of 6 GtCO2e including LULUCF. It might be a reasonable assumption that there are net reductions in removing the rainforests by burning, and increase in trees due to more planting, and the impact of increased growth due to higher CO2 levels will be net positive.
Note that whilst the USA has given notice of exiting the Paris Agreement, and thus its pledges, the pledge was a very soft target. It is more than likely the United States will have the greatest emissions reductions of any country between 2015 and 2030, and have one of the largest percentage reductions as well. These reductions are mostly achieved without economically damaging mitigation policies.
The figures used for the G20 countries in Table 2.1 are only vague estimates as section 2.4.2 (Emissions trends and targets of individual G20 members) implies. However, the assumption of a net increase of 29% for the rest of the world might not be valid if one uses country INDC submissions as a basis for calculation. There are a few countries that have pledged to reduce emissions. Andorra and Liechtenstein are two examples. But among the more populous emerging economies, it is clear from the INDC submissions that there is no intention to reduce emissions.
Figure 3 estimates the implied increase in emissions in the more populous countries outside of the G20 for the unconditional scenarios.

I would also have liked to include DR Republic of Congo, Egypt and Iran, with a combined population of 260 million. However, lack of data in the INDCs prevented this.
Although the 8 countries in Figure 3 contain one eighth of the global population, they currently have just 4% of global emissions. But their aggregate projected emissions increase without outside assistance is 3.0 GtCO2e, on top of 2.1 GtCO2e in 2015. Combined with the 7.4 GtCO2e estimated increase for the G20 countries and it is difficult to see how the UNEP estimates an increase just 3 GtCO2e. (see Figure ES.3 on page XVIII).
There appear to be no countries with a population of more than 40 million outside of the G20 who are promising to decrease their emissions. Tanzania, Colombia, Kenya and Algeria (combined population 190 million people) are all projecting significant emissions increases, whilst Myanmar and Sudan have inadequate data to form an estimate. A quick check of 8 non G20 countries with populations of 30-40 million has the same result. Either an increase in emissions or no data.
Implications for mitigation policy
In summary, of the 45 nations with a population above 30 million, just 10 have pledged to have emissions lower in 2030 than 2015. The United States will likely achieve this objective are well. The other 34 nations will likely have higher emissions in 2030, with most significantly higher. The 11 emissions-reducing nations have a population of 1.1 billion against 5.3 billion in the 34 other nations and 1.15 billion in nations or territories with a population of less than 30 million. In terms of emissions, barring economic disaster, I estimate it is likely that countries with in excess of 60% of global emissions in 2017 will have emissions in 2030 that exceed those of 2015.
To put this in context, the Emissions Gap report states on page xv
According to the current policy and NDC scenarios, global emissions are not estimated to peak by 2030.
My analysis confirms this. The Report further states
Total annual greenhouse gases emissions, including from land-use change, reached a record high of 53.5 GtCO2e in 2017, an increase of 0.7 GtCO2e compared with 2016.
In contrast, global GHG emissions in 2030 need to be approximately 25 percent and 55 percent lower than in 2017 to put the world on a least-cost pathway to limiting global warming to 2°C and 1.5°C respectively.
After over 20 years of annual meeting to achieve global reductions in emissions, there is still no chance of that happening. In the light of this failure UNEP appear to have fudged the figures. Part of this is justified, as many developing countries appear to have put through unjustifiable BAU scenarios then claimed “climate actions” that will bring the projection more into line with what would be a non-policy forecast. COP 24 at Katowice will just be another platform for radical environmentalists to denigrate capitalist nations for being successful, and for a collective finger-wagging at the United States.
The next part will look at the coded language of the Emissions Gap Report 2018 that effectively admits the 2°C and 1.5°C ambitions are impossible.
Kevin Marshall

3 Comments