At Guido Fawkes this morning I was confronted with a bright green and yellow advert.
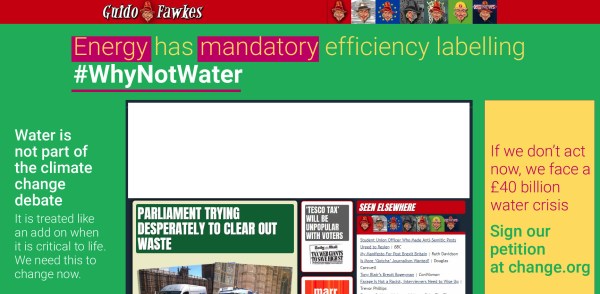
It is an appeal for increased regulation. The reason for the regulation is political.
Water is not part of the climate change debate
It is treated like an add on when it is critical to life. We need to change this now.
Water might be critical to life, but that does not mean the supply is critical. Provision of food and healthcare are also critical to life, and successful provision of both is much more complex and challanging than the supply of the most basic and plentiful of commodities.
If we don’t act now we face a £40 billion water crisis
Sign our petition at change.org
Clicking on the link takes us to a Change.org petition headed
Water efficiency is critical to climate change. Act now to prevent a water crisis.
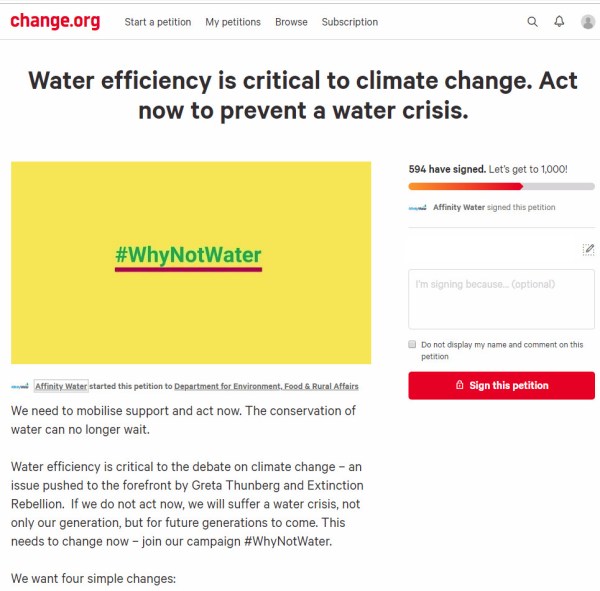
The petition starts with the statement
We need to mobilise support and act now. The conservation of water can no longer wait.
Water efficiency is critical to the debate on climate change – an issue pushed to the forefront by Greta Thunberg and Extinction Rebellion. If we do not act now, we will suffer a water crisis, not only our generation, but for future generations to come. This needs to change now – join our campaign #WhyNotWater.
The heading states “Water efficiency is critical to climate change” implying that changes in water efficiency will affect the actual course of the climate. But the text is “Water efficiency is critical to the debate on climate change”, where some activists claim water efficiency should be part of a debate. The heading implies backing empirical evidence, whereas the text is about beliefs.
Further, a superficial reading of the statement would give the impression that climate change is causing water shortages, and will cause a water crisis. But clicking on the Affinity Water link takes us to a press release on 10th May
Affinity Water warns of water shortages unless government acts now
The UK’s largest water only company, Affinity Water has warned that within the next 25 years and beyond, there may not be enough water due to climate change, population growth and increases in demand.
….
Unlike the advert and the petition there are mentions of other factors that might affect climate change, but no data on the relative magnitudes.
Note that Affinity Water is a limited company, with gross revenues in year to 31 March 2018 of £306.3m, operating profit of £72.3m and profit after tax of £29.6m (Page 107).
The piece finishes with
To find out more about the manifesto visit www.whynotwater.co.ukand to sign a petition to demand the legislation needed for water efficient labelling and water efficient goods and housing visit www.affinitywater.co.uk/ourpetition
The whynotwater website is a bit more forthcoming with the data.
Why should we act?
- Climate change is likely to reduce our supply of water in our area by 39 million litres of water per day by 2080.
- The population is growing and is expected to increase 51% by 2080. This is equivalent to approximately 1.8 million more people in our supply area, putting further strain on our resources.
- Using water wisely is critical in the South East – a severely water-stressed area; did you know there was less rainfall than other parts of the country? Between July 2016 and April 2017 the area received 33% less rainfall than the national average.
- Customers in the South East also use more water daily – 152 litres per person per day, which is higher than the national average of 141 litres per person per day.
From the above population in the supply area is projected to increase from 3.53 to 5.33 million. With unchanged average water usage of 152 litres, this is implies an increase in consumption of 274 million litres. Population change is projected to have seven times the influence on water demand than climate change on supply. It should be noted that these figures is domestic consumption. Currently Affinity Water supplies around 900 million litres per day, implying over 350 litres per day is from other sources. Based on total average supply, climate change ove 60 years is projected to reduce supply by just 4.3%.
But which projection is more robust, that of population increase, or of falls in water availability? With population it is possible to extrapolate from existing data. From the World Bank data, the population of the UK increased by 11% from 2001 to 2016. At this rate, in 2076 the population will be 52% higher than 2016. Within the South East using national data might be unreliable, as population shifts between regions. But it is likely that by 2080 population in Affinity’s supply areas will be significantly higher than today.
Water availability is not so precise, yet the fall due to climate change of 39 million litres per day is just 7% of existing domestic demand, or 4.3% of total water usage. There are some records at the Met Office of rainfall. In particular in the South East are records for Heathrow Airport and Manston in Kent. I have graphed annual rainfall data, with averages of the last 10 years.
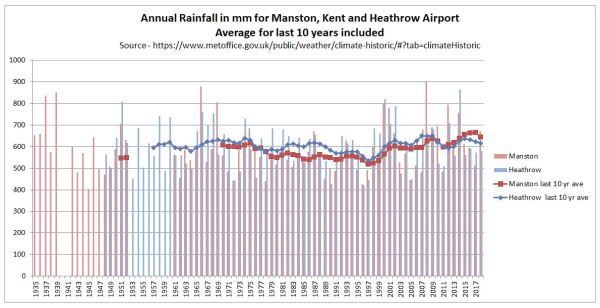
In the past twenty years rainfall has increased in both Manston and Heathrow. Compared to 1979-1998, average annual rainfall in 1999-2018 was 17% higher in Manston and 9% higher in Heathrow. In 60 years from now it might be higher or lower due to random natural climate variability. Any projection of a 4-7% reduction in rainfall is guesswork. If this is still a scientific estimate of unmitigated human-induced climate change, then Affinity better pass the message onto Greta Thurnberg and Extinction Rebellion. From the XR! Website.
THE TRUTH
We are facing an unprecedented global emergency. Life on Earth is in crisis: scientists agree we have entered a period of abrupt climate breakdown, and we are in the midst of a mass extinction of our own making.
This may seem sensationalist even by the the worst tabloid standards, but is the group have toned down a bit. When launched XR! were proclaiming “human-caused (anthropogenic) climate breakdown alone is enough to wipe out the human species by the end of this century.”
As there was no real water crisis in the 1980s and 1990s, why should there be in 2080? The only way there will be a water crisis is if water supply does not increase in line with the projections of rising population. Even then it will hardly contribute to the mass deaths of people in Britain as part of a species extinction. Meeting long-term changing demands should be within the control of the British Government and the regulated water companies. Instead a monopoly water company appears to be falsely attributing the whole problem to an issue outside of its control, campaigning to introduce regulations that are aimed at controlling consumer demand. Rather than serving their client base by additional investment, Affinity Water looks to be deriving fixed demand by controlling them. That investment in new reservoirs, wells, water recycling plants, pipelines from wetter places (Scotland has on average twice the rainfall of the South-East) and even desalination plants could cost billions of pounds. In so doing Affinity Water is listening to a bunch of revolutionaries rather than serving their customers. This must be especially galling for the Affinity Water customers who commute into London and have been inconvenienced by Extinction Rebellion’s blockades over recent months.
Kevin Marshall
Postscript at 4.00pm
The screenshot of the petition petition was taken at around 9.30 this morning, with 594 signatures. It now has 622 signatures. That is less than 5 signatures per hour. In that time Guido Fawkes has likely had over 10,000 unique visitors, based on last weeks figures,
Update 16/05/19 at 23.50
Another day of advertising a Guido Fawkes (and maybe elsewhere) has seen the number of signatures rise to 678. The petition was raised two weeks ago.