At Cliscep, Jaime Jessop looks at Coral Reefs again. She quotes from
Spatial and temporal patterns of mass bleaching of corals in the Anthropocene DOI: 10.1126/science.aan8048 . (Hughes et al 2018)
The first line is
The average surface temperature of Earth has risen by close to 1°C as of the 1880s (1), and global temperatures in 2015 and 2016 were the warmest since instrumental record keeping began in the 19th century.
The surface temperature consists of two parts, land and ocean data. HADCRUT4 data since 1850 is as follows.
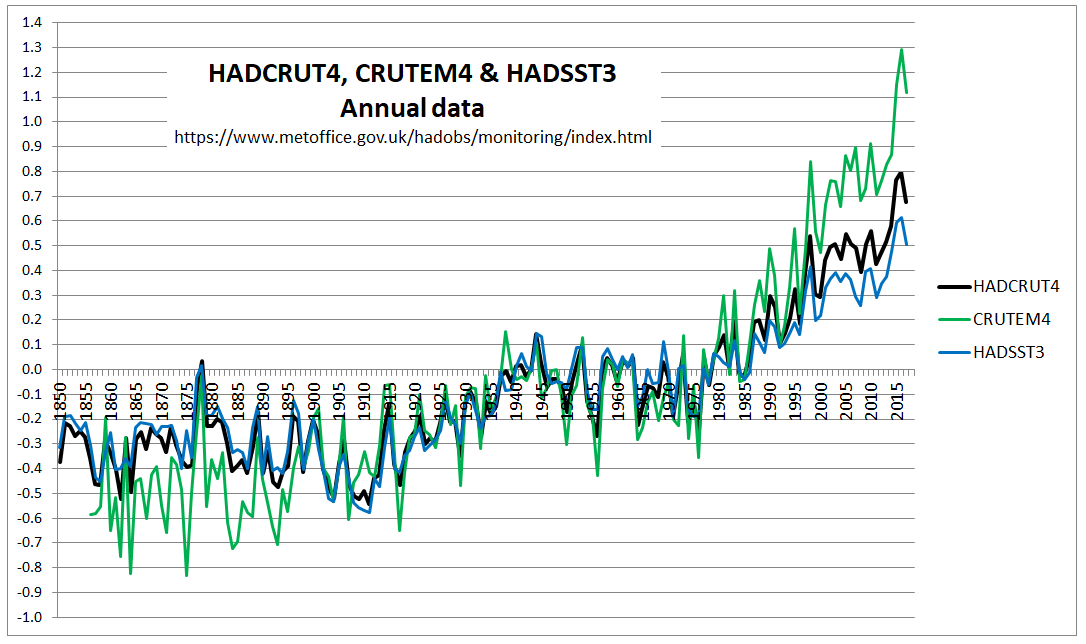
Recent land warming is significantly greater than ocean warming. Further, in the last 50 years the warming in the tropics was slightly less than the global average, with the greatest warming being north of the tropics. Below is a split of the HADCRUT4 data into eight bands of latitude that I compiled last year.
NASA GISS have maps showing trends across the globe. The default is to compare the most recent month with the 1951-1980 average.
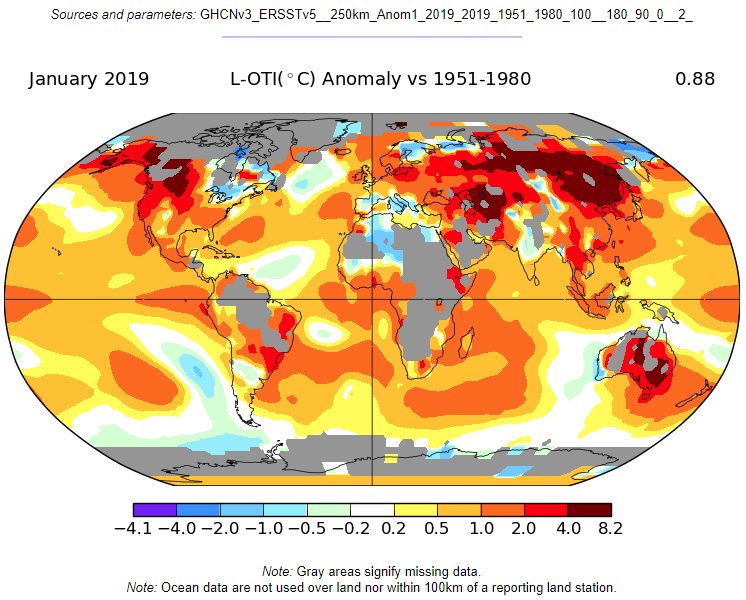
The largest coral reef on the planet is the Great Barrier Reef off the North West Coast of Australia. From the map the warming is -0.2 to 0.2 °C. By implication, Hughes et al are claiming that coral bleaching in the Southern Hemisphere is being caused not by local average surface temperature rise but by a global average heavily influenced by land-based northern hemisphere temperature rise.
However, this is only a modeled estimate of trends. Although local data trends for the sea is not readily available, Berkeley Earth does provide trends for towns on the coastline adjacent to the GBR. I have copied the trends for Cairns and Rockhampton, one located in the middle section of the GBR, the other at the Southern tip.
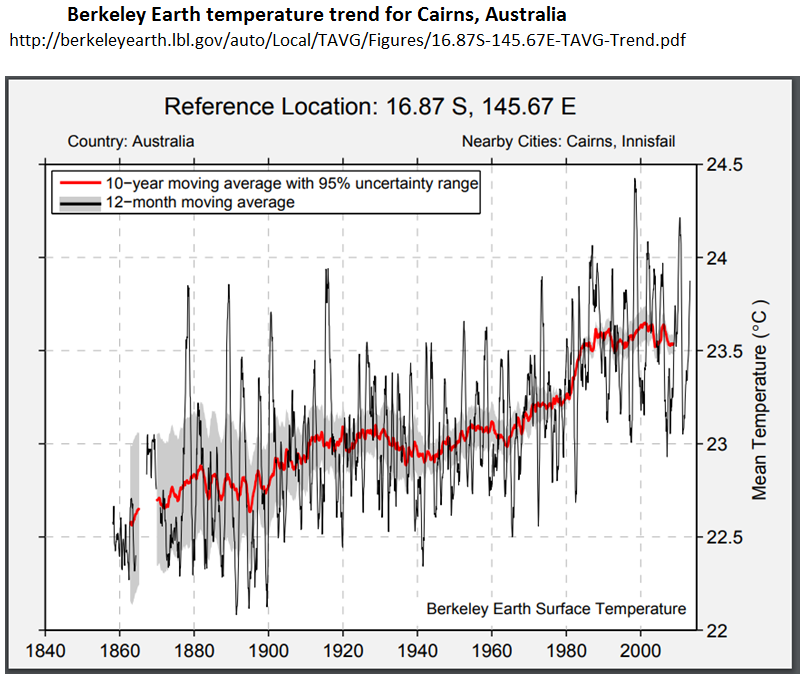
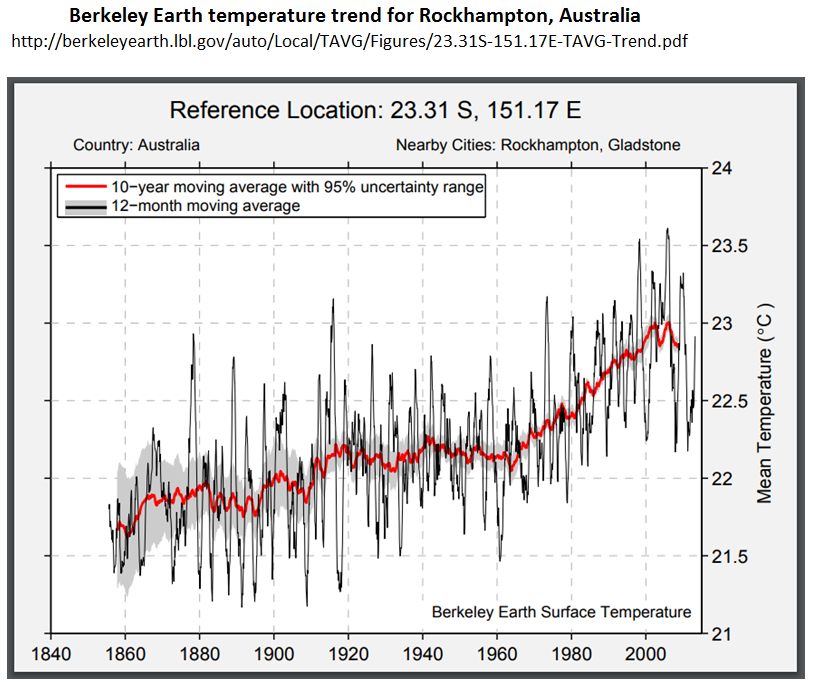
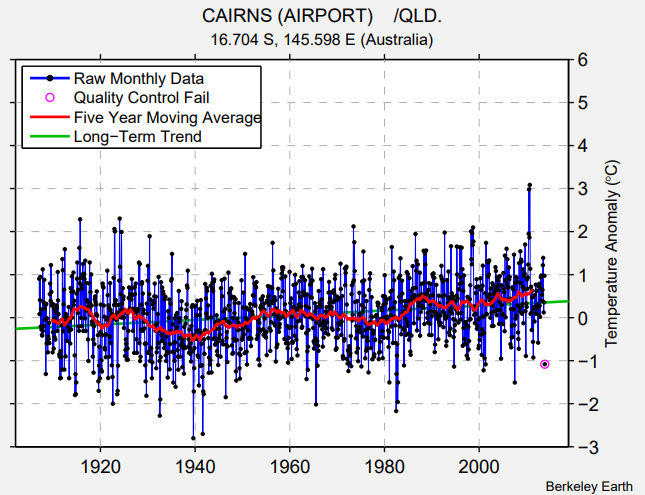
Cairns, in the middle of the GBR, has no warming since 1980, whilst Rockhampton has nearer the global average and no warming trend from 1998 to 2013. This is consistent with the NASA GISS map.
BE are extremely thorough, providing the sites which make up the trend, with the distance from the location. The raw data reveals a more complex picture. For Townsville (one-third of the way from Cairns to Rockhampton) the station list is here. Looking at the list, many of the temperature data sets are of short duration, have poor quality data (e.g. Burdekin Shire Council 4875), or have breaks in the data (e.g. Ayr, Burdekin Shire Council 4876). Another issue with respect to the Great Barrier Reef is that many are inland, so might not be a good proxy for sea surface temperatures. However, there are a couple of stations that can be picked out with long records and near the coast.
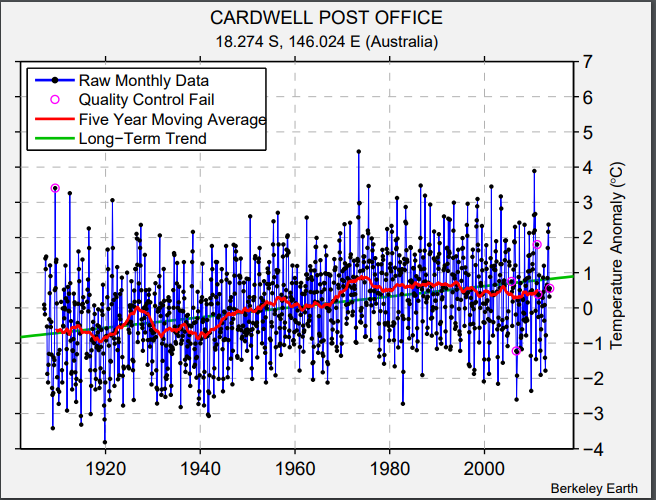
Cardwell Post Office 152368 had peak temperatures in the 1970s and cooling since. Relative to other stations, BE’s algorithms estimated there was a station bias of over 0.5°C in the 1970s.
Cairns Airport 152392 (with data since 1908, twenty years before planes first flew from the site! ) has cooling in the 1930s and warming from 1940 to the late 1950s. The opposite of the global averages. There are no station bias adjustments until 1950, showing that this is typical of the regional expectation. Recent warming is confined to 1980s and a little post 2000.
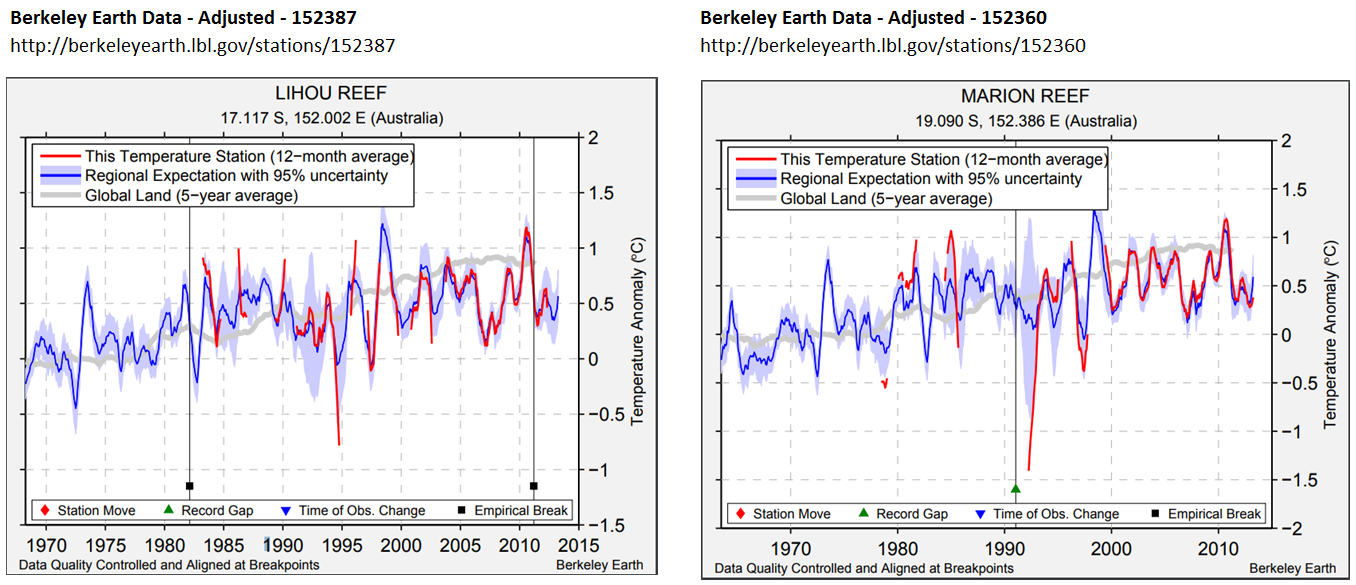
These results are confined to the land. I have found two sites on the GBR that have give a similar picture. Lihou Reef (17.117 S 152.002 E) and Marion Reef (19.090 S 152.386 E). Both for fairly short periods and the quality of the data is poor, which is not surprising considering the locations. But neither show any warming trend since the 1980’s whereas the faint grey line of the global land data does show a warming trend.
The actual temperature data of the GBR indicates that not only are average temperatures not a cause of GBR bleaching, but that calculated global average temperature trends are not replicated on the North East Australian coast. With respect to the world’s largest coral reef, increase incoral bleaching is not empirically linked to any increase in average global temperatures.
UPDATE 11/03/19 – 20:10
Following a comment by Paul Matthews, I have found the sea surface temperature data by location. The HADSST3 data is available in 5o by 5o gridcells. From data that I downloaded last year I have extracted the gridcells for 145-150oE/10-15oS and 145-150oE/15-20oS which cover most of the Great Barrier Reef, plus a large area besides. I have charted the annual averages alongside the HADCRUT4 global and HADSST3 ocean anomalies.
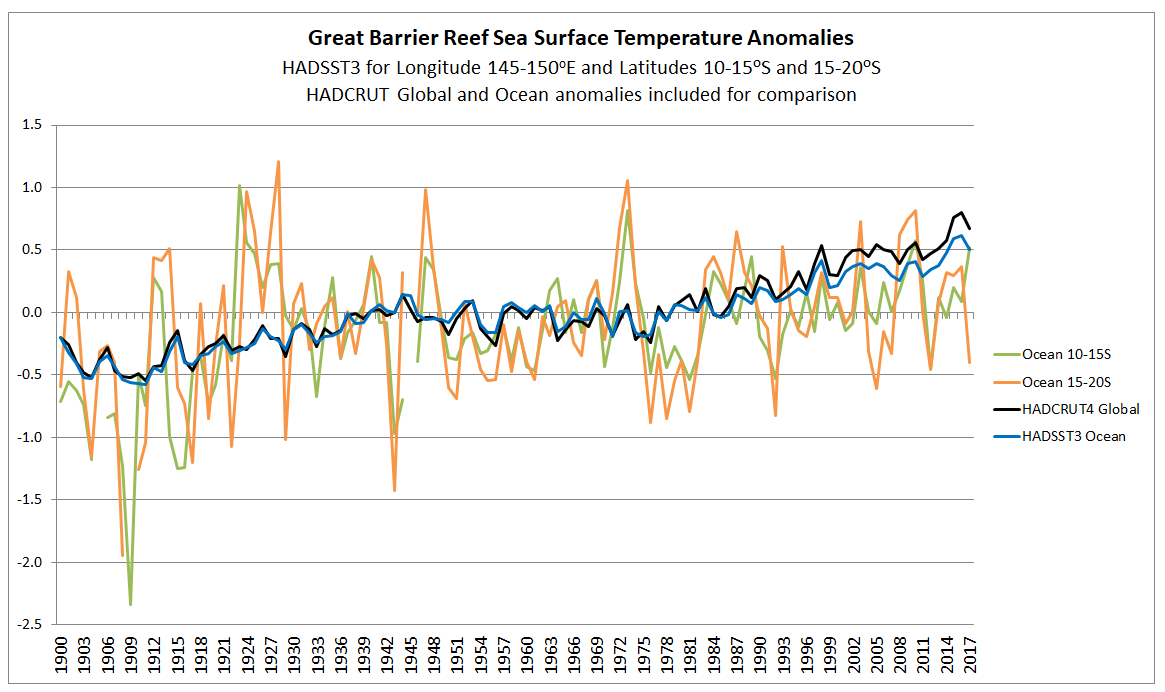
Ocean surface temperatures for the Great Barrier Reef show no warming trend at all, whilst the global averages show a quite distinct warming trend. What is more important, if the coral bleaching is related to sudden increases in sea temperatures then it is the much more massive increases in local data that are important, not the global average. To test whether increases in temperatures are behind bleaching events requires looking for anomalous summer months in the data. Another post is required.
The context of Jaime Jessop’s Cliscep article
After multiple comments at a blogpost by Jaime Jesssop in early January 2018 Geoff M Price wrote a post at his own blog “On Coal Alarmism” on 2nd April 2018. ATTP re-posted 11 months later on 5th March 2019. Personally I find the post, along with many of the comments, a pseudo-scientific and discriminatory attack piece. That may be the subject of another post.
Kevin Marshall

Paul Matthews
/ 11/03/2019These are all surface air temperature. Can you find any data on sea surface temperature in the relevant areas?
manicbeancounter
/ 11/03/2019I do not know of any published SST records by location. The nature of the reading is that they are not taken from exact sites, and prior to the Argo Bouys the reading would mostly have been taken in the main shipping lanes. That would not have included over the GBR itself. However, given that the mainland is west of the GBR and Lihou Reef and Marion Reef are on the Eastern side, I would think that it is unlikely the sea surface temperature trends would be different. The NASA GISS map confirms this.
manicbeancounter
/ 11/03/2019Please see update above.
Jaime Jessop
/ 12/03/2019The BOM, presenting a graph of summer SSTs on the GBR, insist that global warming is primarily responsible for the record highs recorded in 2016 and 2017, even though they provide the data which suggests that El Nino was responsible for high sea surface temperatures (hot summer weather) in 2016 and a dearth of tropical storms was responsible for higher summer temperatures in 2017. Powerful El Nino episodes generally cause drought conditions in the Western Pacific, concomitant with clear skies, intense UV and solar heating – perfect conditions for bleaching corals.
Click to access marine-heatwave.pdf
manicbeancounter
/ 12/03/2019Jaime,
Thanks for your comment. I believe in looking at the original data or sources, rather than looking at secondary sources. This is particularly true if that source is partisan, whether or not they accord with my outlook or not. See for instance by comment yesterday about Ken yesterday.
Joanne Nova and Jennifer Marohasy have had issues with the Australian BOM over the years concerning data adjustments. Please do not take this as a signal, like Ken, to send you off on a wild goose chase. Just compare warming for the G from the NASA Gistemp map and from HADSST3 from the claimed warming from the BOM that Ken came up with yesterday. I conjecture that the Australian BOM have a similar mindset to Ken with regards to temperature data. They believe that temperature trends are the same over quite large areas – a meaningful assumption. The Gistemp map has high rates of warming not that far inland from the GBR and no warming on the GBR. BOM maybe could not find a reason for this being the case, so have balanced things up a bit. Not a conspiracy, just having a set view on what the data should look like.
P.S.
I was going to reply to your comment of Jaime @ 11 Mar 19 at 3:33 pm, but I will try to incorporate into another post on coral reefs.