Esper et al 2012 Orbital forcing of tree-ring data – Corroborating the Sceptic Position

A new summer temperature reconstruction using of tree ring densities in Northern Scandinavia stir, raising some difficult questions for those who believe that C20th warming was caused by human activity

There are a couple of elements that corroborate sceptical beliefs that are not alluded to elsewhere.

Pointer to a low influence of CO2

There has been a decline in summer temperatures of 0.6 degrees.


From the abstract

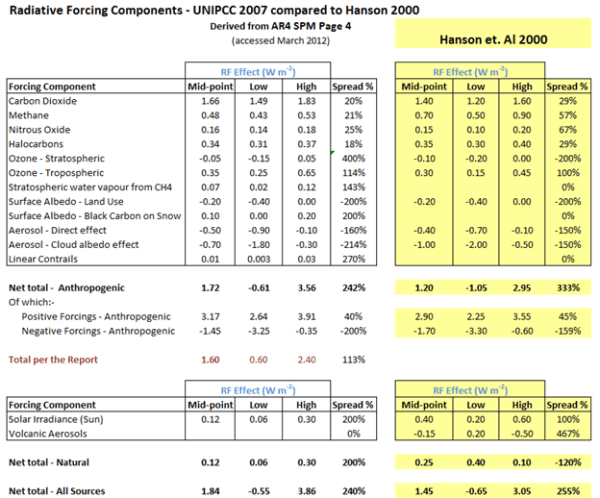
Solar insolation changes, resulting from long-term oscillations of orbital configurations1, are an important driver of Holocene climate23. The forcing is substantial over the past 2,000 years, up to four times as large as the 1.6 W m−2 net anthropogenic forcing since 1750

That is (From the supplementary information figure S13), a decline in temperatures of around 0.6 Celsius is due to a net reduction in orbital forcings of 6 W m−2.

From a 1998 article by Sherwood Idso* on climate sensitivities,

a total greenhouse warming of approximately 33.6°C sustained by a thermal radiative flux of approximately 348 W m–2

That is 6 W m−2 gives approximately 0.6 degrees temperature change. This implies 1.6 W m−2 gives approximately a 0.16 degree temperature change, so CO2 is not the largest influence on C20th warming.

Pointer to the global temperature adjustments being wrong

Yesterday I reblogged pieces of evidence by Steven Goddard indicating that the historical temperature record has been systematically manipulated. In particular, the inter-war warming has been reduced, whilst recent warming has been increased. From the paper, this abstract of the more recent warming trends.

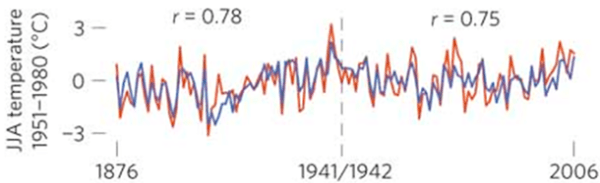
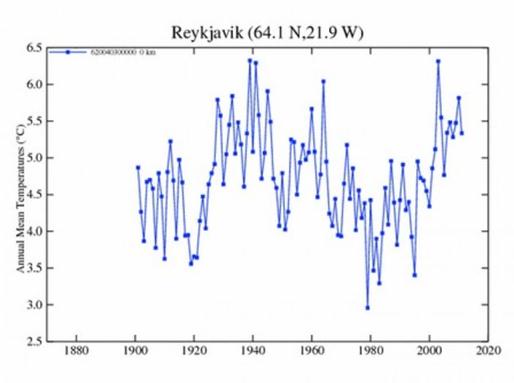
Now compare with two versions of the Reykjavik mean temperatures to see which is closer. I know that Reykjavik is between 50 and 350 miles south of the area surveyed, but it does seem to corroborate one version over the other.

A possible alternative explanation to the lower late C20th temperatures  is in the comments at NoTricksZone. DirkH says

The line actually becomes unreliable from 1912 to the present as it is done with a “100 year spline filter” the paper says. Don’t give to much on the shape of the final wiggle. Can’t find any more information but obviously the window for the filter shrinks near the end, how will it react? Dunno…

Hu McCulloch ain’t too impressed: (2009)

http://climateaudit.org/2009/08/23/spline-smoothing/

*Joanna Nova has a summary here.

This post by Steven Goddard brings together a number of pieces of evidence that “real world” data has been systematically adjusted to fit the theory.
BEWARE THE FLASHING GRAPHS LOWER DOWN.

This is only the second time I have reblogged somebody else’s work in the four years my blog has been running. The reason is that I often observe lots of pieces of evidence that suggest bias, but rarely are some of the pieces of evidence put together to corroborate each other.
Other bits of evidence (from memory)
1. The Darwen, Australia temperature record.
2. The temperature record for New Zealand.
3. The temperature record for Australia – which has recently be replaced to evade an external audit.
4. The HADCRUT temperature series being brought into line with GISTEMP to save having to hide the divergence.

It is not just ex-post adjustments of individual temperature series that creates an artificially large warming trend. There are also the statistical methods used to determine the “average” reading.

Tony Heller's avatarReal Climate Science

There wasn’t any hockey stick prior to the year 2000.

The 1990 IPCC report showed that temperatures were much cooler than 800 years ago.

www.ipcc.ch/ipccreports/far/wg_I/ipcc_far_wg_I_full_report.pdf

Briffa’s trees showed a sharp decline in temperatures after 1940

The 1975 National Academy Of Sciences report also showed a sharp decline in temperatures after 1940

www.sciencenews.org/view/download/id/37739/name/CHILLING_POSSIBILITIES

NCAR reported a sharp drop in temperatures after 1940

denisdutton.com/newsweek_coolingworld.pdf

The USHCN daily temperature data showed a sharp decline in temperatures after 1940

GISS graphs from the eastern Arctic showed a sharp decline in temperatures after 1940

Data.GISS: GISS Surface Temperature Analysis

GISS US temperature graphs showed a sharp drop in temperatures after 1940

NASA GISS: Science Briefs: Whither U.S. Climate?

The Directors of CRU and NCAR forecast a continuing drop in temperatures.

Hubert Lamb CRU Director : “The last twenty years of this century will be progressively colder

http://news.google.com/newspapers/

John Firor NCAR director : “it appears…

View original post 322 more words

Gergis 2012 Mark 2 – Hurdles to overcome

BishopHill reported yesterday on the withdrawn Gergis paper that

The authors are currently reviewing the data and methods. The revised paper will be re-submitted to the Journal of Climate by the end of July and it will be sent out for peer review again.

It is worth listing the long list of criticisms that have been made of the paper. There are a lot of hurdles to overcome before Gergis et al 2012 should qualify for the status of a scientific paper.

My own, quite basic, points are:-

  1. Too few proxies for such a large area. Just 27 for > 5% of the globe.
  2. Even then, 6 are well outside the area.
  3. Of these six, Gergis’s table makes it appear 3 are inside the area. My analysis is below.


  4. Despite huge area, there are significant clusters – with massive differences between proxies at the same or nearby sites.
  5. There are no proxies from the sub-continental land mass of Australia.
  6. Need to remove the Palmyra Proxy because (a) it has errant readings (b) fails the ‘t’ test (c) > 2000km outside of the area, in the Northern Hemisphere.
  7. Without Palmyra the medieval period becomes the warmest of the millennium. But with just two tree ring proxies, one at 42 O South and the other at 43 O S representing an range from 0 to 50O S, this is hardly reliable. See the sum of proxies by year. Palmyra is the coral proxy in the 12th, 14th and 15th centuries.


On top of this are Steve McIntyre’s (with assistance from JeanS and RomanM) more fundamental criticisms:-

  1. The filtering method of Gergis excluded the high quality Law Dome series, but included the lower quality Vostok data, and the Oroko tree ring proxy. McIntyre notes that Jones and Mann 2003 rejected Oroko, but included Law Dome on different criteria.
  2. Gergis screening correlations were incorrectly calculated. JeanS calculated properly. Only 6 out of 27 proxies passed. (NB none of the six proxies outside the area passed)


  3. The Gergis initially screened 62 proxies. Given that the screening included proxies that should not have included 21 proxies, but should it have included some of the 35 excluded proxies. We do not know, as Gergis has refused to reveal these excluded proxies.
  4. Screening creates a bias in the results in favour of the desired result if that correlation is with a short period of the data. RomanM states the issues succinctly here. My, more colloquial take, is that if the proxies (to some extent) randomly show C20th warming or not, then you will accept proxies with a C20th uptick. If proxies show previous fluctuations (to some extent) randomly and (to some extent) independently of the C20th uptick, then those previous fluctuations will be understated. There only has to be a minor amount of randomness to show bias given that a major conclusion was

    The average reconstructed temperature anomaly in Australasia during A.D. 1238-1267, the warmest 30-year pre-instrumental period, is 0.09°C (±0.19°C) below 1961-1990 levels.

UPDATE 03/08/12

The end of July submissions date seems to have slipped to the end of September.

How Gergis Suppressed The Medieval Warm Period

The now withdrawn Gergis paper proudly proclaimed in the abstract

The average reconstructed temperature anomaly in Australasia during A.D. 1238-1267, the warmest 30-year pre-instrumental period, is 0.09°C (±0.19°C) below 1961-1990 levels.

On this basis, Gergis was able to say

A preliminary assessment of the roles of solar, volcanic, and anthropogenic forcings and natural ocean–atmosphere variability is performed using CSIRO Mk3L model simulations and independent palaeoclimate records. Solar and volcanic forcing does not have a marked influence on reconstructed Australasian temperature variations, which appear to be masked by internal variability.

This conclusion is from a single rogue proxy – the coral proxy from Palmyra Atoll.

There were only three temperature proxies covering this medieval peak period. Both Mt. Read in Tasmania and Oroko in New Zealand are tree ring proxies that cover the entire millennium. The Palymyra Atoll coral proxy data covers just 398 years over 4 periods. These are 1151-1221, 1319-1465, 1637-1704 and 1888-1999. Following Gergis, I have calculated the decadal averages. Below is the plot from my pivot table for the three proxies.


I contend that Palmyra is distinctly “odd” due to the following.

  1. Nowhere in the world am I aware of a single instance of massive cooling during the early 13th Century. If not rogue data, the it must be a purely local phenomena.
  2. Nowhere in the world am I aware of a single instance of massive cooling during the 17th Century. Nor was I aware the early 17th century had significant warm period. If not rogue data, it must be a purely local phenomena.
  3. The Hadcrut3 global temperature set has slight cooling at the end of the 19th century / start of the 20th Century, and a warming period from 1910 to 1940 almost as large as the warming period from 1975 to 1998. If not rogue data, it must be a purely local phenomena.
  4. The post 1960 warming trend is phenomenal. In fact it makes the twentieth century warming trend the largest of all the 27 proxies. (See table “Analysis of the Proxies in Gergis et al. 2012” below)

For these three reasons it would appear to be an outlier. So what is the impact?

I looked at the decadal average of the two tree-ring proxies and ranked the hundred decades from 1 for the highest to 100 for the lowest. I then took the decadal average of the three tree-ring proxies and similarly ranked the results.

The change is the decadal ranking was as follows:-


The medieval warm period is suppressed, and the twentieth century is “enhanced”.

Now let us be clear. There were 24 other proxies in the data set. However, none of the others were prior to 1430. Therefore the impact on the overall ranking will not be quite so marked. However, the fact remains that the conclusion that last decade of the 20th century is the warmest of the millennium is based on this one rogue data set.

But there are two more reasons that the Palmyra data set should not have been included in the reconstruction.

Firstly, the Gergis paper was withdrawn upon the publication of the JeanS ‘Gergis Significance’ t-values. Unsurprisingly, Palmyra was one of the proxies that failed the t-test, so is a rogue data set. See table below.

Secondly, is geography. The study is a “temperature reconstruction for the combined land and oceanic region of Australasia (0°S-50°S, 110°E-180°E)“. Palmyra Atoll is located at 5°52′ N, 162°06′ W, or over 2100Km (1300 miles) outside the study area.

Conclusion.

The Palmyra Atoll coral proxy study is clearly an outlier statistically and geographically. In no way can it be considered a suitable proxy for the Australasia region, yet the major, headline, conclusion of the Gergis et al 2012 temperature reconstruction relied upon it.


Palmyra Atoll Coral Proxy in Gergis et al 2012

There is a lot of discussion on Bishop Hill (here and here) and Climate Audit of a new paper in Journal of Climate “Evidence of unusual late 20th century warming from an Australasian temperature reconstruction spanning the last millennium“, with lead author, Dr Joëlle Gergis. The reconstruction was based upon 27 climate proxies, one of which was a coral proxy from Palmyra Atoll.

There are two issues with this study.

Location

The study is a “temperature reconstruction for the combined land and oceanic region of Australasia (0°S-50°S, 110°E-180°E)“. The study lists Palmyra Atoll as being at 6° S, 162° E, so within the study area. Wikipedia has the location at 5°52′ N, 162°06′ W, or over 2100Km (1300 miles) outside the study area. On a similar basis, Rarotunga in the Cook Islands (for which there are two separate coral proxy studies), is listed as being at 21° S, 160° E. Again well within the study area. Wikipedia has the location at 21° 14′ 0″ S, 159° 47′ 0″ W, or about 2000Km (1250 miles) outside the study area. The error has occurred due to a table with columns headed “Lon (°E)”, and “Lat (°S). Along with the two ice core studies from Vostok Station, Antarctica (Over 3100km, 1900 miles south of 50° S) there are 5 of the 27 proxies that are significantly outside the region.

Temperature Reconstruction

Palmyra Atoll reconstruction is one of just three reconstructions that has any data before 1430. From the abstract, a conclusion was

The average reconstructed temperature anomaly in Australasia during A.D. 1238-1267, the warmest 30-year pre-instrumental period, is 0.09°C (±0.19°C) below 1961-1990 levels.

From the proxy matrix I have plotted the data.


This indicates a massive change in late twentieth century temperatures, with 1996 being the most extreme on record.

The other two data sets with pre-1430 data are tree ring proxies from Mount Read, Tasmania and Oroko, New Zealand. These I have plotted with a 30 year moving average, with the data point at the last year.


There is something not right with the Palmyra Atoll proxy. The late 20th century trend is far too extreme. In the next posting I will compare to some other coral data sets.

George Monbiot’s narrow definition of “charlatan”

Bishop Hill quotes George Monbiot

I define a charlatan as someone who won’t show you his records. This looks to me like a good [example]: http://t.co/5hDF57sI

Personally, I believe that for word definitions one should use a consensus of the leading experts in the field. My Shorter OED has the following definition that is more apt.

An empiric who pretends to wonderful knowledge or secrets.

Like John Cook’s definition of “skeptic“, Monbiot’s definition is narrower and partisan. Monbiot was referring to maverick weather forecaster Piers Corbyn. If someone has a “black box” that performs well under independent scrutiny, then they are charlatan under Monbiot’s definition, but not the OED’s. This could include the following.

  • A software manufacturer who does not reveal their computer code.
  • A pharmaceutical company that keeps secret the formulation of their wonder drug.
  • A soft drink manufacturer, who keeps their formulation secret. For instance Irn-Bru®.

The problem is that these examples have a common feature (that Piers Corbyn would claim to share to some extent). They have predictive effects that are replicated time and time again. A soft drink might just be the taste. Climate science cannot very well replicate the past, and predictions from climate models have failed to come about, even given their huge range of possible scenarios. This is an important point for any independent evaluation. The availability of the data or records matter not one iota. It is what these black boxes say about the real world that matters. I would claim that as empirical climate science becomes more sophisticated, no one person will be able to replicate a climate model. Publishing all the data and code, as Steve McIntyre would like, will make as much difference as publishing all the data and components of a mobile phone. Nobody will be able to replicate it. But it is possible to judge a scientific paper on what it says about the real world, either through predictions or independent statistical measures of data analysis.

Forcings – Hansen et al 2000 v UNIPCC 2007

Two months ago I did an analysis of aerosols in the UNIPCC AR4 report, observing that

  1. That the IPCC can’t add up.
  2. The figures appear contrived to show that only CO2 was the problem.

Anthony Watts has a posting today “Shocker: The Hansen/GISS team paper that says: “we argue that rapid warming in recent decades has been driven mainly by non-CO2 greenhouse gases“. This is based on the James Hansen (and others) paper analysing natural forcings, with the following graphic.


Hansen et al Figure 1: Estimated climate forcings between 1850 and 2000.

I thought that I would do a quick the comparison between what the IPCC were saying in 2007, with what Hansen et al. were saying in 2000.

According to the UNIPCC

  1. Hansen underestimated CO2 component.
  2. Hansen overestimated the CH4 component.
  3. Hansen overestimated the impact of the sun.

However, Hanson could counter that the UNIPCC have completely forgotten about the impact of volcanoes.

It could be completely coincidental, that further analysis by climate scientists gives a greater role to CO2, and therefore even stronger justification for constraining CO2 emissions. However, although they became more certain on positive forcings, they are less certain than Hansen on aerosols. It gives even greater credence to the cynical view that the climate science community are exaggerating the influence of anthropogenic forcings on climate. Given the billions of dollars annually being poured into research one could reasonably expect a reduction in the uncertainties over time.

Scottish Sceptic on summarizing the sceptic position

I came across the blog Scottish Sceptic at the weekend. At the site, the owner has been compiling a non-polemical summary of the mainstream sceptic view of the science. Unlike here, the statement studiously avoids discussion of policy or politics. I made the following comment in the hope of furthering discussion.

I have had a look through the above, and it appears a fair summary the sceptic position of the science. In general it shows how magnitude and likelihood go in opposite directions. The best corroborated science has trivial implications. The most alarming predictions are basically of the form “If A then maybe B. If B then possibly C. If C happens in a certain way then it could be D. D is an extremely alarming situation” This then gives the headline like

Leading scientists are concerned we are heading for D“.

Having read quite widely on sceptic ideas, on the subject of climate models, sceptics view them as “black boxes“. This would not be concerning if they followed the normal scientific procedure of rigorously evaluating the predictions with the actual data, and adjusting accordingly. Instead, it appears to be past data that gets adjusted to the models, along with some very fuzzy analysis.

Another point is that sceptics tend to see a scientific approach as questioning, identifying anomalies, and getting ever more precise answers. Mainstream climate science is nearer to a definition of “science is what scientists do”.

That leads to another point. Sceptics tend to demand higher levels of evidence. The mainstream seems to accept levels of evidence that a criminal court of law would reject. “Scientists believe/agree”, or “Climate Models predict” or comments a court would reject such views as either hearsay or unsubstantiated. So in the wider world sceptics are not the ones with the marginal position.

Richard Lindzen attacked for dissention

Rather than substantiating the weaknesses in their own case, the climate community is continuing their attack on the dissenters. The latest is in the New York Times on Prof Richard Lindzen of MIT. I have posted the following on Prof Roger Pielke Jnr’s blog

Having listened to some of Prof Lindzen’s speeches and read some of his more populist articles, this attack on him leaves out 2 things. First, it omits one of his favourite words “feedbacks”. Second it leaves out the scale of the difference. Lindzen claims agreement with mainstream scientists that a doubling of CO2, on its own, would raise temperatures by around 1.2 celsius. Whereas Lindzen claims evidence that cloud “feedbacks” more than halve the impact, the consensus of climate models such positive feedbacks of up to three times – with wide variation. The evidence supporting this is patchy, a message implicitly admitted in the article. The lack of substantiation in this key area is crucial. If makes the extreme warming claims uncertain. If one the looks at the expected economic costs of “doing nothing” (like the Stern Review) this uncertainty in the projections should carry a risk weighting.

As a comparison, I would direct readers to Prof Lindzen’s talk at the House of Commons in February of this year. On Youtube, a response here, and Lindzens rebuttal reply at the GWPF.

When the main effort is on silencing dissent, rather than substantiating their own case, it implies to me that the climate consensus has a weak case – and they know it.

John Redwood lights the “Global Warming” fuse again

John Redwood bravely touched on the global warming subject again in “Challenging establishment orthodoxies“.

One of the strange features of global warming theory is the reaction of its leading protagonists. They say it is scientifically derived, but then go on to say the science is proven and established. I thought the essence of scientific method was to reach a hypothesis that seemed to fit the facts, and then to keep trying to improve or destroy it by further testing or experiment. This seems to be a thesis where the aim is always to buttress it rather than test it. For many years scientists thought Newton had said the last word on planetary motion, but the twentieth century did not rest until they had replaced or improved on the Newtonian universe in a dramatic way.”

My comment (following from previous comments made on this blog) was

You will notice that whenever you mention “Global Warming” that you are guaranteed to get a greater number of comments compared to practically any other issue. Further the views are probably more polarized and politicized than any other issue.
However, the way to proceed might not be one of hypothesis testing. The data is complex and most of the science is about future events. Rather, it might be worth using the experience with which you are more familiar.
1. In business, a new investment proposal will just be assessed on the theoretical profits, but on the capacity to see that proposal through to actual success. The Stern Review allegedly gave the theory, but there was nothing on public policy issues of controlling policy costs, and maximizing policy benefits (CO2 benefits). Whatever the policy, this failure to focus and project management is a sure guarantee of policy disaster.
2. In politics, the greatest threat to extremist and untenable viewpoints has been from the majority who are able to compare these viewpoints to their other perspectives. That is why authoritarian regimes only can exist in an environment where they silence criticism. There is growing evidence of excluding contrary views without a fair hearing in our scientific institutions, in research funding, and in the mainstream media.
3. Science at the frontiers about making bold hypotheses that can be falsified by later testing. Similarly, the police in a crime investigation make conjectures and then gather evidence. Established science (on which policy should be based) is like a successful prosecution in a criminal case. It is about presenting the evidence and under-going a cross examination by the opponents. This to convince a randomly-selected group of people. My contention would be that the strongest evidence of catastrophic global warming is the most trivial, whilst the most alarming aspects of climate change are based on weak, circumstantial and hearsay evidence.

Two relevant references
https://manicbeancounter.com/2011/02/13/climate-change-in-perspective-%E2%80%93-part-2-of-4-the-mitigation-curve/
https://manicbeancounter.com/2012/02/20/a-climate-change-global-warming-spectrum/