Base Orcadas as a Proxy for early Twentieth Century Antarctic Temperature Trends

Temperature trends vary greatly across different parts of the globe, an aspect that is not recognized when homogenizing temperatures. At a top level NASA GISS usefully split their global temperature anomaly into eight bands of latitude. I have graphed the five year moving averages for each band, along with the Gistemp global anomaly in Figure 1.

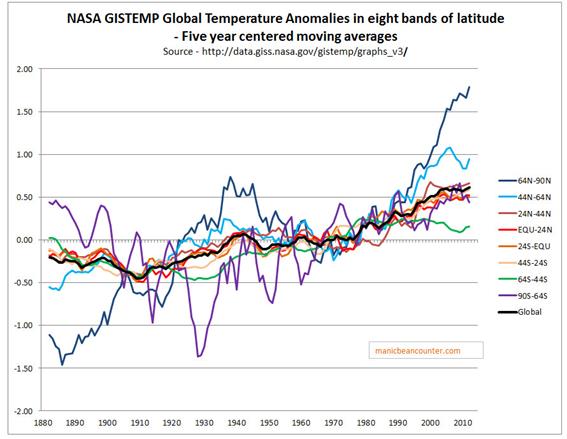
Figure 1. Gistemp global temperature anomalies by band of latitude.

The biggest oddity is the 64S-90S band. This bottom slice of the globe roughly equates to Antarctica, which is South of 66°34′S. Not only was there massive cooling until 1930 – in contradiction to the global trend – but prior to the 1970 was very large volatility in temperatures, despite my using five year moving averages. Looking at the GHCN database of weather stations, there none listed in Antarctica until Rothera point started collecting data in 1946, as shown in Figure 21.

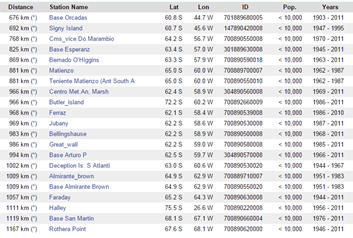
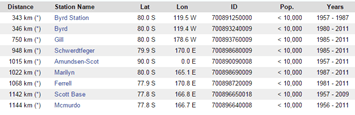
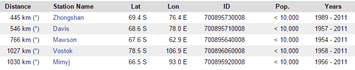
Figure 2. A selection of temperature anomalies in the Antarctica. The most numerous are either on the Antarctic Pennisula, or the islands just to the North.

The only long record is at Base Orcadas located at (60.8 S 44.7 W). I have graphed the GISS homogenised temperature anomaly data for station 701889680000 with the Gistemp 64S-90S band in Figure 3.

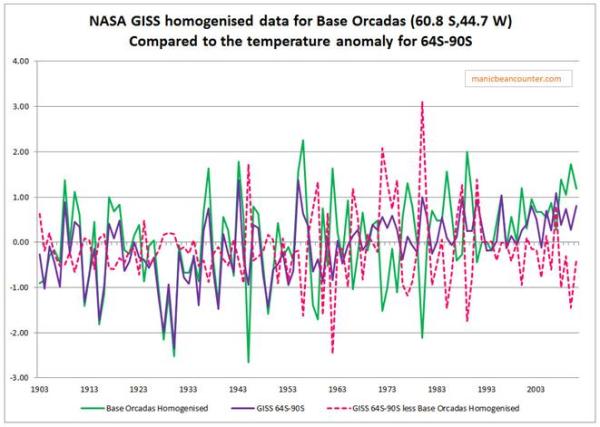
Figure 3. Gistemp 64S-90S annual temperature anomaly compared to Base Orcadas GISS homogenised data.

There is a remarkable similarity in the data sets until 1950, after which they appear unrelated. This suggests that in the absence of other data, Base Orcadas was the principle element in creating a proxy for the missing Antarctic data, despite it being located outside the area, and not being related to the actual data for well over half a century. The outcome is to bias the overall global temperature anomaly by suppressing the early twentieth century warming, making the late twentieth century warming appear relatively greater than is the underlying reality2. The error is due to assuming that temperature trends are the same at different latitudes are the same, an assumption that the homogenised data shows to be false.

Kevin Marshall


Notes

  1. Also in Antarctica (but not listed) there has been data collected at Amundsen-Scot base at the South Pole (90.0 S 0.0 E) since 1957, and at Vostok base (78.5 S 106.9 E) since 1958.
  2. Removing the Antarctic data would increase both the early twentieth century and post 1975 warming periods. But, given that 64S-90S is 5% of the global surface area, I estimate it would increase the earlier warming trends by 5-10% as against 1-3% for the later trend.


Esper et al 2012 Orbital forcing of tree-ring data – Corroborating the Sceptic Position

A new summer temperature reconstruction using of tree ring densities in Northern Scandinavia stir, raising some difficult questions for those who believe that C20th warming was caused by human activity

There are a couple of elements that corroborate sceptical beliefs that are not alluded to elsewhere.

Pointer to a low influence of CO2

There has been a decline in summer temperatures of 0.6 degrees.


From the abstract

Solar insolation changes, resulting from long-term oscillations of orbital configurations1, are an important driver of Holocene climate23. The forcing is substantial over the past 2,000 years, up to four times as large as the 1.6 W m−2 net anthropogenic forcing since 1750

That is (From the supplementary information figure S13), a decline in temperatures of around 0.6 Celsius is due to a net reduction in orbital forcings of 6 W m−2.

From a 1998 article by Sherwood Idso* on climate sensitivities,

a total greenhouse warming of approximately 33.6°C sustained by a thermal radiative flux of approximately 348 W m–2

That is 6 W m−2 gives approximately 0.6 degrees temperature change. This implies 1.6 W m−2 gives approximately a 0.16 degree temperature change, so CO2 is not the largest influence on C20th warming.

Pointer to the global temperature adjustments being wrong

Yesterday I reblogged pieces of evidence by Steven Goddard indicating that the historical temperature record has been systematically manipulated. In particular, the inter-war warming has been reduced, whilst recent warming has been increased. From the paper, this abstract of the more recent warming trends.

Now compare with two versions of the Reykjavik mean temperatures to see which is closer. I know that Reykjavik is between 50 and 350 miles south of the area surveyed, but it does seem to corroborate one version over the other.

A possible alternative explanation to the lower late C20th temperatures  is in the comments at NoTricksZone. DirkH says

The line actually becomes unreliable from 1912 to the present as it is done with a “100 year spline filter” the paper says. Don’t give to much on the shape of the final wiggle. Can’t find any more information but obviously the window for the filter shrinks near the end, how will it react? Dunno…

Hu McCulloch ain’t too impressed: (2009)

http://climateaudit.org/2009/08/23/spline-smoothing/

*Joanna Nova has a summary here.

Mid-Pacific Coral temperature proxies from Gergis et al. 2012

How odd is the Palmyra Atoll Coral Proxy?

In the last post I noted that there was something odd about the Palmyra proxy used in the Gergis paper, particularly in the late 20th century. This is at 5°52′ N, 162°06′ W.

There are four other coral proxies in the Mid-Pacific area. There are two proxy studies from
Rarotonga in the Cook Islands at 21° 14′ 0″ S, 159° 47′ 0″ W and two from the Fiji. For all five proxies I calculated a nine year centred moving average.


Palmyra shows a late 20th century warming trend more than twice that of the other series. Unless there is a locally recorded temperature anomaly on the atoll, then this is clearly wrong. If there is a local temperature spike, then it one should question why it is included in a reconstruction for which it is over 2000km outside the boundary. Either way it should be deleted from the study.

So how reliable are coral proxies. Here we have two pairs. If they are a good proxy for temperature, then they should be a good proxy for each other. On Fiji, they studies be less than 150km apart and on Rarotonga less than 10km apart, meaning they should be near identical. So I have plotted the differences between the moving averages.


It is not a statistically sound method, but indicative of the real issues with the proxy data sets. It also seems that the further back, the greater the consistency. The Palmyra study has four sections, the oldest of which starts in the 12th Century. Although Gergis claims to have done a series of tests for robustness, there is no correlation test over the known temperature record. Given that a central conclusion is:-

The average reconstructed temperature anomaly in Australasia during A.D. 1238-1267, the warmest 30-year pre-instrumental period, is 0.09°C (±0.19°C) below 1961-1990 levels.

Given that there is some question of the selection of the ice core studies at Vostok in preference for the closer and more robust studies at Ice Dome, then central conclusion of the study is not credible on such a small number of proxies.

Palmyra Atoll Coral Proxy in Gergis et al 2012

There is a lot of discussion on Bishop Hill (here and here) and Climate Audit of a new paper in Journal of Climate “Evidence of unusual late 20th century warming from an Australasian temperature reconstruction spanning the last millennium“, with lead author, Dr Joëlle Gergis. The reconstruction was based upon 27 climate proxies, one of which was a coral proxy from Palmyra Atoll.

There are two issues with this study.

Location

The study is a “temperature reconstruction for the combined land and oceanic region of Australasia (0°S-50°S, 110°E-180°E)“. The study lists Palmyra Atoll as being at 6° S, 162° E, so within the study area. Wikipedia has the location at 5°52′ N, 162°06′ W, or over 2100Km (1300 miles) outside the study area. On a similar basis, Rarotunga in the Cook Islands (for which there are two separate coral proxy studies), is listed as being at 21° S, 160° E. Again well within the study area. Wikipedia has the location at 21° 14′ 0″ S, 159° 47′ 0″ W, or about 2000Km (1250 miles) outside the study area. The error has occurred due to a table with columns headed “Lon (°E)”, and “Lat (°S). Along with the two ice core studies from Vostok Station, Antarctica (Over 3100km, 1900 miles south of 50° S) there are 5 of the 27 proxies that are significantly outside the region.

Temperature Reconstruction

Palmyra Atoll reconstruction is one of just three reconstructions that has any data before 1430. From the abstract, a conclusion was

The average reconstructed temperature anomaly in Australasia during A.D. 1238-1267, the warmest 30-year pre-instrumental period, is 0.09°C (±0.19°C) below 1961-1990 levels.

From the proxy matrix I have plotted the data.


This indicates a massive change in late twentieth century temperatures, with 1996 being the most extreme on record.

The other two data sets with pre-1430 data are tree ring proxies from Mount Read, Tasmania and Oroko, New Zealand. These I have plotted with a 30 year moving average, with the data point at the last year.


There is something not right with the Palmyra Atoll proxy. The late 20th century trend is far too extreme. In the next posting I will compare to some other coral data sets.