The following is a comment to be posted at Bishop Hill, responding to another attempt by blogger ….andThenThere’sPhysics to undermine the work of Bjorn Lomborg. The previous attempt was discussed here. This post includes a number of links, as well as a couple of illustrative screen captures at the foot of the table.
aTTP’s comment is
In fact, you should read Joe Romm’s post about this. He’s showing that the INDCs are likely to lead to around 3.5C which I think is relative to something like the 1860-1880 mean. This is very similar to the MIT’s 3.7, and quite a bit lower than the RCP8.5 of around 4.5C. So, yes, we all know that the INDCs are not going to do as much as some might like, but the impact is likely to be a good deal greater than that implied by Lomborg who has essentially assumed that we get to 2030 and then simply give up.
Nov 11, 2015 at 9:31 AM | …and Then There’s Physics
My Comment
aTTP at 9.31 refers to Joe Romm’s blog post of Nov 3 “Misleading U.N. Report Confuses Media On Paris Climate Talks“. Romm uses Climate Interactive’s Climate Scoreboard Tool to show the INDC submissions (if fully implemented) will result in 3.5°C as against the 4.5°C in the non-policy “No Action” Scenario. This is six times the claimed maximum impact of 0.17°C claimed in Lomberg’s new paper. Who is right? What struck me first was that Romm’s first graph, copied straight from the Climate Interactive’s seem to have a very large estimate for emissions in the “No Action” Scenario producing. Downloading the underlying data, I find the “No Action” global emissions in 2100 are 139.3 GtCO2e, compared with about 110 GtCO2e in Figure SPM5(a) of the AR5 Synthesis Report for the RCP8.5 scenario high emissions scenario. But it is the breakdown per country or region that matters.
For the USA, without action emissions are forecast to rise from 2010 to 2030 by 40%, in contrast to a rise of just 9% in the period 1990 to 2010. It is likely that emissions will fall without policy and will be no higher in 2100 than in 2010. The “no action” scenario overestimates 2030 emissions by 2-3 GtCO2e in 2030 and about 7-8 GtCO2e in 2100.
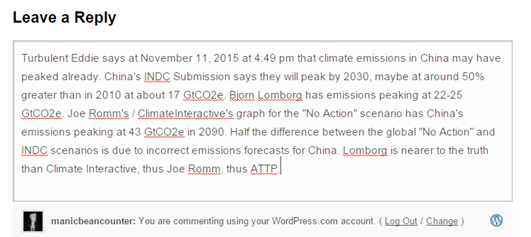
For the China the overestimation is even greater. Emissions will peak during the next decade as China fully industrializes, just as emissions peaked in most European countries in the 1970s and 1980s. Climate Interactive assumes that emissions will peak at 43 GtCO2e in 2090, whereas other estimates that the emissions peak will be around 16-17 GtCO2e before 2030.
Together, overestimations of the US and China’s “No Action” scenarios account for over half 55-60 GtCO2e 2100 emissions difference between the “No Action” and “Current INDC” scenarios. A very old IT term applies here – GIGO. If aTTP had actually checked the underlying assumptions he would realise that Romm’s rebuttal of Lomborg based on China’s emission assumptions (and repeated on his own blog) are as false as claiming that the availability of free condoms is why population peaks.
Links posted at https://manicbeancounter.com/2015/11/11/attp-falsely-attacks-bjorn-lomborgs-impact-of-current-climate-proposals-paper/
Kevin Marshall
Figures referred to (but not referenced) in the comment above
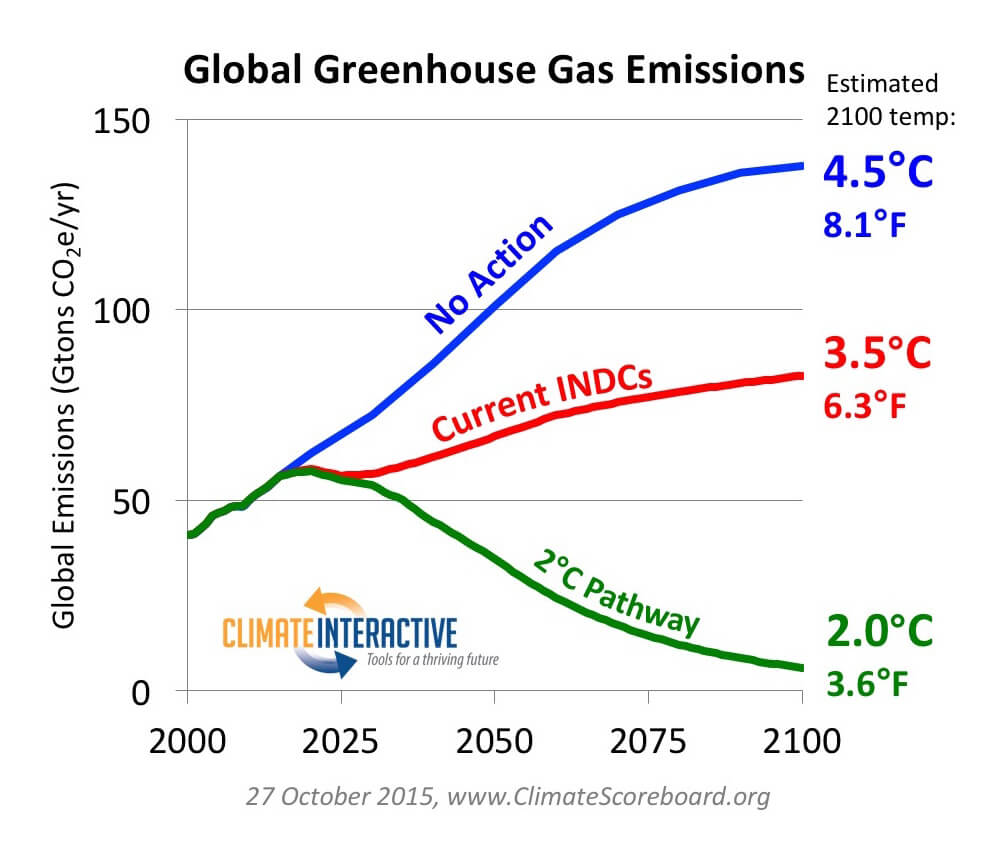
Figure 1: Climate Interactive’s graph, referenced by Joe Romm.
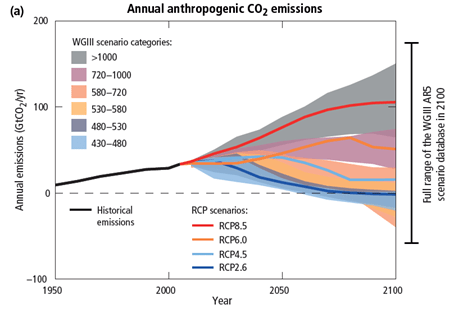
Figure 2: Reproduction of Figure SPM5(a) from Page 9 of the AR5 Synthesis Report.
Update – posted the following to ATTP’s blog