IPCC AR5 Synthesis Report Presentation Miscalculated the Emissions for 2C of Warming

In a previous post I mistakenly claimed that the Ladybird Book on Climate Change (lead author HRH The Prince of Wales) had incorrectly interpreted the AR5 IPCC Synthesis Report in its egg-timer. It is the IPCC that is at fault.
In 2014 the IPCC produced a simplified presentation of 35 slides to summarize the AR5 Synthesis Report Summary for policy makers. A quick summary of a summary of the synthesis report.

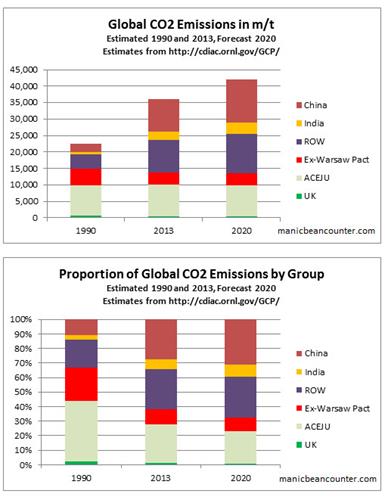
Slide 30 on Limiting Temperature Increase to 2C, clearly states that it is global reductions in greenhouse gas emissions that are needed.


The Ladybird egg-timer is adapted from slide 33 of 35.

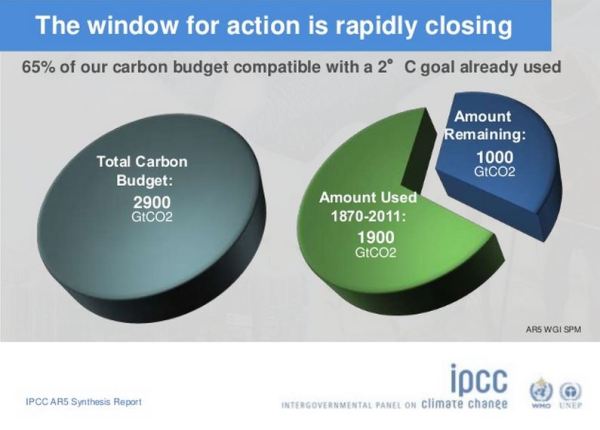
As a (slightly manic) beancounter I like to reconcile the figures. How are the 1900 GtCO2 and the 1000 GtCO2 arrived at? It could be that it is GtCO2e, like the throughout the synthesis report, where other greenhouse gases are recast in terms of CO2, which accounts for well over half of the warming from trace gases.

Some assumptions for my quick calculations.

1. A doubling of CO2 will lead to a warming of 3C. This was the central estimate of the Charney Report 1979 (pdf), along with all five of the UNIPCC assessment reports.
2. If the pre-industrial level of CO2 was 280ppm, the dangerous 2C of warming will be reached at 445ppm. Rounded this is 450ppm.
3. In 2011 the Mauna Loa CO2 level was 391.63 ppm.
4. Using the CDIAC World CO2 emission figures, gives the following figures for billions of tonnes of CO2 to achieve a 1ppm rise in CO2 levelsin the graph below. In the five years to 2011 on average it took 17.02 billion tonnes of CO2 to raise CO2 levels by 1 ppm. Lets round it to 17.

Now some quick calculations.
Start with 280ppm
Add 111.76 (=1900/17) gives 391.76. Pretty close to the CO2 level in 2011 of 391.63ppm
Add 58.82 (=1000/17) gives 450.58. Given rounding, this pretty close to 450ppm.

There are problems with these calculations.

  • The estimate of 17 GtCO2e is on the high side. The World CO2 emissions from the CDIAC National Emissions spreadsheet gives a sum of 1069.68 GtCO2 from 1960 to 2011, against a rise in CO2 of 74.72 ppm. That is 14.3 GtCO2e over the whole period. Since 2011 there has been a drop towards this long-term average.
  • The Ladybird Book, like the UNFCCC at COP21 Paris December 2015 talks about restraining emissions to 1.5C. If a doubling of CO2 leads to 3.000C of warming then going from 280ppm to 401ppm (the average level in 2015) will eventually 1.555C of warming. This is a tacit admission that climate sensitivity is vastly overstated.
  • But the biggest error of all is that CO2 is only the major greenhouse gas (if you forget about water vapour). It might be the majority of the warming impact and two-thirds of emissions, but it is not all the warming impact according to theory. That alone would indicate that climate sensitivity was 2 instead of 3. But actual warming from 1780 to 2011 was less than 1C, against the 1C from CO2 alone if CS=2. That indicates that CS ≈ 1.3. But not all of the warming in the last 230 years has been due to changes in GHG levels. There was also recovery from the Little Ice Age. Worst of all for climate alarmism is the divergence problem. In this century the rate of warming should have increased as the rate of CO2 levels increased, in turn due to an increase in the rate of rise in CO2 emissions. But warming stopped. Even with the impact of a strong El Nino, the rate of warming slowed dramatically.


Conclusion

The IPCC calculated their figures for 1000 billion tonnes of CO2 emissions for 2C of warming based on CO2 being the only greenhouse gas and a doubling of CO2 levels producing 3C of warming. On that basis 401ppm CO2 level should produce >1.5C of warming. Add in other greenhouse gases and we are in for 2C of warming without any more greenhouse gas emissions. It is only if climate sensitivity is much lower is it theoretically possible to prevent 2C of warming by drastically reducing global CO2 emissions. The IPCC, have concocted figures knowing that they do not reconcile back to their assumptions.

The questions arise are (a) where do the cumulative emissions figures come from? and (b) whether the UNIPCCC has copied these blatant errors in the COP processes?

This is an extended version of a comment made a Paul Homewoods’ notalotofpeopleknowthat blog.

Kevin Marshall

Britain’s Folly in Attempting to Save the World from Global Warming

Last week in the House of Lords1 Viscount Ridley asked Baroness Verma, a minister at the Department of Energy and Climate Change, about the hiatus in global warming. Lord Ridley asked Lady Verma

Would you give us the opinion of your scientific advisers as to when this hiatus is likely to end.

Lady Verma replied

It may have slowed down, but that is a good thing. It could well be that some of the measures we are taking today is helping that to occur.

I already commented at Bishop Hill – repeated by James Delingpole

From 1990 to 2013 global emissions increased by 61%. Of that increase, 67% was from China & India. This is not surprising as they were both growing fast from a low base, and combined contain nearly 40% of global population. The UK, with less than 1% of global population managed to decrease its emissions by 19%. In doing so, they managed to offset nearly 1.2% of the combined increase in China & India.

However this is not the full story, particularly with respect to understanding future emissions growth. Here I extend the analysis of the CDIAC data set2 to give a more comprehensive picture. CDIAC (Carbon Dioxide Information Analysis Centre) have estimates of CO2 emissions in tonnes of carbon equivalent for all countries from 1960 to 2013. These I have split out the countries of India, China and UK. The rest I have lumped into three groups – The major developed ACEJU countries3, the Ex-Warsaw Pact countries4 and ROW5 (Rest of the World). For emissions I have taken the baseline year of 1990, the latest year of 2013 and then forecast emissions for 20206.

The major developed economies have virtually unchanged, although, along with the UK the proportion of global emissions has fallen from 45% to 28% between 1990 and 2013 and are forecasted to fall further to 23% of global emissions even without aggressive emission reduction policies.

The collapse of communism meant the collective emissions of the Ex-Warsaw Pact countries fell by 44% between 1988 and 1999. That in 2020 emissions levels will still be around 20% lower, even though the economies will be far richer, is due to the inefficiencies of the Communist system.

China and India had most of the emissions growth between 1990 and 2013, there emissions growing by 300% and 250% respectively. That growth was equivalent to 16 times the UK emissions in 1990. By 2020 China and India’s emissions growth over 30 years is likely to have cancelled out the UK’s 30% reduction 78 times over. That forecast emissions increase from 1990 to 2020 is also a third larger than the combined 1990 emissions of the major rich countries.

Finally there is the ROW countries, nearly half the World’s population now live and where emissions increased by 130% between 1990 and 2013.

To put these figures in context, we need to look at population figures, which are available from the World Bank7.

The big CO2 emitters in 1990 were the First and Second World countries. Over two-thirds of global emissions were produced by a quarter of the population. Those same countries now produce 40% of global emissions and have 20% of the global population. The population has grown, but only by 10%. In some of the countries it is already falling. China’s population grew by 20%, India’s by 44% and the Rest of the World by 55%, giving a global population growth of 35%. Looking at CO2 emissions in tonnes per capita puts the CO2 emissions problem into perspective.

China started from an extremely low base in terms of emissions per capita. It is unlikely to exceed the rich world’s 1990 emissions per capita in the next 10 years. However, due to slower population growth and its current stage of development, it is unlikely to be the major source of emissions growth through to 2050. It is likely to be overtaken by India, who in turn will be overtaken by the rest of the world before the end of the century. Unless very cheap non-CO2 emitting sources of energy are developed, global emissions will continue to grow. That emissions growth will be the result of genuine economic growth that will see grinding poverty disappear from every country that embraces the modern world.

The UK with less than 1% of the world’s population will continue to have no impact at all despite all the hype of having the World’s “greenest” energy policies. Even if the scariest scenarios of Lord Stern’s nightmares are true, there is absolutely no reason to continue with policies that are pushing ever greater numbers into fuel poverty and jeopardizing security of energy supply. The future impacts will be just the same, but with current policy, Britons will meet that future poorer than without. The British Government is like a doctor that prescribes useless medicine in the knowledge that it has nasty side effects. Most would agree that a GP who did that to a patient should be struck off, even if it were one patient in hundreds.

For the people who still genuinely believe that increasing CO2 emissions will cause catastrophic climate change there are two causes of action. First is to find a plentiful source of non-polluting energy where the full costs are less than coal, but just as reliable. There is genuine pollution from coal in the form of smog, so everyone should be in support of this. Shale gas, then thorium nuclear reactors might be a ways forward in the next few decades. Second is to far more accurately predict the catastrophic consequences of global warming, so adaptation can be made at minimal cost and waste of resources. Every prediction of short term catastrophe (e.g. worsening hurricanes) or a worsening situation (e.g. accelerating sea level rise) has proved to be false, hence the reliance on noisy publicists and political activists that discourage learning from past mistakes.


Please note that first time comments are moderated. I welcome debate. Please use the comments as a point of contact, with a request not to publish.

Kevin Marshall

Notes

  1. As reported by James Delingpole at Brietbart. Also reported at The Daily Mail, Bishop Hill, and Not a Lot of People Know That here and here.
  2. CDIAC is the Carbon Dioxide Information Analysis Centre. The 2014 Budget 1.0 contains estimates of CO2 emissions in tonnes of carbon equivalent for all countries from 1960 to 2013. I have converted the figures to tonnes of CO2.
  3. Australia, Canada, EU (the Western European 15, less UK), Japan and USA. This is most of what used to be called “First World”.
  4. This includes the former USSR countries, plus Eastern Europe. I have added in North Korea, Yugoslavia and Cuba.
  5. By definition this includes Central and South America, Africa, Middle East and South East Asia.
  6. Britain has committed to reduce its emissions by 30% of 1990 levels by 2020. China has pledged to “Reduce CO2 emissions per unit of GDP by 40–45% by 2020 compared to the 2005 level”. I assume 8% GDP growth and achieving a full 45% reduction, which is achievable. Similarly India has pledged to Reduce CO2 emissions per unit of GDP by 20–25% by 2020 compared to the 2005 level. Although it is unlikely to be achieved, based on emissions growth from 2005-2013, I have a assumed 7% GDP growth and achieving a minimum 20% reduction. For the other countries I have assumed half the emissions change from 1999-2013. This is likely to be an underestimate, as many other economies are growing emissions are a fast annual rate. For them this assumes a much reduced growth rate. Also many developed economies, particularly in Southern European showed sharp drops in emissions along with GDP in the credit crunch. They are now emerging, so should be expected to have higher emission growth rates.
  7. The 2020 population figures are assuming that each country’s population will change in the next seven years by the same number that it did in the previous seven. As world population growth in slowing, this might be a reasonable estimate. The result is a population increase of 550 million to 7,675 million.