Confirmation that Labour cannot win a General Election

My previous post looked at the implications of the May European Election Results for a future General Election. At Capx Matt Singh takes a similar approach in Does first past the post still favour Labour and the Tories? https://capx.co/does-first-past-the-post-still-favour-labour-and-the-tories/
The conclusions are slightly different to my own but it is worth comparing and contrasting Singh’s analysis and my own.

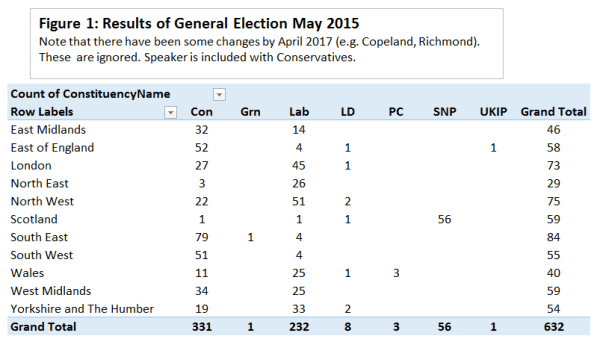
Matt Singh just looks at the May results, whereas I also look at the 2014 European Election results and the following General Elections in 2015 and 2017. This is my Figure 1

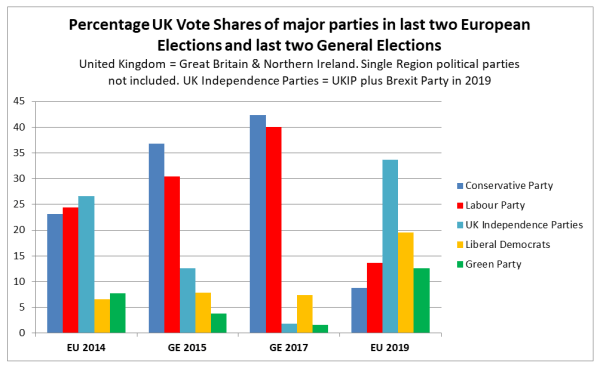
Fig 1 : Vote share of major parties in four recent UK elections

Matt Singh concentrates on the current polling data showing the four parties on roughly equal voter share. I agree with his statement

(O)n current vote shares, no party would be anywhere near an overall majority. If we put all four main parties on 21 per cent, the assumptions detailed above would put Labour on around 180 seats, the Brexit Party on around 160 seats, the Lib Dems on roughly 130, the Conservatives down to about 100 and the SNP in the 50s.

That is on equal vote shares the Labour Party would gain the most seats, with the Conservatives the least. Further, I agree that for the two major parties …..

…. dropping too far into the teens could see Labour or Tories being decimated, with seat numbers dropping into the double digits. Labour would have a degree of protection, because its enormous majorities in its safest seats would save it in many cases. But the Tories really would be staring into the abyss.

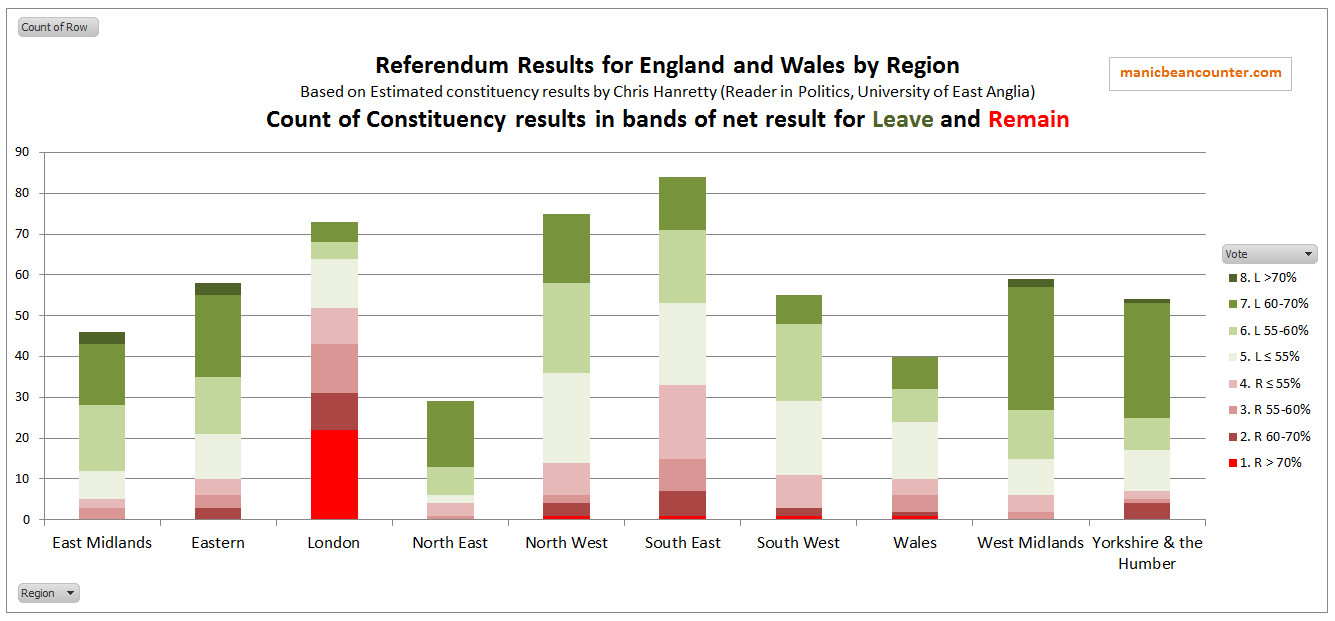
I also looked at the council area results by four or five regions of Great Britain. That is Northern England, Midlands/Wales, Southern England, London, and Scotland. The latter two I lumped together as they had stood as out as sharing opinions on Brexit different from the other regions.

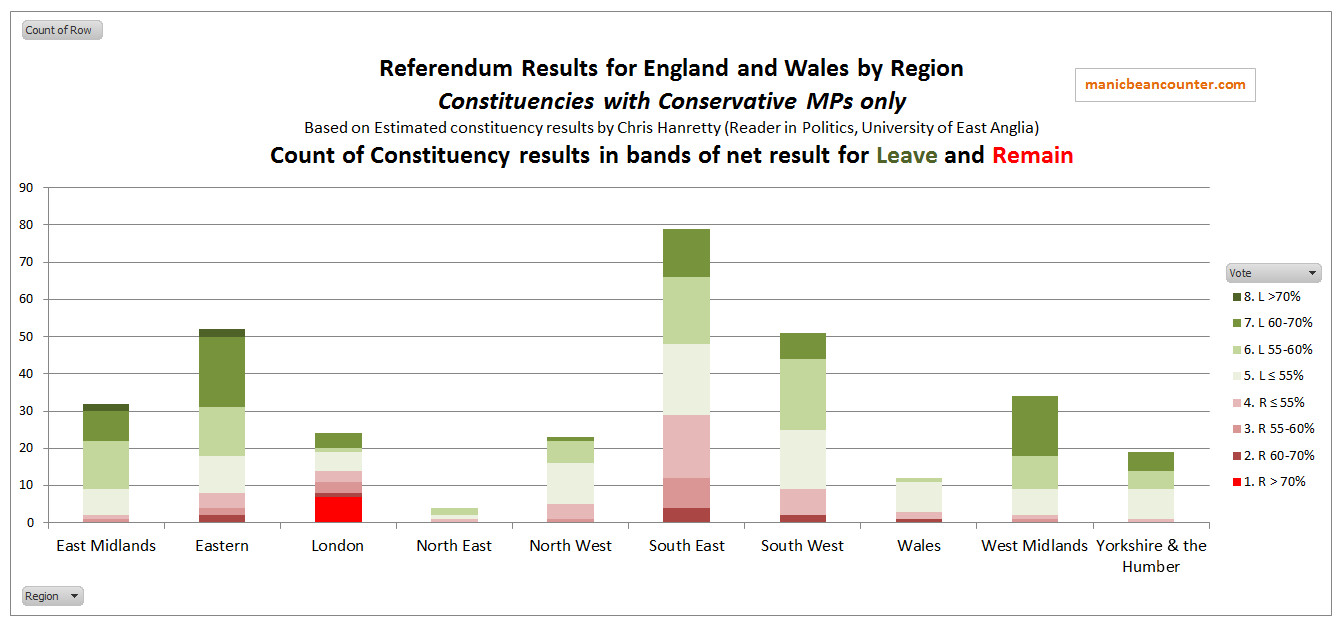
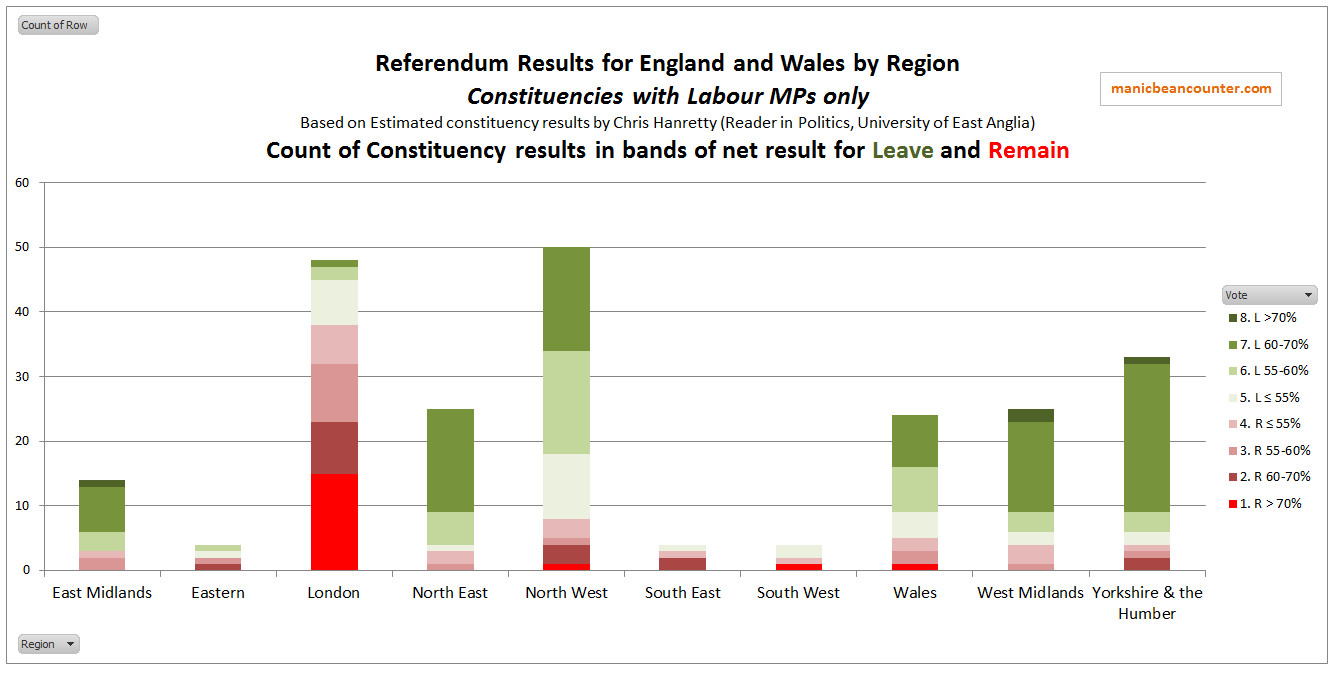
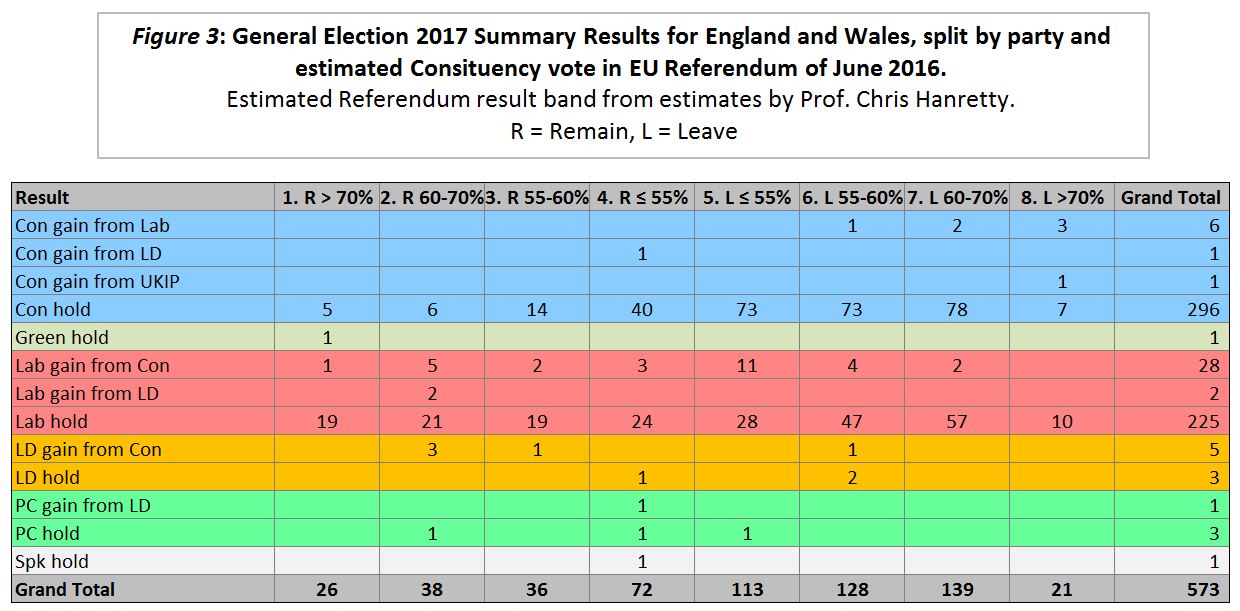
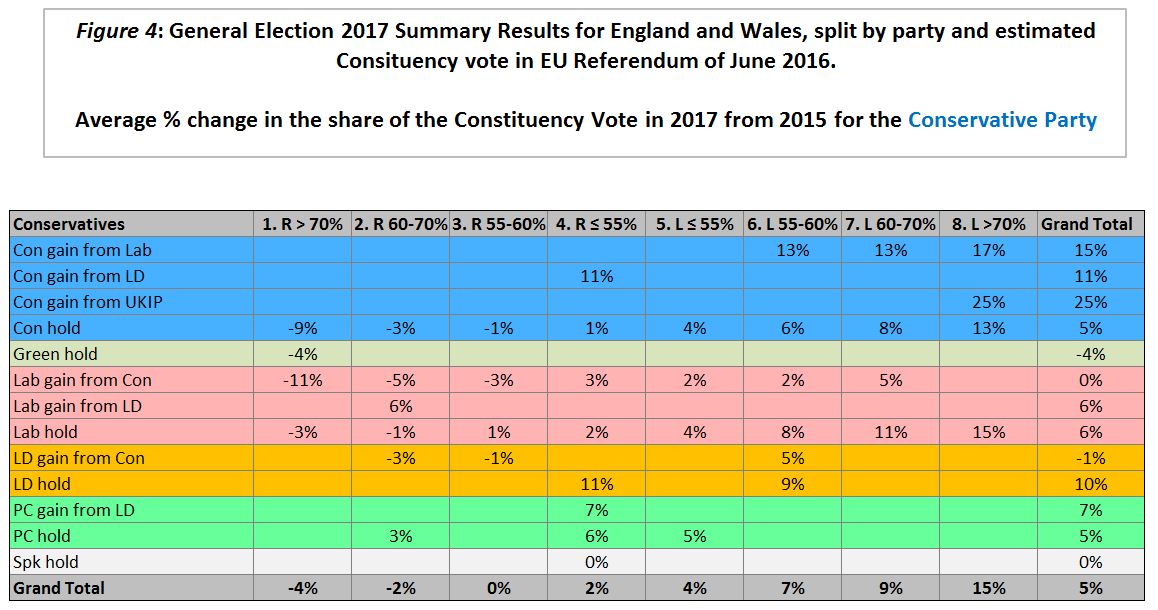
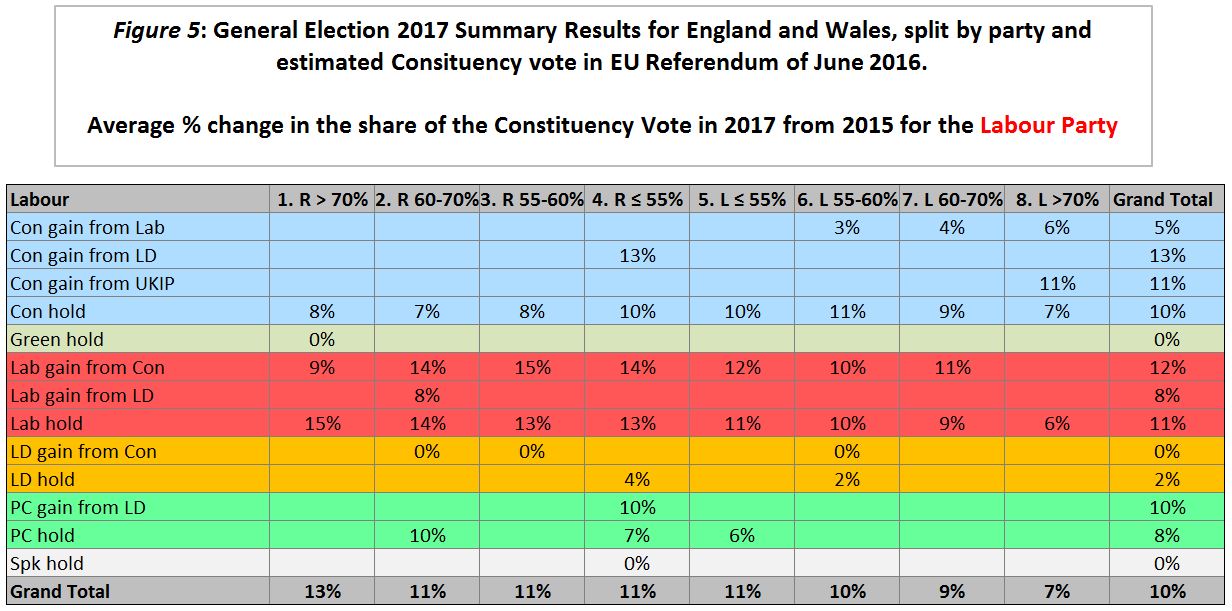
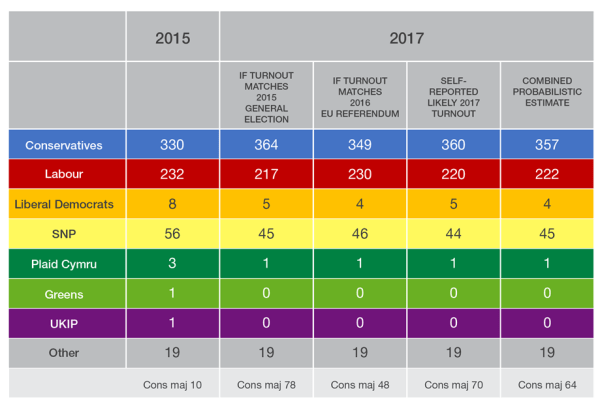
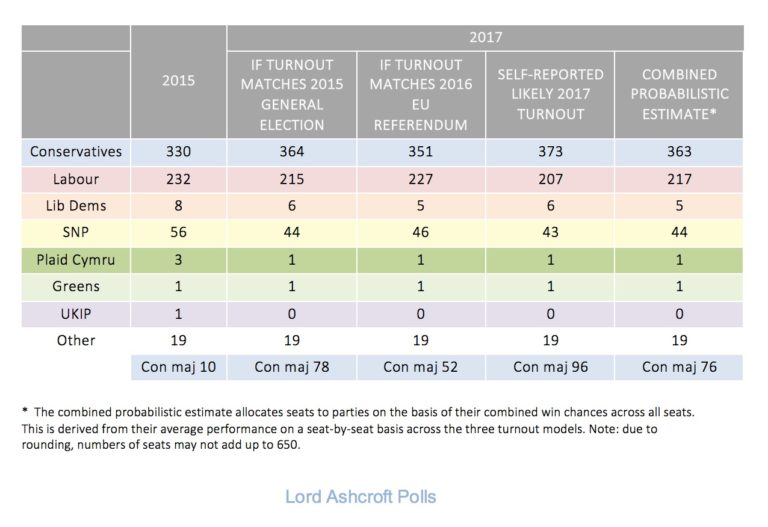
Matt Singh used data from Professor Chris Hanretty, who has estimated the European election results by constituency from the results by council. The two key tables, (under the banner of Number Cruncher Politics) are as follows

Fig 2 : From the Capx.co article
Fig 3 : From the Capx.co article

These two charts show why the Tories are more vulnerable to a complete meltdown than Labour, as the latter have much stronger support in the ninth and tenth deciles. Singh does not draw the corollary conclusion. That is, based in even swings, to form a majority Government the Tories need to achieve a lower national vote share than Labour to achieve an overall Parliamentary majority. This is important. Hanretty’s charts are with 2019 UK vote shares of 9.1% for Conservative and 14.1% for Labour. To win a General election majority it is important to be ahead of the major opposition in the 5th and 6th deciles. In these areas, Labour were behind the Conservatives in the EU elections despite the 5 point lead overall. In addition, I attempted to go beyond the numbers to look at the impact of positions on Brexit. Both the Conservatives and Labour were punished in the Euro Elections for their vague positions on Brexit. The Conservatives for failing to exit the EU due to the failure to obtain anywhere near majority on the Withdrawl Agreement. Labour for being nominally pro-Brexit, but putting on onerous conditions that would see Britain end up remaining in the EU. Both parties lost out to those Parties with much more strident positions on Brexit. The Conservatives lost out mostly to the Brexit Party. Labour lost out to the Pro-Remain Liberal Democrats and the Green Party, along with the Plaid Cymru in Wales and the SNP in Scotland. The Conservatives lost out to Remain parties less than Labour lost out to the Brexit Party. In the last week, Boris Johnson – likely the next Prime Minister – has come out with a strong pro-Leave position that would grab votes from the Brexit Party in a General Election. Conversely, the Labour Party leadership is divided over whether to make Labour a Pro-Remain Party. If it did, Labour might gain some votes from a number of Remain parties but would lose votes to the Brexit Party, or the Conservatives. The Tories are thus in a much better position to achieve the 30% vote share / 10 point lead to win an election than Labour.

Kevin Marshall

Leave EU Facebook Overspending and the Brexit Result

Last week an Independent article claimed

Brexit: Leave ‘very likely’ won EU referendum due to illegal overspending, says Oxford professor’s evidence to High Court

The article began

It is “very likely” that the UK voted for Brexit because of illegal overspending by the Vote Leave campaign, according to an Oxford professor’s evidence to the High Court.

Professor Philip Howard, director of the Oxford Internet Institute, at the university, said: “My professional opinion is that it is very likely that the excessive spending by Vote Leave altered the result of the referendum.
“A swing of just 634,751 people would have been enough to secure victory for Remain.
“Given the scale of the online advertising achieved with the excess spending, combined with conservative estimates on voter modelling, I estimate that Vote Leave converted the voting intentions of over 800,000 voters in the final days of the campaign as a result of the overspend.”

Is the estimate conservative? Anthony Masters, a Statistical Ambassador for the Royal Statistical Society, questions the statistics in the Spectator. The 800,000 was based upon 80 million Facebook users, 10% of whom clicked in on the advert. Of those clicking, 10% changed their minds.

Masters gave some amplification on in a follow-up blog post Did Vote Leave’s overspending cause their victory?
The reasons for doubting the “conservative” figures are multiple, including
– There were not 80 million voters on Facebook. Of the 46 million voters, at most only 25.6 million had Facebook accounts.
– Click through rate for ads is far less than 10%. In UK in 2016 it was estimated at 0.5%.
– Advertising is not the source of campaigning. It is not even viewed as the primary source, merely bolstering other parts of a campaign through awareness and presence.
– 10% of those reading the advert changing their minds is unlikely. Evidence is far less.
Anthony Masters concludes the Spectator piece by using Professor Howard’s own published criteria.

Prof Howard’s 2005 book, New Media Campaigns and the Managed Citizen, also argues that we should apply a different calculation to that submitted to the High Court. His book says to apply a one per cent click-through rate, where 10 per cent “believe” what they read; and of that 10 per cent act. This ‘belief’ stage appears to have been omitted in the High Court submission’s final calculation. Using these rates, this calculation turns 25.6 million people into 2,560 changed votes – hardly enough to have swung the referendum for Leave, given that their margin of victory was over a million votes. If we share a belief in accuracy, this erroneous claim should have limited reach.

There is further evidence that runs contrary to Prof Howard’s claims.

1. The Polls
To evaluate the statistical evidence for a conjecture – particularly for a contentious and opinionated issue like Brexit – I believe one needs to look at the wider context. If a Facebook campaign swung the Referendum campaign in the final few days from Remain to Leave, then there should be evidence of a swing in the polls. In the blog article Masters raised three graphs based on the polls that contradict this swing. It would appear that through the four weeks of the official campaign the Remain / Leave split was fairly consistent on a poll of polls basis. From analysis by pollster YouGov, the Leave share peaked on 13th June – ten days before the referendum. The third graphic, from a statistical analysis from the LSE, provides the clearest evidence.

The peak was just three days before the murder of MP Jo Cox by Tommy Mair. Jo Cox was a Remain campaigner, whilst it was reported that the attacker shouted slogans like “Britain First”. The shift in the polls could have been influenced by the glowing tributes to the murdered MP, alongside the speculation of the vile motives a clear Vote Leave supporter. That Jo Cox’s murder should have had no influence, especially when campaigning was suspended as a result of the murder, does not seem credible.

On Twitter, Anthony Masters also pointed to a question in Lord Ashcroft’s poll carried out on the day of the referendum – How the United Kingdom voted on Thursday… and why to a graphic that looked at when people had decided which way to vote. At most 16% of leave voters made up their minds in the last few days, slightly less than the 18% who voted remain.

The same poll looked at the demographics.


This clearly shows the split by age group. The younger a voter the more likely they were to vote Remain. It is not a minor relationship. 73% of 18-24s voted for Remain, whilst 40% of the 65% voted. Similarly, the younger a person the greater the time spent on social media such as Facebook.

2. Voting by area
Another, aspect is to look at the geographical analysis. Using Chris Hanretty’s estimates of the EU referendum results by constituency, I concluded that the most pro-Remain areas were the centre of major cities and in the University Cities of Oxford, Cambridge and Bristol. This is where the most vocal people reside.

The most pro-Leave areas were in the minor towns such are Stoke and Boston. Greater Manchester provided a good snapshot of the National picture. Of the 22 constituencies is estimated that just 3 has a majority remain vote. The central to the City of Manchester. The constituencies on the periphery voted to Leave, the strongest being on the east of Manchester and a few miles from the city centre. Manchester Central contains many of the modern flats and converted warehouses of Manchester. Manchester Withington has a preponderance of media types working at Media City for the BBC and ITV, along with education sector professionals.

These are the people who are not just geographically marginalised, but often feel politically marginalised as well.

Concluding comments

Overall, Professor Howard’s claims of late Facebook posts swinging the Referendum result are not credible at all. They are about as crackpot (and contradict) as the claims of Russian influence on the Brexit result.
To really understand the issues one needs to look at the data from different perspectives and the wider context. But the more dogmatic Remainers appear to be using their power and influence – backed by scanty assertions -to thrust their dogmas onto everyone else. This is undermining academic credibility, and the democratic process. By using the courts to pursue their dogmas, it also threatens to pull the legal system into the fray, potentially undermining the respect for the rule of law for those on the periphery.

Kevin Marshall

Did Brexit Influence the General Election 2017 Result?

In the year following the EU Referendum, I wrote a number of posts utilizing Chris Hanretty’s estimates of the vote split by constituency for England and Wales. Hanretty estimates that 421 of the 573 constituencies in England and Wales voted to leave. These estimates were necessary as the vote was counted by different – and mostly larger – areas than the parliamentary constituencies.

Politically, my major conclusion was that it was the Labour Party who could potentially suffer more from Brexit. There are two major reasons for this situation.

First, is that the Labour constituencies had a far greater spread of views than the Conservative constituencies. This is in both the divergence between regions and the disproportionate numbers of constituencies that are were either extreme Remain or extreme Leave in the referendum. Figure 1 is for the result for constituencies with Conservative MPs in 2016, and Figure 2 for constituencies with Labour MPs.

Figure 1: Constituencies in England and Wales with Conservative MPs in 2016, by estimated Leave or Remain Band. 

Figure 2: Constituencies in England and Wales with Labour Party MPs in 2016, by estimated Leave or Remain Band. 

In particular, London, where much of the current Labour Leadership are based, has views on the EU diametrically opposed views to the regions where most of the traditional Labour vote resides. Further analysis, from July 2016, is here.

Second, is the profile of the Leave supports. Based on an extensive poll conducted by Lord Ashcroft on EU Referendum day, Leave support was especially strong on those retired on a State Pension, council and housing association tenants, those whose formal education did not progress beyond secondary school, and the C2DEs. That is, groups that traditionally disproportionately vote Labour. Further details, from May 2017, are here.

Yet, the results of the snap General Election in June 2017 suggest that it was the Conservatives that suffered from Brexit. Despite their share of the popular vote increasing by over 5%, to the highest share in 25 years, they had a net loss of 13 seats and lost their majority. Labour increased their share of the vote by 10%, but only had a net gain of 30 seats.

Do the positions on Brexit appear to have had an influence? The Conservatives were seeking a stronger mandate for the Brexit negotiations, whilst Labour strongly avoided taken a firm position one way or the other. Chris Hanretty has revised his estimates, with the number of Leave-majority constituencies in England and Wales reduced from 421 to 401. The general picture is unchanged from the previous analysis. I have taken these revised figures, put them into the eight bands used previously and compared to the full election results available from the House of Commons Library.

The main seat results are in Figure 3.

Main points from Figure 3 (for England and Wales) are

  • Conservatives had a net loss of 25 seats, 14 of which likely voted Remain in the EU Referendum and 11 likely voted Leave. Remain seats reduced by 18% and Leave seats by 4%.
  • All 6 gains from Labour were in strongly Remain constituencies. This includes Copeland, which was gained in a by-election in early 2017 and retained in the General Election.
  • Labour had a net gain of 24 seats, 13 of which likely voted Remain in the EU Referendum and 11 likely voted Leave. Remain seats increased by 16% and Leave seats by 7%.

Figure 4 is the average percentage change in the constituency vote from 2015 to 2017 for the Conservative Party.

Main point from Figure 4 for the Conservative Party is

  • The estimated Referendum vote is a strong predictor of change in Conservative Party vote share from 2015 to 2017 General Election.

Figure 5 is the average percentage change in the constituency vote from 2015 to 2017 for the Labour Party.

Main points from Figure 5 for the Labour Party are

  • Overall average constituency vote share increased by 10% on the 2015 General Election.
  • In the 6 seats lost to the Conservatives, Labour’s share of the vote increased.
  • In every area, Labour increased its share of the constituency vote with one exception. In the 6 seats that the Liberal Democrats gained from the Conservatives, the Labour share of the vote was on average unchanged. This suggests some tactical voting.
  • In Conservative “hold” seats Labour’s increase in vote share did not have a “Remain” bias.
  • In Labour “hold” seats Labour’s increase in vote share had a strong “Remain” bias.

In summary, it would appear that the Conservatives in implementing Brexit have mostly suffered at the ballot in Remain areas. Labour, in being the Party of Opposition and avoiding taking a clear position on Brexit, benefited from the Remain support without being deserted by the Leave vote. I will leave it for another day – and for others – to draw out further conclusions.

Kevin Marshall

Update 23rd May

Whilst writing the above, I was unaware of a report produced by political pundit Prof John Curtice last December Has Brexit Reshaped British Politics?

Key findings

In the 2017 election the Conservatives gained support amongst Leave voters but fell back amongst Remain supporters. Labour, in contrast, advanced more strongly amongst Remain than amongst Leave voters.

That is pretty much my own findings by a different method. Both methods can produce different insights. My own approach can give regional analysis.

ManicBeancounter’s General Election Forecast 2017

Update 11/06/17

This forecast turned out to be widely incorrect. In a follow-up post I try to explore why it was incorrect. The major mistake I believe was to bend my forecast to a consensus of opinion. My follow-up post explores this further.

In the past few weeks there have been dramatic swings in the opinion polls. As a result of which I felt unable to update my forecasts. Although the Conservatives have fallen in the polls, and Labour have risen, it is a very inconsistent picture. One Yougov poll had Labour only one point behind the Conservatives. Yet Atul Hatwal at Labour Uncut believes from the canvassing returns, the Labour Party is in for a nuclear winter outside of London.

However, I will go Mike Smithson, the punters and most of the polls in predicting in showing a Conservative lead approaching double figures. Up from about 6% at the last General election, it is quite a small change considering the dramatic changes in the political landscape of the last couple of years. To use uniform swings based on the General Election 2015 would be absurd. My method has been

  • Start with the absurd. I use uniform swings – but by region – updating the post of 22nd May, with the forecast for a Tory majority of 28.
  • Kept the assumption of a Conservative revival at the expense of the SNP in Scotland, but with Labour now only slightly down on 2015. Assume that Labour are doing very well in London.
  • Assumed that in Labour constituencies where UKIP were strong in 2015, half the UKIP vote would go Conservative, and some of the Labour voters would stay at home. That is across the North of England and in Wales I am assuming a drop in turnout, which will be at the expense of Labour.
  • I have not made a general allowance for a drop in turnout. This could be significant given the appalling campaigns, and the weather forecast.

In Figure 1 is the General Election Result 2015

Figure 2 is my best guess, by region, of the result of tomorrow’s election.

This would give the Conservatives a majority of 76. This is much smaller than the forecasts in April, but much larger than that of even a week ago.

Figure 3 is the summary of seat gains

The Conservatives gain seats in Scotland, the North, Wales and the West Midlands. Labour still manages over 200 seats. Whilst this is down on 2015, it is better than Micheal Foot did in 1983, and the share of the popular vote is still around 35%, which could be higher than the share Tony Blair achieved when he won the General Election in 2005.

The part of the forecast where I will be closest is the seats with no change.

A quick look at other forecasts. Lord Ashcrofts’ constituency estimate is for majorities between 48 and 78. These are probabilistic estimates, so will not identify actual seats.

The Telegraph have published Chris Hanretty’s estimate of a 100 seat majority. Hanretty did some excellent work on the EU referendum, which I have utilized in a number of posts.

Who knows what tomorrow will bring. But having crude figures by constituency I can compare forecast with actual.

Update 8th June 18.30

Lord Ashcroft’s final estimates were published at 15.45 at Conservative Home. His central “combined probabilistic estimate” of 363 Conservative seats, giving a majority of 76, is exactly the same as mine. We differ on the other parties, as I am assuming Labour will do worse in their Northern heartlands, where disillusioned voters in the Brexit areas will stay at home. The Lib-Dems and Plaid Cymru I assume will do better due to strong local support.

Final-estimates-170608-768x527


Kevin Marshall

Tristram Hunt MP confirms the Labour split on Brexit

In July, following the Brexit vote, I made a couple of posts looking at Chris Hanretty’s has estimated EU referendum vote split for the 574 parliamentary constituencies in England and Wales. In the The Democratic Deficit in the Referendum Result, I concluded

The results show two things.
First is that there is a huge divergence in Referendum vote across the English and Welsh constituencies.
Second is that a disproportionate number of the constituencies with strong votes either for remaining in the EU or leaving the EU have a Labour Party MP.

The divergence is shown by two graphs of the Leave / Remain constituency split by region  – the overall result and the 231 constituencies with a Labour MP

The second post looked at the seats that Labour must win if it is to become the largest party at the next General Election. In England and Wales most of the target seats voted to leave the EU. But in Scotland, where Labour lost 40 seats to the SNP, every single constituency likely voted to remain in the EU. Further in London, which was strongly remain, reside about 40% of Labour members. There is a fundamental split.

One of the most Pro-Leave constituencies is Stoke on Trent Central. Pro-Remain Labour MP Tristram Hunt is resigning to take up the prestigious post of Director of the V&A Museum. Guido Fawkes had a post this afternoon TRISTRAM HUNT ON LABOUR’S EXISTENTIAL CRISIS.

Guido’s comment concurs with what I have concluded:-

In other words, Labour is increasingly irrelevant in Brexit Britain, and Tristram doesn’t have the answer…

Kevin Marshall

The Democratic Deficit in the Referendum Result

During the EU Referendum campaign all the main political parties backed the Remain campaign. The opinion polls predicted a final 52/48 split for the Remain vote. The final vote was 52/48 win for leaving the EU, sending shock waves around the world. This seems quite a narrow win. However, Chris Hanretty, a Reader in Politics at the University of East Anglia, has estimated the referendum vote split for the 574 parliamentary constituencies in England and Wales. The actual vote also covered the 76 constituencies in Scotland and Northern Island, along with Gibraltar. This was not a simple task, as the vote was counted by local Government areas, which rarely coincide with the constituencies. He estimated that 421 of these 574 constituencies likely voted for Leave.
However, there was no geographical split of the figures. I therefore classified the constituencies by region, along with putting the estimated vote into bands, with shades of green for a majority to Leave the EU and shades of pink/red for a majority to Remain in the EU.

There is a huge divergence between the regions. London was the only region to vote Remain in England and Wales, with 71% of constituencies in favour. The next nearest pro-EU region was the South East, with 39% of constituencies in favour. Furthermore London accounted for 22 of the 26 constituencies with greater than 70% of the vote in favour of Remain. What is quite worrying for future political consensus is that in 39% of constituencies the vote was at least 60% for a position for the majority vote.

The split by political party is also revealing. Of the 574 constituencies, 330 have Conservative MPs, 231 have Labour MPs and the remaining 12 seats are split between four other parties.
The Conservative constituency split is as follows.

The Conservative support is mostly in the South of England and the Midlands. The divergence is slightly less extreme than for the total, with 94 of the 330 constituencies having at least 60% for the majority vote.
The Labour Party constituency split is as follows.

The Labour Party support is mostly in the North of England, the West Midlands, London and Wales. The divergence in vote is more extreme than for the total, with 123 of the 231 constituencies having at least 60% Leave vote for the majority vote. Over half of the constituencies with a greater than 60% Remain vote in England and Wales (34 of 54) are Labour. Also over half of the constituencies with a greater than 60% Leave vote in England and Wales (89 of 168) are Labour. Yet Labour have just 40% of the Parliamentary seats. What is worse for the Party, the divergence is regional. The Remain constituencies are concentrated in London. All the other core regions have a strong Leave vote. Even worse, the Party activists are strongly Remain supporters and are behind efforts to annul the Referendum result.

In summary the results show two things.
First is that there is a huge divergence in Referendum vote across the English and Welsh constituencies.
Second is that a disproportionate number of the constituencies with strong votes either for remaining in the EU or leaving the EU have a Labour Party MP.

Kevin Marshall