Lewandowsky et al. 2012 MOTIVATED REJECTION OF SCIENCE – Part 4 Political Opinions

This is the fourth in a series on Lewandowsky, Oberauer & Gignac – NASA faked the moon landing:Therefore (Climate) Science is a Hoax: An Anatomy of the Motivated Rejection of Science (in press, Psychological Science).

This posting is further analysis of the data set sourced by Katabasis. (The data is now available from Bishop Hill) The previous post looked at the conspiracy theory question, whilst this looks at the link that the survey makes between free market ideas and rejection of climate science. From the abstract, this was the primary theme of the survey.

Abstract

Although nearly all domain experts agree that human CO2 emissions are altering the

world’s climate, segments of the public remain unconvinced by the scientific evidence.

Internet blogs have become a vocal platform for climate denial, and bloggers have taken a

prominent and influential role in questioning climate science. We report a survey (N

> 1100) of climate blog users to identify the variables underlying acceptance and rejection

of climate science. Paralleling previous work, we find that endorsement of a laissez-faire

conception of free-market economics predicts rejection of climate science (r≈:80 between

latent constructs). Endorsement of the free market also predicted the rejection of other

established scientific findings, such as the facts that HIV causes AIDS and that smoking

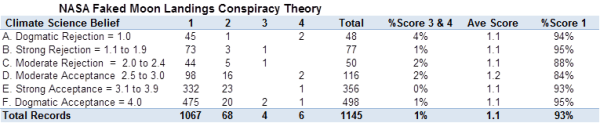
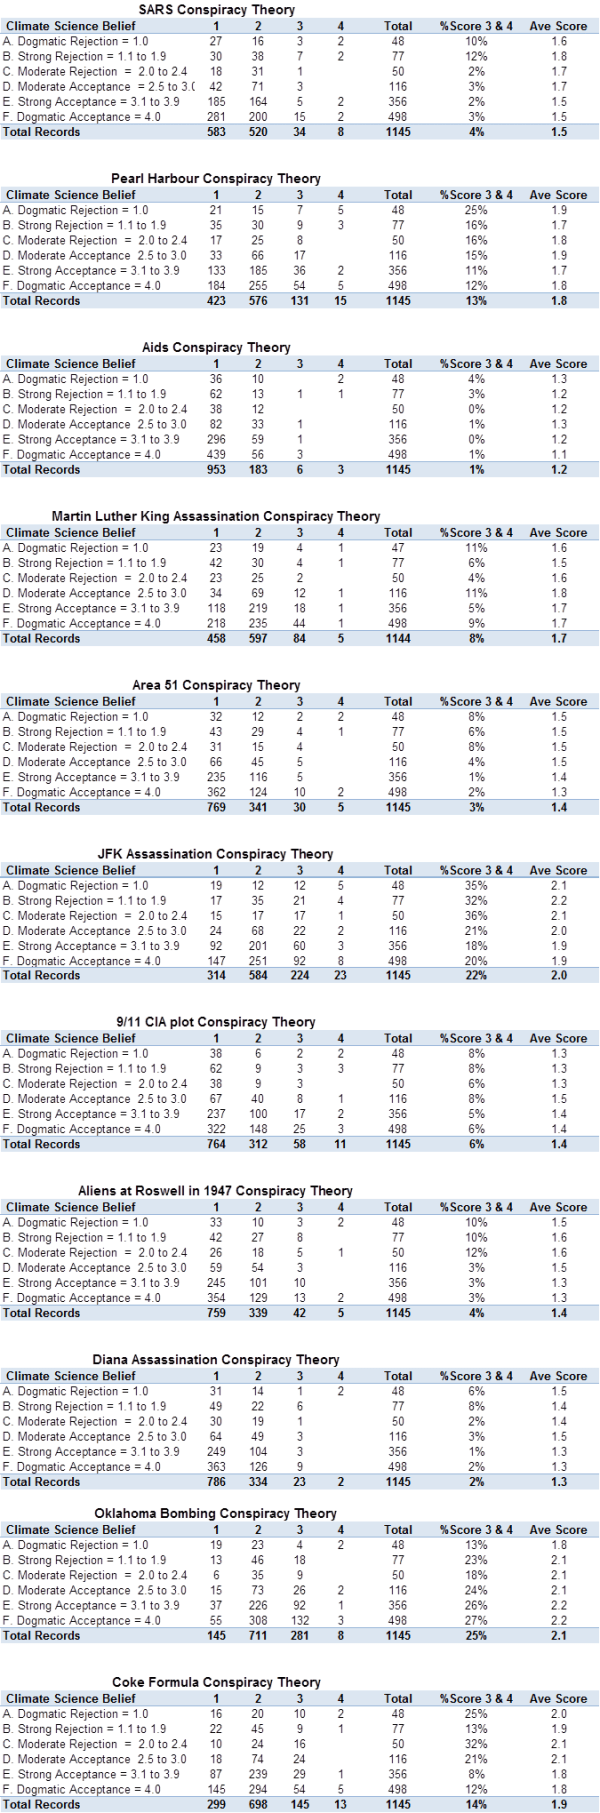
causes lung cancer. We additionally show that endorsement of a cluster of conspiracy

theories (e.g., that the CIA killed Martin-Luther King or that NASA faked the moon

landing) predicts rejection of climate science as well as the rejection of other scientific

findings, above and beyond endorsement of laissez-faire free markets. This provides

empirical confirmation of previous suggestions that conspiracist ideation contributes to

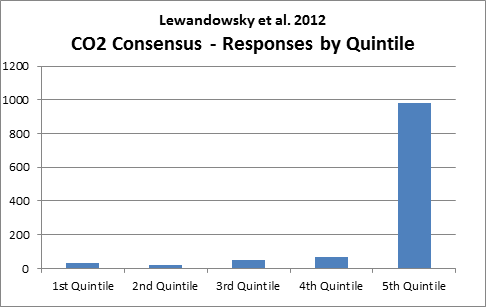
the rejection of science. Acceptance of science, by contrast, was strongly associated with

the perception of a consensus among scientists.

There were relatively few questions to identify the political views of the respondent.

The Free Market Questions

FMUnresBest An economic system based on free markets

unrestrained by government interference automatically

works best to meet human needs.

FMNotEnvQual I support the free market system but not at the expense

of the environmental quality.

FMLimitSocial The free market system may be efficient for resource

allocation but it is limited in its capacity to promote

social justice.

FMMoreImp The preservation of the free market system is more

important than localized environmental concerns.

FMThreatEnv Free and unregulated markets pose important threats

to sustainable development.

FMUnsustain The free market system is likely to promote

unsustainable consumption.

The Climate Science Questions

CO2TempUp I believe that burning fossil fuels increases atmospheric

temperature to some measurable degree.

CO2AtmosUp I believe that the burning of fossil fuels on the scale observed over the last 50 years has increased atmospheric temperature to an appreciable degree.
CO2WillNegChange I believe that the burning of fossil fuels on the scale observed over the last 50 years will cause serious negative changes to the planet’s climate unless there is a substantial switch to non CO2 emitting energy sources.
CO2HasNegChange I believe that the burning of fossil fuels on the scale observed over the last 50 years has caused serious negative changes to the planet’s climate.

The Results

The answers for the free market questions are from 1 (reject the free market) to 4 (complete agreement to free market).

The answers for the climate science questions are from 1 (totally Reject) to 4 (complete agreement).

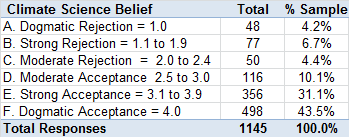
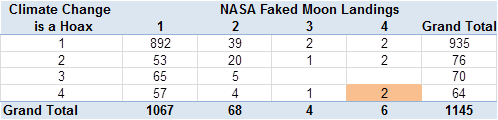
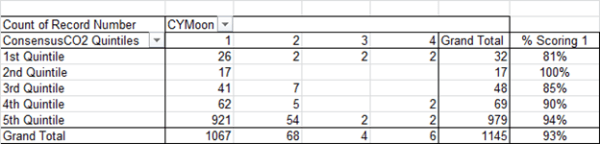
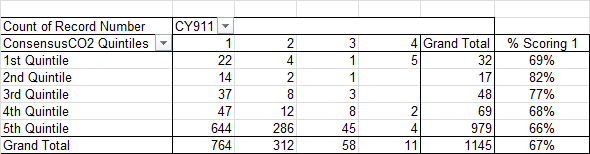
As in my previous posting, for the Climate Science questions I graded the answers to the four questions into groups based on the average score.


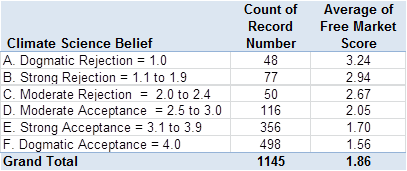
The answer is clear from the poll results. The stronger the support for free markets, the more likely one is to reject the climate science.

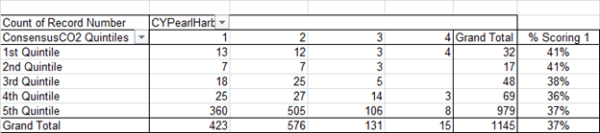
Taking the average score and rounding to the nearest whole number, the picture is even clearer.


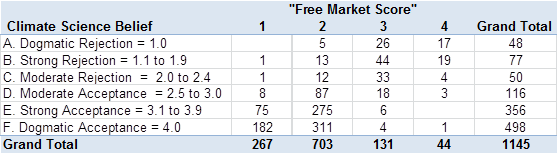
The more free-market the views expressed, the greater the rejection of the science. Does this substantiate Lewandowsky et. al’s assertions?

Err No.

There are some series issues with this result.

Firstly, the survey was only available on a certain type of blog. Depending on your point of view, they are either pro-science or alarmist. These are

http://www.skepticalscience.com
http://tamino.wordpress.com
http://bbickmore.wordpress.com
http://www.trunity.net/uuuno/blogs/
http://scienceblogs.com/illconsidered/
http://profmandia.wordpress.com/
http://scienceblogs.com/deltoid/
http://hot-topic.co.nz/

If you sample some of their articles, you will find a dogmatic defence of climate change, and blocking, editing or denigration views that are contrary to their own. To regularly trawl through articles that you disagree with takes a certain kind of person that may not be representative of the wider sceptic community. Given that the sceptic blogs attract a wider audience than the “pro-science” ones, the fact that only 15% of responses were from sceptics says that only a minority regularly visit the blogs antagonistic to their views. In other words, the survey is not representative of the true population of those interested in the climate change / global warming issues.

Then there are the questions themselves.

At first glance the questions do not allow for the middle ground. Many sceptics who are not libertarian in outlook have then a number of options.

  1. Some might quit the survey in disgust, thus creating a sample less representative of the true population. There was no record kept of the numbers of part completed surveys, nor the point at which they were completed. The lack of neutrality and narrowness of the range of questions suggests that might be material.
  2. The second is to answer questions in opposition to the climate consensus. That is the join in coalition to free-marketers to oppose the environmentalist ideology. This is quite logical. Environmentalist ideology can be viewed as increasing authoritarianism, constraining economic growth (and thus the prospect of ever-rising standards of living) along with regressive cost increases in electricity and fuel for cars. In other words, those who want the status quo to be maintained join in coalition with those who want the direction of change to be the opposite of where environmentalists are pulling. There is no risk here for the moderates. Libertarianism is nowhere a major political force.

Let us look at the average response for each question to see if this is suggested.


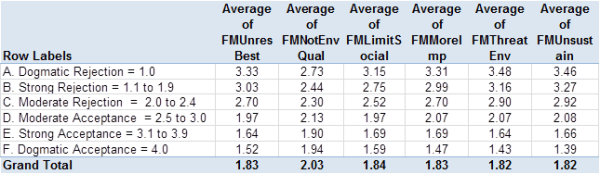
The most pragmatic question is the least polarized. People may support a position ideologically, but will compromise if there is a demonstrable need or benefit. Conversely the last two questions are the most ideological. A lot of people are motivated to oppose a movement that is contrary to their own beliefs. In other words, the nature of the questions further drives people into opposing camps.

How should Lewandowsky have approached these problems? If he was an objective scientist, Lewandowsky would have sought advice from professional pollsters on the content of the questions. They would have advised more neutral, and a broader range of questions to enable people to express a range of views. They would have also advised validity checks to make sure the survey results were representative of the population at large. But Stefan Lewandowsky is not an objective scientist. His agenda is to prevent any opposition to the ideology he and others promote.

Are there any conclusions to be drawn?

The biases in the free market questions apply to those who reject climate science. However, as a survey of those who accept the climate science, it is more valid.

Firstly the sample size is significant. Merging the six groups into 3 gives:-


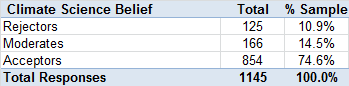
The sample size of 854 is quite large, and more than six times the size of those who reject climate science.

Secondly, the sample is likely to represent the true population of “Acceptors”, as it was placed on the blogs that they frequent.

Thirdly, as the survey was devised by people sympathetic to their point of view, the abandonment rate should not have been any higher than for more neutral polls.

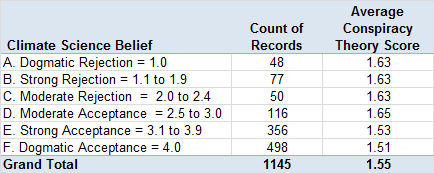
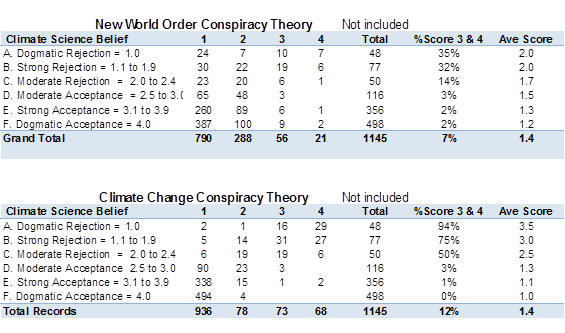
The major conclusion is that those who “accept the science” have no truck with conspiracy theories. On political opinions, they strongly support an ideology which promotes the environment at the expense of economic growth and economic freedoms. That is the, planet should be given a higher priority relative to the people that live on it.

Thus the true result of the survey data is not that those who oppose climate science are nutters. Rather, it is that those who support climate science have views that are at odds to, and contrary to the best interests of, the vast majority. We have not got here the justification to silence the opposition, but giving them due weighting.


Lewandowsky et al. 2012 MOTIVATED REJECTION OF SCIENCE – Part 3 Data Analysis of the Conspiracy Theory element

A month ago made two postings on the paper Lewandowsky, Oberauer & Gignac – NASA faked the moon landing:Therefore (Climate) Science is a Hoax: An Anatomy of the Motivated Rejection of Science (in press, Psychological Science). In the first I showed that an opening statement about the beliefs of climate scientists was not supported by the references. The second raised some questions, which owing to a lack of data I was unable to answer.

When Katabasis offered in the comments at Jo Nova’s blog to provide the raw data for the paper I took him up on the offer.

The paper’s major findings were on the link between climate denial and belief in free markets. However, I first want to deal with the aspect of the link with beliefs in conspiracy theories due to

  1. the title
  2. The articles that have appeared in the Guardian and Telegraph newspapers.
  3. The following from the conclusion
  4. Also consider this from the conclusion

    “However, to our knowledge, our results are the first to provide empirical evidence for the correlation between a general construct of conspiracist ideation and the general tendency to reject well-founded science.”

The lead author, Prof. Stefan Lewandowsky has a history of dogmatically defending climate science, often by attacking the opponents. However, that is no reason to reject the results of a published scientific paper if those results are substantiated by the evidence.

The survey was posted on a number of climate blogs of all the same persuasion. Depending on your point of view, they are either pro-science or alarmist. These are

http://www.skepticalscience.com
http://tamino.wordpress.com
http://bbickmore.wordpress.com
http://www.trunity.net/uuuno/blogs/
http://scienceblogs.com/illconsidered/
http://profmandia.wordpress.com/
http://scienceblogs.com/deltoid/
http://hot-topic.co.nz/

If you sample some of their articles, you will find a dogmatic defence of climate change, and blocking, editing or denigration views that are contrary to their own. The claim in the paper that they contacted five sceptical blogs to improve the spread of views is highly suspect.* Jo Nova contacted 24 such blogs (including all the most prominent ones), with not a single one remembering such an approach. Prof. Lewandowsky is currently refusing to divulge the names of the blogs contacted. As there was no proper control of the answers, there could be rogue results generated.

Identification of those who “Reject the Science”

There were four questions on beliefs about “Climate Science”

CO2TempUp I believe that burning fossil fuels increases atmospherictemperature to some measurable degree.
CO2AtmosUp I believe that the burning of fossil fuels on the scale observed over the last 50 years has increased atmospheric temperature to an appreciable degree.
CO2WillNegChange I believe that the burning of fossil fuels on the scale observed over the last 50 years will cause serious negative changes to the planet’s climate unless there is a substantial switch to non CO2 emitting energy sources.
CO2HasNegChange I believe that the burning of fossil fuels on the scale observed over the last 50 years has caused serious negative changes to the planet’s climate.

The answers were from 1 (totally Reject) to 4 (complete agreement).

I found the average score for each respondent, graded and plotted the count.


Or summarising into 3 categories


As to be expected from the nature of the blogs where it was published, more than 4 in 10 gave the highest score and 85% are more positive than negative in their beliefs. The poll only includes 125 or 175 responses of those who “reject the science”.

Linking to Conspiracy Theories

The survey is about those who reject the science being more likely to believe in weird conspiracy theories than acceptors of the science. As Jo Nova puts it, the climate sceptics are meant to be nutters.

There were 14 conspiracy theories presented. Two (on New World Order and Climate Change) I will leave out for now as they are not entirely independent of the subject. Of the 12 remaining I took the average score. If the general hypothesis is correct, the more strongly the rejection of the science, the greater the score on conspiracy theories.


There is no significant relationship here at all. The typical respondent gives little or no credence to conspiracy theories.

To understand this better, I rounded the average score for each respondent to the nearest whole number. The pivot table is now.


There is no relationship here. The outlier is the two respondents with an average score of 4. One put a 4 for all, and the other put 4 on 11/12 and 3 on the other. These are clearly rogue responses and should have been removed as outliers from such a small sample. If removed, the average conspiracy theory score for those who dogmatically reject climate science conclusions drops to 1.49, the lowest of any group.

So what of the conspiracy theory that most the moon landings were faked? The one in the title “NASA faked the moon landing:Therefore (Climate) Science is a Hoax: An Anatomy of the Motivated Rejection of Science


45 out of 48 of those who dogmatically reject climate science, also dogmatically emphatically reject the conspiracy theory. The two who score 4 are rogue results.

In fact, the response is pretty emphatic in every group. Consider the abstract.

We additionally show that endorsement of a cluster of conspiracy theories (e.g., that the CIA killed Martin-Luther King or that NASA faked the moon landing) predicts rejection of climate science as well as the rejection of other scientific findings, above and beyond endorsement of laissez-faire free markets.

Maybe the correlation was with the Climate Science Conspiracy Theory?


If you take out the two rogue responses, then if any comment were to be extracted it would surely be the other way round. However, it is not significant, and internet responses get some rogue results on all sides.

Let me be quite clear. The title of the paper makes a false claim from authors with an agenda of silencing opponents. It is entirely without any proper evidence.

The other eleven results are below


Finally, the two conspiracy theories not included.


*Update 11th Sept see reply to Prof Lewandowsky at comment 120

Lewandowsky et al 2012 – Data Analysis part 1

Katabasis offered in the comments at Jo Nova’s blog to provide the raw data for the paper

“NASA faked the moon landing  — Therefore (Climate) Science is a Hoax:

An Anatomy of the Motivated Rejection of Science”

  Lewandowsky, S., Oberauer, K., & Gignac, C. E. (in press) Psychological Science

I took Katabasis up on the offer. Here are some preliminary results.

Please see DR_UK’s comment below

The CONSENSCO2 question was

Out of 100 climate scientists how many do you think believe that human CO2 emissions cause climate change?

In other words is it a questions about what you believe about what others believe. The comparison should be with the results of the four questions on the respondent’s own beliefs in Climate Science to be found on Page 27 of the paper. The results I hope to post up later today. The sample skew is the similar. 75% of the respondents have strong beliefs in climate science, 14% have weak beliefs and just 11% – 125 respondents – reject the science. I will post later on the revised tables. 

Q. Was the sample size sufficient?

Lewandowsky et al 2012 say

We report a survey (N > 1100) of climate blog users to identify the variables underlying acceptance and rejection of climate science.

However they do not state the proportion of respondents on which they based the results – that is those who reject the science. The data summarizes the climate results as “Consensus C02” on a scale of 0 to 100. That is 0 is complete rejection through to 100 as complete acceptance. The CONSENSCO2 question was

Out of 100 climate scientists how many do you think believe that human CO2 emissions cause climate change?

I divided the results into 5 bands to see the skew.


Fully 86% of responses largely accept the C02 consensus respondents believe that the vast majority of climate scientists believe that human CO2 emissions  and just 3% (32) strongly reject it. believe that a the vast majority are concealing the truth or lying.

This is not surprising, as the survey was only published on militant alarmist blogs such as SKEPTICALSCIENCE, TAMINO and DELTOID. Jo Nova has so far contacted 24 “skeptic” blogs, not one of whom says they received a request to publish the link to the survey.

Some of the raw results

Some quick pivot tables against the results.

Moon Landings


Comment: “Alarmists” are just as much conspiracy theorists as “Skeptics”

JFK Assassination


Comment: Not much difference here either between “Alarmists” and “Skeptics”

Martin Luther King Assassination


Comment: Not much difference here either between “Alarmists” and “Skeptics”

Diana “Assassination”


Comment: A slight much difference here between “Alarmists” and “Skeptics” – by 5 or 6 skeptic responses.

9/11 Conspiracies


Comment: Not much difference here either between “Alarmists” and “Skeptics”

Pearl Harbour Conspiracies


Comment: Not much difference here either between “Alarmists” and “Skeptics”

SARS Conspiracies


Comment: Not much difference here either between “Alarmists” and “Skeptics”

Preliminary Conclusion

Readers the climate alarmist blogs are full of weird conspiracy theories. Where people that frequent these blogs rate themselves on acceptance of the CO2 Consensus makes little difference to this conclusion. Given that these blogs exist to discourage any views but their own, it is not surprising that their readership:-

  1. Share a similar, unbalanced, way of evaluating evidence to the blogs authors.
  2. Are predominantly in agreement with the views promoted.

RWE Atlantic Array to gain GBP169m in Windfall Profits

I have worked in management accounts in manufacturing industry for over 25 years. In that time I have learnt that audit controls are imposed to stop the potential for fraud, by eliminating any scope for fraud. In Britain climate change arena, conflicts of interest are huge, but not considered important. This is an example of why truly independent oversight is required.

In July there was ministerial sign-off of a proposed to change the Renewables Obligation (RO) with respect to offshore wind power. Assuming that this proposal is enacted and the Atlantic Array gets the green light, I calculate will give a £169m (US$262m) windfall profit to the scheme in the first ten years of operation.

The numbers behind this are eye-watering.

The revenue from a wind farm is from selling the electricity produced to the grid. This is currently 4.7p per kwh. I will assume that this will remain constant for until 2025. This might be a heroic assumption given that under current policies Britain will be producing far less electricity than demanded, but it is beside the point of this posting. What is relevant is the subsidy from electricity bills. The RO currently gives renewables a subsidy of £41.38 per megawatt hour. This is the rate for onshore wind. However, to encourage offshore wind power, this currently attracts a factor of 2.0 times the standard rate. In 2009 this was planned to reduce to 1.5 times the standard rate from 2014*. The new proposals are to give a more gradual and delayed decrease to 1.9 in 2015/16 and 1.8 in 2016/17. I have assumed that this will continue until the 1.5 level is reached.

In Germany the average output from the wind farms is just 16.3%. However, Britain is somewhat more exposed, especially the Bristol Channel. It is reasonable to assume to that average output will be 25% of capacity. Then I have assumed that RWE will choose to build the maximum proposed capacity of 1390MW. The lower end is 1000MW.

Calculations over a 10 year period are


The difference will mean an extra £168,572,951 windfall for RWE.

There is however a potential flaw in my analysis. If the Renewables Obligation works like the solar panels for houses, then the rate is fixed at the time of application. In other words, a scheme coming on stream in 2015 would now attract 2.0 ROC, instead of 1.5 for every year for 10 years.


If my analysis is correct, the difference will mean an extra £684,633,697 windfall for RWE over a 10 year period. That is $1.07 bn dollars. This from (the largest) of a number of similar projects.

Stop the blighting of Lundy & North Devon by RWE’s Atlantic Array

Please act to help stop a major act of vandalism to the British Coastline. Visit the Slay the Array site by 31st of August to find out how to help.

I have just returned from a holiday in North Devon, including a day trip to Lundy Island. Here I learnt about a mega wind farm proposed for the Bristol Channel by energy giant RWE. This is an area of outstanding coastal beauty, attracting millions of tourists annually to the area.

Proposed are 188 to 278 turbines, of either 180 or 220 metres (590 or 722 feet) in height, located as near as 13km (8 miles) from Lundy and 14km (9 miles) from the North Devon Coast.

Compare this with the second highest point on Lundy. The small building in the photograph is Tibbetts, 128 metres (420 feet) above sea level.


Or compare in height to some London skyscrapers.

Tower 42 (formerly the Natwest Tower) is 183m

The Gherkin (30 St Mary’s Axe) is 180m

One Canada Square, Canary Wharf is 235m

In Manchester, the tallest building is the Beetham Tower at just 169m tall, whilst the older Blackpool Tower, that dominates the resort’s skyline, is a mere 158 metres.


Another comparison is to the Skegness wind farm. Here there are just 57 134 metre-high turbines located 5km from shore. It has blighted the outlook from the beach level at Skegness. This picture I took at Easter of this year, on a very grey day. Better pictures are available here. The pictures do not fully recreate the visual impact, as the eye is drawn to the turning blades – or in the case of Skegness the difference between those blades that were turning, and the large number which were not.

Yet Skegness is a declining resort, not noted for its scenery. It does not have high cliffs from which to look out at a distant coastline. There is no equivalent of Butter Hill at Countisbury or the cliff tops of Lundy where you can survey the coastline of Wales. Should this Atlantic Bristol Channel Array go ahead, the eye will be drawn instead to the turning mega turbines, as the scenery.

The Bias of Climatology – Pulling Recent Strands Together

David Evans has provided a succinct explanation of why climate scientists’ theories, ignore some fundamental data. The views that feedbacks amplify the effects of CO2 (see Evans’s diagram below) is due to a highly selective reading of the data in a number of different ways.


Now we need to pull the recent strands together.

On actual temperature history we are getting evermore examples of data manipulation, whether on US temperatures (A Watts), Australian Temperatures (See Jo Nova), or the GISSTEMP global surface temperatures (Steven Goddard).

On past temperature history, we have the famous hockey stick graphs, starting with Mann et al in 1998 and culminating in the recent Gergis et al Australasian temperature reconstruction. All need a combination of one, or a few, very poor data sets that are promoted to prominence by statistical techniques unique to climatologists, and ignoring better quality data sets.

Something else needs to be added to the mix to obtain the high role for feedbacks – climate modelling. If recent temperature trends are exaggerated AND past temperature fluctuations smoothed out, then running a model that tries to look at relative influence of natural and anthropogenic factors on temperature will massively over-estimate the anthropogenic over the natural influences.

But go the other way. Look at the more accurate satellite data for recent temperatures and the temperature rises do not track the CO2 rises nearly so well. Go back to the raw data from the thermometers (adjusting properly for UHI), along with homogenization techniques developed by professional statisticians and the C20th warming deflates.

Then take the widest range of proxy records over a long period (even leave in the lowest quality ones) and suddenly the picture looks very different.

Then look at the role of feedbacks from a number of different perspectives, like Sherwood Idso, (possibly further corroborated by Esper et al 2012) and the real picture becomes clearer. Global average temperatures have increased in the last 200 years. Not quite as much in recent years as the temperature records maintain, but are now significantly higher than in during the 17th century. Furthermore, there is circumstantial evidence that a part of this increase (even up to 0.4 Celsius if non-C02 GHGs are included) has been due to the human greenhouse gas emissions. But this is a curiosity for a few academics to ponder, whilst the thrust of the research effort is put into improving the accuracy and integrity of the data.

Defence of the Consensus

The response of mainstream climatology (and with it a vast array of hangers-on) is not to improve the standards and moderate their wilder comments. Instead it has been to shut down debate by attacking the opponents. Australia has the unfortunate achievement to be home to two of the vilest the proponents of this assault on dissent. Prof Stephan Lewandowsky’s latest instalment is publishing a survey which associates climate skeptics with the worst of the conspiracy theorists. John Cook, a climatologist, ignores expert etymologists to justify calling his site skepticalscience.com

Climatology does not rank as a true science, as it has long since abandoned the search for challenging questions and improvements in quality of answers. Rather than explain the anomalies and meet the challenge of alternative explanations, climatology protects itself by employing intellectual bully-boys.

Lewandowsky et al. 2012 MOTIVATED REJECTION OF SCIENCE – Part 2

This post was based on the belief that the survey I took in June was the one used in the paper. I realize now this is not the case. The one I took at “Watching the Deniers” is a development of the 2010 survey. There are less questions on conspiracy theories (but “NASA faked the moon landing”, along with Diana, JFK and MLK assassinations are are still in) along with exactly the same questions on Free markets v Environmentalism. But the new survey has more on political beliefs (a good thing in my view) along with new sections on religious beliefs and GM foods. The summary I made back in June is here.

The paper Lewandowsky, Oberauer & Gignac – NASA faked the moon landing|Therefore (Climate) Science is a Hoax: An Anatomy of the Motivated Rejection of Science (in press, Psychological Science) is one of the biased and pernicious surveys I have come across. The previous posting was on the opening remarks on the validity of climate science. There are a few points where the survey deviates from a professional and balanced opinion survey.

Problems with the survey

  1. The access to the survey. It was an internet based survey, with links posted on 8 “pro-science” blogs. Five skeptic blogs were approached. As such, one would expect that “pro-science” responses would far outweigh “denialist” responses. I cannot find the split.
  2. There should have been a record kept of abandoned survey results. The survey gets more dogmatic as it progresses, and becomes far longer than originally stated (74 questions, as against 40 in 10 minutes quoted at the outset). Moderate skeptics would have quickly abandoned the survey when they realised what was being inferred. Others, as the questions became more time consuming and “weird”. See if this is a valid conclusion by first reading the questions, then my analysis.
  3. Not reported is the relationship between “climate denial” and genetically modified foods. Is the correlation the reverse? Nor is there any reporting of the section on climate change against conservative Christian religious views, or climate change against views on corporations. The survey only reported the most dogmatic results. Could it be that there is something relevant, but adverse to the desired conclusions here, or no relationship?
  4. There were also final questions on age and gender. Again, this should be reported.
  5. The main inference of the survey is that those who oppose climate change science are nut-jobs, whilst those who agree with it are pro-science. This saves having to explain the lack of any credible scientific evidence for the projected global catastrophe that we all need to be saved from.

Lewandowsky et al. 2012 MOTIVATED REJECTION OF SCIENCE – Part 1

The paper Lewandowsky, Oberauer & Gignac – NASA faked the moon landing|Therefore (Climate) Science is a Hoax: An Anatomy of the Motivated Rejection of Science (in press, Psychological Science) is one of the most biased and pernicious surveys I have come across. This posting is about the opening remarks.

The paper starts by accepting the validity of science is from beliefs of scientists.


More than 90% of climate scientists agree that the global climate is changing largely due to human CO2 emissions (Anderegg, Prall, Harold, & Schneider, 2010; Doran & Zimmerman, 2009)

The first paper simply says that of the climate scientists who are convinced of climate change arguments as far more numerous and publish far more than scientists that are unconvinced. The most positive spin you can put on this is that those who believe in and are passionate about what they are doing tend to succeed more than those who don’t. You would probably find similar proportions of belief within New Testament theology or Marxian economics. It says nothing about the truth and the validity of the main claim – unless we act quickly to reduce global carbon emissions, the planet is heading for catastrophic global warming.

The second paper asked two questions:-

1. When compared with pre-1800s levels, do you think that mean global temperatures have generally risen, fallen, or remained relatively constant?
2. Do you think human activity is a significant contributing factor in changing mean global temperatures?

It is only the second question that mentions the human element. In maths “largely” (i.e. > 50%) is a subset of “significant” (a measurable part). Neither is CO2 the only human factor causing climate change (Methane plus other gases increase the greenhouse effect, aerosols offset the warming). Further, the Doran and Zimmerman paper is (to put it charitably) is a hugely flawed survey. Reference to it in another “peer reviewed” survey shows does not bode well for the quality of the results.

Analysis of the Survey Questions here and actual questions here

Esper et al 2012 Orbital forcing of tree-ring data – Corroborating the Sceptic Position

A new summer temperature reconstruction using of tree ring densities in Northern Scandinavia stir, raising some difficult questions for those who believe that C20th warming was caused by human activity

There are a couple of elements that corroborate sceptical beliefs that are not alluded to elsewhere.

Pointer to a low influence of CO2

There has been a decline in summer temperatures of 0.6 degrees.


From the abstract

Solar insolation changes, resulting from long-term oscillations of orbital configurations1, are an important driver of Holocene climate23. The forcing is substantial over the past 2,000 years, up to four times as large as the 1.6 W m−2 net anthropogenic forcing since 1750

That is (From the supplementary information figure S13), a decline in temperatures of around 0.6 Celsius is due to a net reduction in orbital forcings of 6 W m−2.

From a 1998 article by Sherwood Idso* on climate sensitivities,

a total greenhouse warming of approximately 33.6°C sustained by a thermal radiative flux of approximately 348 W m–2

That is 6 W m−2 gives approximately 0.6 degrees temperature change. This implies 1.6 W m−2 gives approximately a 0.16 degree temperature change, so CO2 is not the largest influence on C20th warming.

Pointer to the global temperature adjustments being wrong

Yesterday I reblogged pieces of evidence by Steven Goddard indicating that the historical temperature record has been systematically manipulated. In particular, the inter-war warming has been reduced, whilst recent warming has been increased. From the paper, this abstract of the more recent warming trends.

Now compare with two versions of the Reykjavik mean temperatures to see which is closer. I know that Reykjavik is between 50 and 350 miles south of the area surveyed, but it does seem to corroborate one version over the other.

A possible alternative explanation to the lower late C20th temperatures  is in the comments at NoTricksZone. DirkH says

The line actually becomes unreliable from 1912 to the present as it is done with a “100 year spline filter” the paper says. Don’t give to much on the shape of the final wiggle. Can’t find any more information but obviously the window for the filter shrinks near the end, how will it react? Dunno…

Hu McCulloch ain’t too impressed: (2009)

http://climateaudit.org/2009/08/23/spline-smoothing/

*Joanna Nova has a summary here.

Gergis 2012 Mark 2 – Hurdles to overcome

BishopHill reported yesterday on the withdrawn Gergis paper that

The authors are currently reviewing the data and methods. The revised paper will be re-submitted to the Journal of Climate by the end of July and it will be sent out for peer review again.

It is worth listing the long list of criticisms that have been made of the paper. There are a lot of hurdles to overcome before Gergis et al 2012 should qualify for the status of a scientific paper.

My own, quite basic, points are:-

  1. Too few proxies for such a large area. Just 27 for > 5% of the globe.
  2. Even then, 6 are well outside the area.
  3. Of these six, Gergis’s table makes it appear 3 are inside the area. My analysis is below.


  4. Despite huge area, there are significant clusters – with massive differences between proxies at the same or nearby sites.
  5. There are no proxies from the sub-continental land mass of Australia.
  6. Need to remove the Palmyra Proxy because (a) it has errant readings (b) fails the ‘t’ test (c) > 2000km outside of the area, in the Northern Hemisphere.
  7. Without Palmyra the medieval period becomes the warmest of the millennium. But with just two tree ring proxies, one at 42 O South and the other at 43 O S representing an range from 0 to 50O S, this is hardly reliable. See the sum of proxies by year. Palmyra is the coral proxy in the 12th, 14th and 15th centuries.


On top of this are Steve McIntyre’s (with assistance from JeanS and RomanM) more fundamental criticisms:-

  1. The filtering method of Gergis excluded the high quality Law Dome series, but included the lower quality Vostok data, and the Oroko tree ring proxy. McIntyre notes that Jones and Mann 2003 rejected Oroko, but included Law Dome on different criteria.
  2. Gergis screening correlations were incorrectly calculated. JeanS calculated properly. Only 6 out of 27 proxies passed. (NB none of the six proxies outside the area passed)


  3. The Gergis initially screened 62 proxies. Given that the screening included proxies that should not have included 21 proxies, but should it have included some of the 35 excluded proxies. We do not know, as Gergis has refused to reveal these excluded proxies.
  4. Screening creates a bias in the results in favour of the desired result if that correlation is with a short period of the data. RomanM states the issues succinctly here. My, more colloquial take, is that if the proxies (to some extent) randomly show C20th warming or not, then you will accept proxies with a C20th uptick. If proxies show previous fluctuations (to some extent) randomly and (to some extent) independently of the C20th uptick, then those previous fluctuations will be understated. There only has to be a minor amount of randomness to show bias given that a major conclusion was

    The average reconstructed temperature anomaly in Australasia during A.D. 1238-1267, the warmest 30-year pre-instrumental period, is 0.09°C (±0.19°C) below 1961-1990 levels.

UPDATE 03/08/12

The end of July submissions date seems to have slipped to the end of September.